Data Center IT Infrastructure Market Analysis, Size, and Forecast 2026-2030: North America (US, Canada, and Mexico), Europe (Germany, UK, and France), APAC (China, Japan, and India), South America (Brazil and Argentina), Middle East and Africa (Saudi Arabia, UAE, and South Africa), and Rest of World (ROW)

Data Center IT Infrastructure Market Analysis, Size, and Forecast 2026-2030:
North America (US, Canada, and Mexico), Europe (Germany, UK, and France), APAC (China, Japan, and India), South America (Brazil and Argentina), Middle East and Africa (Saudi Arabia, UAE, and South Africa), and Rest of World (ROW)

Published: Apr 2026 324 Pages SKU: IRTNTR41055

Market Overview at a Glance

$112.38 B
Market Opportunity
7.2%
CAGR 2025 - 2030
40.6%
North America Growth
$81.22 B
Server infrastructure segment 2024

Data Center IT Infrastructure Market Size 2026-2030

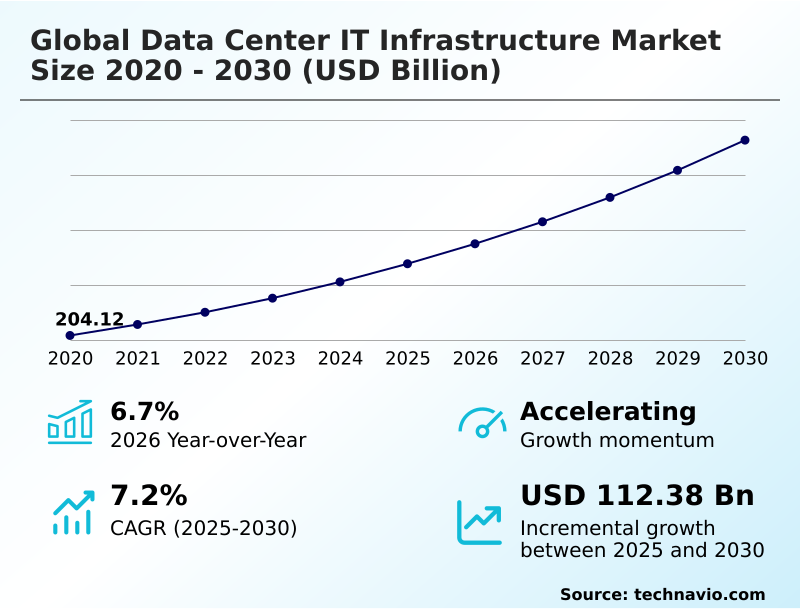
The data center it infrastructure market size is valued to increase by USD 112.38 billion, at a CAGR of 7.2% from 2025 to 2030. Exponential growth of hyperscale cloud services and digital transformation initiatives will drive the data center it infrastructure market.

Major Market Trends & Insights

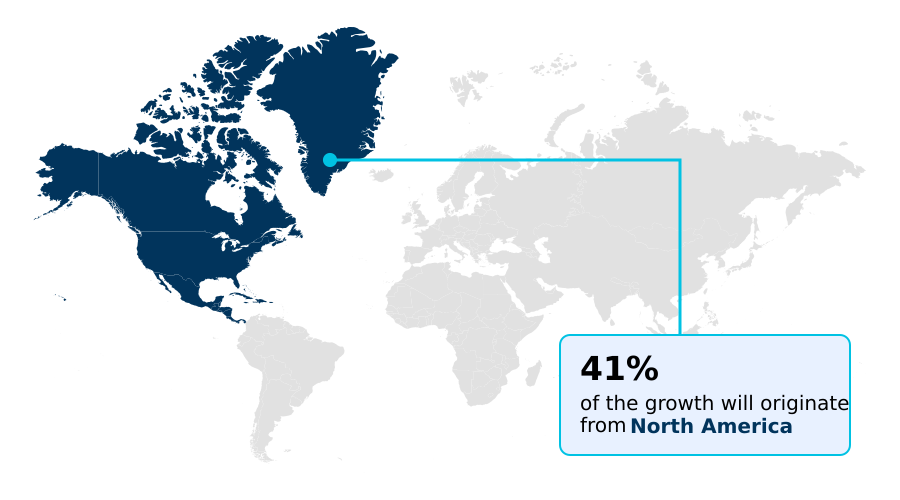
  • North America dominated the market and accounted for a 40.6% growth during the forecast period.
  • By Component - Server infrastructure segment was valued at USD 81.22 billion in 2024
  • By End-user - BFSI segment accounted for the largest market revenue share in 2024

Market Size & Forecast

  • Market Opportunities: USD 177.57 billion
  • Market Future Opportunities: USD 112.38 billion
  • CAGR from 2025 to 2030 : 7.2%

Market Summary

  • The data center IT infrastructure market is undergoing a significant architectural evolution, driven by the dual pressures of digital service delivery and operational efficiency. The backbone of the digital economy, this market includes the essential server infrastructure, storage infrastructure, and low-latency networking equipment required to process and manage escalating data volumes.
  • A key trend is the move toward workload optimization, where specialized hardware like graphics processing units is deployed to handle AI and other data-intensive workloads more effectively. For instance, a financial services firm might deploy an all-flash storage array to reduce trade analysis times, thereby gaining a competitive edge.
  • This is balanced by challenges such as geopolitical trade restrictions, which can disrupt supply chains for critical components. Simultaneously, the push for sustainable data center operations influences procurement strategies, favoring energy-efficient hardware. The interplay between performance demands, cybersecurity risks, and regulatory compliance, particularly around data sovereignty, defines the strategic landscape for enterprises navigating their IT modernization journey.

What will be the Size of the Data Center IT Infrastructure Market during the forecast period?

Get Key Insights on Market Forecast (PDF) Request Free Sample

How is the Data Center IT Infrastructure Market Segmented?

The data center it infrastructure industry research report provides comprehensive data (region-wise segment analysis), with forecasts and estimates in "USD million" for the period 2026-2030, as well as historical data from 2020-2024 for the following segments.

  • Component
    • Server infrastructure
    • Storage infrastructure
    • Software-defined data center
    • Network infrastructure
    • Others
  • End-user
    • BFSI
    • Energy
    • Information system
    • Others
  • Type
    • Hyperscale data center
    • Colocation data center
    • Enterprise data center
    • Edge data center
  • Geography
    • North America
      • US
      • Canada
      • Mexico
    • Europe
      • Germany
      • UK
      • France
    • APAC
      • China
      • Japan
      • India
    • South America
      • Brazil
      • Argentina
    • Middle East and Africa
      • Saudi Arabia
      • UAE
      • South Africa
    • Rest of World (ROW)

By Component Insights

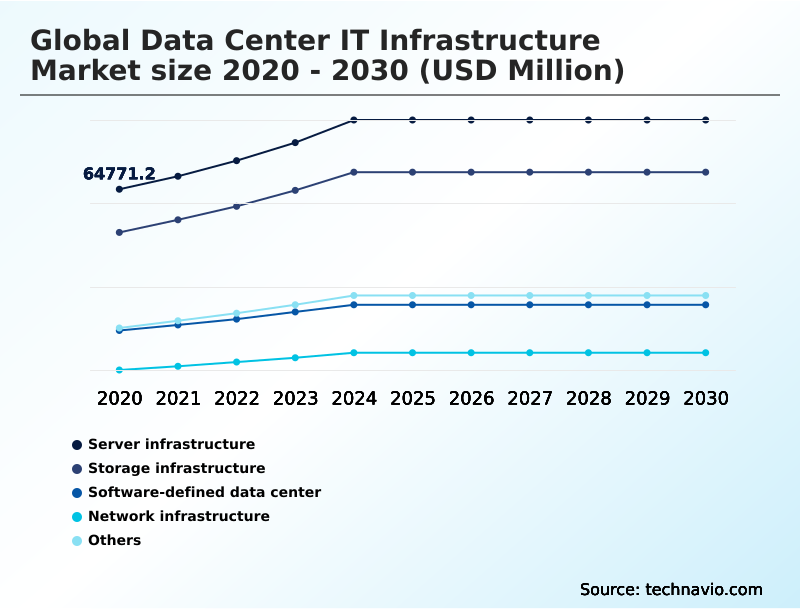
The server infrastructure segment is estimated to witness significant growth during the forecast period.

The server infrastructure segment forms the computational backbone of the data center IT infrastructure market, encompassing everything from traditional rack servers to high-density blade systems and specialized multi-node servers.

This area is driven by a constant demand for increased processing power to handle data-intensive workloads and enterprise IT modernization. A key market dynamic is the architectural shift toward distributed, scale-out systems that enhance operational resilience and offer linear scalability.

This evolution fuels innovation in server design, focusing on modularity and optimized performance-per-watt, with some advanced configurations improving workload allocation efficiency by up to 15%.

This segment, crucial for both enterprise data center and hyperscale data center environments, sees continuous refresh cycles as organizations adopt high-performance servers and scalable storage systems to power every digital initiative.

Request Free Sample

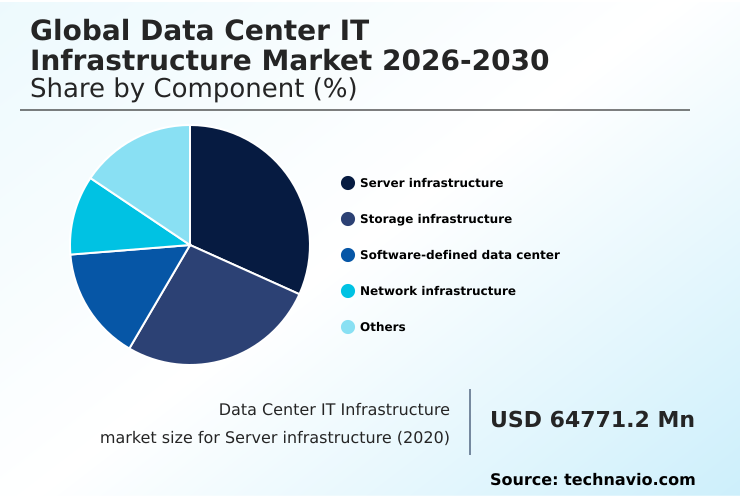
The Server infrastructure segment was valued at USD 81.22 billion in 2024 and showed a gradual increase during the forecast period.

Request Free Sample

Regional Analysis

North America is estimated to contribute 40.6% to the growth of the global market during the forecast period.Technavio’s analysts have elaborately explained the regional trends and drivers that shape the market during the forecast period.

See How Data Center IT Infrastructure Market Demand is Rising in North America Request Free Sample

The geographic landscape of the data center IT infrastructure market is defined by regional concentrations of investment and specific regulatory pressures.

North America, contributing over 40% of the market's incremental growth, remains dominant due to its dense concentration of hyperscale data center operators and aggressive enterprise IT modernization programs.

This region sees high demand for high-performance servers to support advanced AI workloads. In Europe, the market is heavily influenced by stringent data sovereignty compliance rules, driving demand for localized infrastructure and boosting the colocation data center segment.

This focus on regulatory compliance can lead to a 15% increase in infrastructure costs but is essential for operating within the region.

APAC is the fastest-growing region, fueled by rapid digitalization and government-led initiatives that spur investment in both enterprise data center and network infrastructure, creating diverse opportunities for vendors specializing in scalable solutions.

Market Dynamics

Our researchers analyzed the data with 2025 as the base year, along with the key drivers, trends, and challenges. A holistic analysis of drivers will help companies refine their marketing strategies to gain a competitive advantage.

  • The strategic direction of the global data center IT infrastructure market is increasingly shaped by complex, intersecting challenges and opportunities. Navigating the impact of data localization regulations has become a primary boardroom concern, forcing a re-evaluation of global data strategies and sometimes leading to a 15% increase in compliance-related capital expenditure for data center buildouts.
  • Simultaneously, the industry is grappling with how to best implement sustainable and green data center design, with a focus on optimizing power usage effectiveness (PUE). This includes exploring innovations like direct-to-chip liquid cooling solutions, which are critical for managing the heat from high-density server racks.
  • Organizations are actively developing AI-optimized server procurement strategies to support next-generation applications while also working to mitigate data center power constraints. Addressing the specialized talent gap in IT remains a persistent challenge, impacting the ability to effectively manage hybrid and multi-cloud environments.
  • Furthermore, data center supply chain volatility, exacerbated by geopolitical factors, complicates the procurement of everything from standard components to advanced systems for high-performance computing, such as those based on non-x86 server architecture for AI.
  • Effectively deploying infrastructure for edge computing adds another layer of complexity, demanding a holistic approach that balances performance, cost, and security while securing infrastructure from cyber threats.

What are the key market drivers leading to the rise in the adoption of Data Center IT Infrastructure Industry?

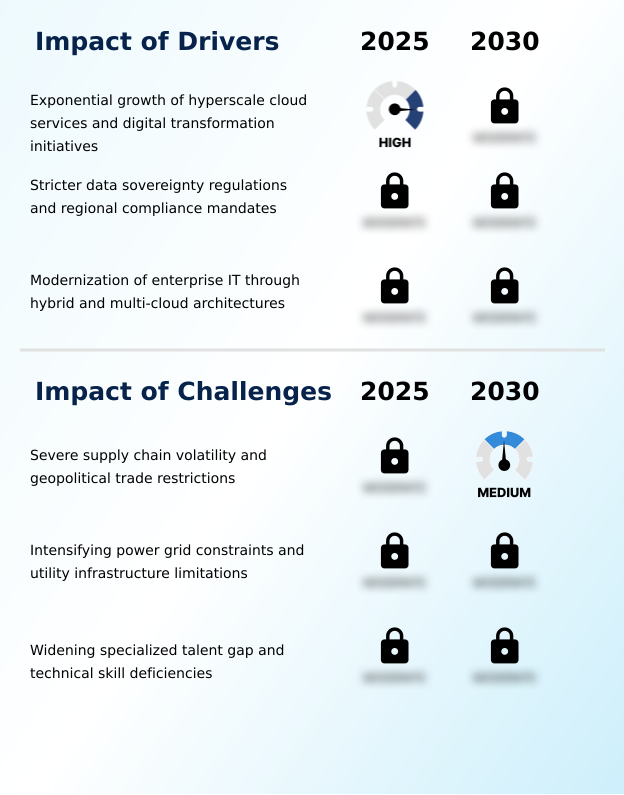
  • The exponential growth of hyperscale cloud services, coupled with widespread digital transformation initiatives, serves as a key driver for market expansion.

  • The market's expansion is propelled by several key drivers, foremost among them being the widespread adoption of hybrid cloud architecture.
  • Enterprises are modernizing their on-premises infrastructure to seamlessly integrate with public clouds, improving operational resilience and enabling a more agile multi-cloud strategy. This modernization, often involving hyper-converged infrastructure, can automate up to 80% of routine provisioning tasks.
  • A second major driver is the enforcement of strict data sovereignty and data localization regulations. These rules mandate in-country data storage, compelling organizations to invest in regional colocation or private enterprise data center facilities to ensure regulatory compliance.
  • Finally, the relentless pace of digital transformation initiatives across industries continues to fuel demand for scalable storage systems and high-performance computing capabilities to support ever-growing data-intensive workloads.

What are the market trends shaping the Data Center IT Infrastructure Industry?

  • The proliferation of artificial intelligence is driving a fundamental shift toward accelerated computing infrastructure. This transition has become a primary catalyst for investment and architectural change in the market.

  • Key trends are reshaping the data center IT infrastructure market, led by the integration of artificial intelligence, which necessitates a move to accelerated computing infrastructure. This requires specialized hardware like graphics processing units and advanced thermal solutions such as liquid-to-chip cooling, with some facilities seeing rack power densities increase tenfold.
  • Another critical trend is the expansion of edge computing infrastructure, which moves processing closer to data sources to support mission-critical applications. This shift can reduce latency by over 50% for real-time data processing. Finally, the drive for sustainability is mandating the adoption of green data center technologies and circular economy principles.
  • This focus on operational efficiency is pushing operators to improve power usage effectiveness, with advanced energy management systems delivering efficiency gains of up to 15%.

What challenges does the Data Center IT Infrastructure Industry face during its growth?

  • Severe supply chain volatility and geopolitical trade restrictions present a key challenge affecting the industry's growth trajectory.

  • The data center IT infrastructure market faces significant headwinds, primarily from severe supply chain volatility and geopolitical trade restrictions. These issues create unpredictability in the procurement strategy for critical hardware, with lead times for specialized high-performance servers and networking components extending beyond 12 months in some cases.
  • Another pressing issue is intensifying energy grid constraints, which can increase the total cost of ownership by over 25% in power-constrained regions and halt new hyperscale data center projects. Finally, a widening gap in technical skill deficiencies poses a direct threat to operational stability.
  • The lack of experts in areas like advanced cooling and cybersecurity risks can slow deployment and increase operational risk, undermining an organization's digital transformation initiatives and overall operational efficiency.

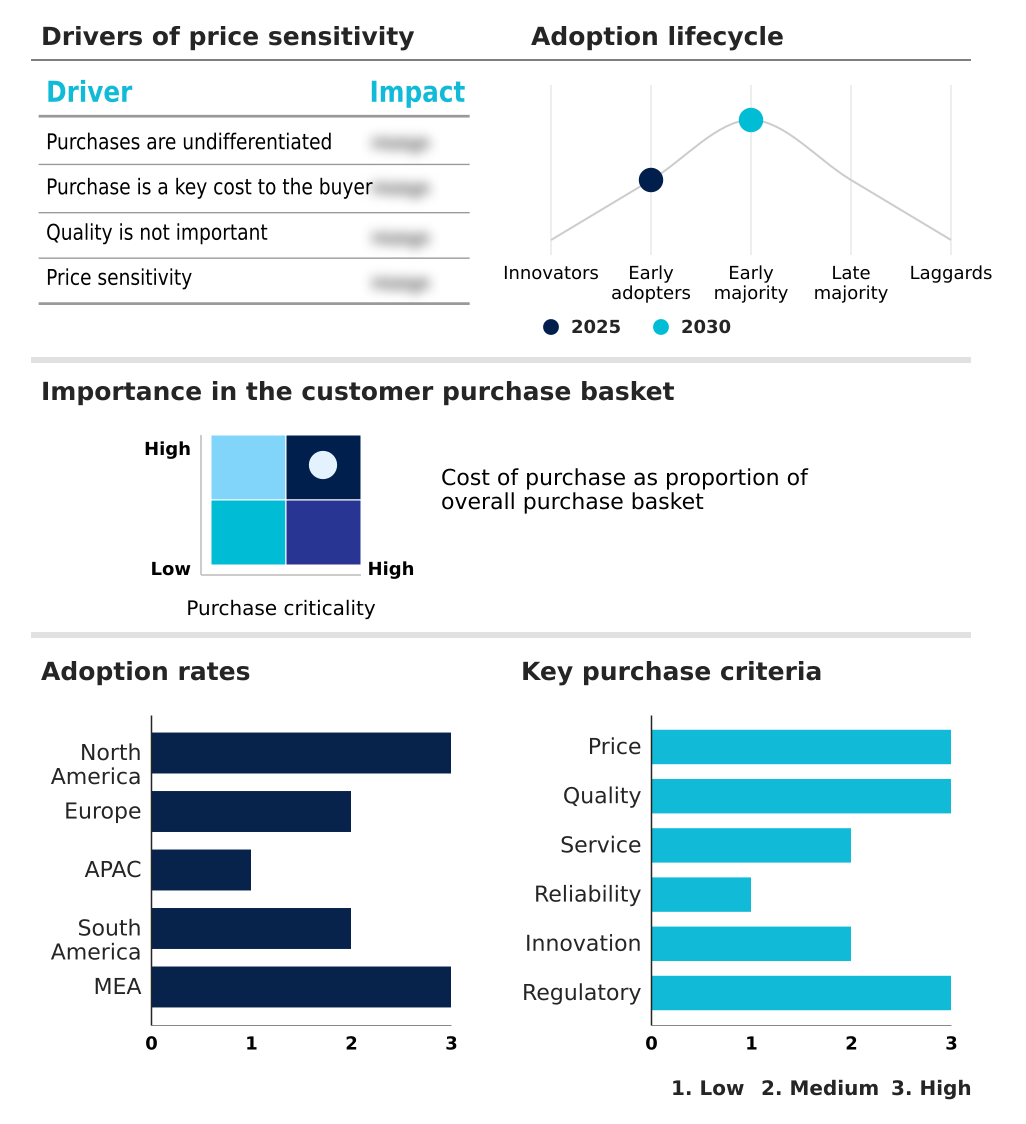
Exclusive Technavio Analysis on Customer Landscape

The data center it infrastructure market forecasting report includes the adoption lifecycle of the market, covering from the innovator’s stage to the laggard’s stage. It focuses on adoption rates in different regions based on penetration. Furthermore, the data center it infrastructure market report also includes key purchase criteria and drivers of price sensitivity to help companies evaluate and develop their market growth analysis strategies.

Customer Landscape of Data Center IT Infrastructure Industry

Competitive Landscape

Companies are implementing various strategies, such as strategic alliances, data center it infrastructure market forecast, partnerships, mergers and acquisitions, geographical expansion, and product/service launches, to enhance their presence in the industry.

Arista Networks Inc. - Analyzes cloud networking solutions and ethernet switch innovations designed for high-performance data center and hyperscale computing environments, emphasizing scalable and efficient data transit.

The industry research and growth report includes detailed analyses of the competitive landscape of the market and information about key companies, including:

  • Arista Networks Inc.
  • Broadcom Inc.
  • Cisco Systems Inc.
  • Dell Technologies Inc.
  • Extreme Networks Inc.
  • Fujitsu Ltd.
  • Gigabyte Technology Co. Ltd.
  • Hewlett Packard Enterprise Co.
  • Hitachi Vantara LLC
  • Huawei Technologies Co. Ltd.
  • IBM Corp.
  • Lenovo Group Ltd.
  • NetApp Inc.
  • New H3C Technologies
  • NVIDIA Corp.
  • Oracle Corp.
  • Pure Storage Inc.
  • Seagate Technology LLC
  • Super Micro Computer Inc.
  • Western Digital Corp.

Qualitative and quantitative analysis of companies has been conducted to help clients understand the wider business environment as well as the strengths and weaknesses of key industry players. Data is qualitatively analyzed to categorize companies as pure play, category-focused, industry-focused, and diversified; it is quantitatively analyzed to categorize companies as dominant, leading, strong, tentative, and weak.

Recent Development and News in Data center it infrastructure market

  • In August 2024, a consortium including BMW Group and Mercedes-Benz Group established the Automotive Data Trust Initiative, a project to create a sovereign data-sharing platform for autonomous driving development, mandating that all underlying IT infrastructure be housed within EU borders.
  • In February 2025, the sovereign wealth fund of Saudi Arabia and Google Cloud announced Project SAHARA, a joint venture to construct three AI-optimized hyperscale data center regions in the Kingdom, focusing on developing sovereign large language models.
  • In March 2025, the Indian Ministry of Electronics and Information Technology launched a Production Linked Incentive scheme for data center IT infrastructure, partnering with Reliance Industries to build a domestic server manufacturing facility to boost self-reliance.
  • In April 2025, Microsoft unveiled its Project Isotope initiative, a multi-year plan to re-architect its global Azure data center fleet for generative AI, involving a strategic procurement of next-generation, liquid-cooled servers from partners including Super Micro Computer and NVIDIA.

Dive into Technavio’s robust research methodology, blending expert interviews, extensive data synthesis, and validated models for unparalleled Data Center IT Infrastructure Market insights. See full methodology.

Market Scope
Page number 324
Base year 2025
Historic period 2020-2024
Forecast period 2026-2030
Growth momentum & CAGR Accelerate at a CAGR of 7.2%
Market growth 2026-2030 USD 112380.2 million
Market structure Fragmented
YoY growth 2025-2026(%) 6.7%
Key countries US, Canada, Mexico, Germany, UK, France, Italy, Spain, The Netherlands, China, Japan, India, Australia, South Korea, Indonesia, Brazil, Argentina, Chile, Saudi Arabia, UAE, South Africa, Turkey and Israel
Competitive landscape Leading Companies, Market Positioning of Companies, Competitive Strategies, and Industry Risks

Request Free Sample

Research Analyst Overview

  • The data center IT infrastructure market is in a state of architectural transformation, driven primarily by the demands of artificial intelligence and the consequent shift to accelerated computing infrastructure. This evolution necessitates a strategic overhaul of capital expenditure priorities at the boardroom level, moving beyond traditional refresh cycles.
  • The focus is now on workload-optimized systems, including high-performance servers equipped with graphics processing units and tensor processing units. This shift is critical for enterprises aiming to leverage AI for a competitive advantage.
  • The adoption of technologies like direct liquid cooling and liquid-to-chip cooling is becoming mainstream to manage the thermal output of high-density server racks, with some operators reporting a 40% improvement in cooling efficiency. This transition impacts the entire ecosystem, from server infrastructure and storage infrastructure to the underlying network infrastructure.
  • Decisions are no longer just about capacity but about specialized performance, driving investment in hyper-converged infrastructure, all-flash storage arrays, and advanced, low-latency networking to build resilient and scalable platforms for the future.

What are the Key Data Covered in this Data Center IT Infrastructure Market Research and Growth Report?

  • What is the expected growth of the Data Center IT Infrastructure Market between 2026 and 2030?

    • USD 112.38 billion, at a CAGR of 7.2%

  • What segmentation does the market report cover?

    • The report is segmented by Component (Server infrastructure, Storage infrastructure, Software-defined data center, Network infrastructure, and Others), End-user (BFSI, Energy, Information system, and Others), Type (Hyperscale data center, Colocation data center, Enterprise data center, and Edge data center) and Geography (North America, Europe, APAC, South America, Middle East and Africa)

  • Which regions are analyzed in the report?

    • North America, Europe, APAC, South America and Middle East and Africa

  • What are the key growth drivers and market challenges?

    • Exponential growth of hyperscale cloud services and digital transformation initiatives, Severe supply chain volatility and geopolitical trade restrictions

  • Who are the major players in the Data Center IT Infrastructure Market?

    • Arista Networks Inc., Broadcom Inc., Cisco Systems Inc., Dell Technologies Inc., Extreme Networks Inc., Fujitsu Ltd., Gigabyte Technology Co. Ltd., Hewlett Packard Enterprise Co., Hitachi Vantara LLC, Huawei Technologies Co. Ltd., IBM Corp., Lenovo Group Ltd., NetApp Inc., New H3C Technologies, NVIDIA Corp., Oracle Corp., Pure Storage Inc., Seagate Technology LLC, Super Micro Computer Inc. and Western Digital Corp.

Market Research Insights

  • The data center IT infrastructure market is shaped by a push for greater agility and efficiency. Hybrid cloud management is a core strategy, with enterprises reporting a 35% improvement in deployment flexibility by blending on-premises and cloud resources. This approach facilitates better workload optimization and supports digital transformation initiatives.
  • Concurrently, data sovereignty compliance is a non-negotiable driver, compelling organizations to adopt solutions that guarantee data residency. Automated provisioning tools are critical, enabling IT teams to reduce manual configuration errors by up to 60%. These dynamics pressure businesses to refine their procurement strategy, balancing capital expenditure against the long-term benefits of operational resilience and scalable performance for mission-critical applications.

We can help! Our analysts can customize this data center it infrastructure market research report to meet your requirements.

Get in touch

1. Executive Summary

1.1 Market overview

Executive Summary - Chart on Market Overview
Executive Summary - Data Table on Market Overview
Executive Summary - Chart on Global Market Characteristics
Executive Summary - Chart on Market by Geography
Executive Summary - Chart on Market Segmentation by Component
Executive Summary - Chart on Market Segmentation by End-user
Executive Summary - Chart on Market Segmentation by Type
Executive Summary - Chart on Incremental Growth
Executive Summary - Data Table on Incremental Growth
Executive Summary - Chart on Company Market Positioning

2. Technavio Analysis

2.1 Analysis of price sensitivity, lifecycle, customer purchase basket, adoption rates, and purchase criteria

2.2 Criticality of inputs and Factors of differentiation

Chart on Overview on criticality of inputs and factors of differentiation

2.3 Factors of disruption

Chart on Overview on factors of disruption

2.4 Impact of drivers and challenges

Chart on Impact of drivers and challenges in 2025 and 2030

3. Market Landscape

3.1 Market ecosystem

Chart on Parent Market
Data Table on - Parent Market

3.2 Market characteristics

Chart on Market characteristics analysis

3.3 Value chain analysis

Chart on Value chain analysis

4. Market Sizing

4.1 Market definition

Data Table on Offerings of companies included in the market definition

4.2 Market segment analysis

Market segments

4.3 Market size 2025

4.4 Market outlook: Forecast for 2025-2030

Chart on Global - Market size and forecast 2025-2030 ($ million)
Data Table on Global - Market size and forecast 2025-2030 ($ million)
Chart on Global Market: Year-over-year growth 2025-2030 (%)
Data Table on Global Market: Year-over-year growth 2025-2030 (%)

5. Historic Market Size

5.1 Global Data Center IT Infrastructure Market 2020 - 2024

Historic Market Size - Data Table on Global Data Center IT Infrastructure Market 2020 - 2024 ($ million)

5.2 Component segment analysis 2020 - 2024

Historic Market Size - Component Segment 2020 - 2024 ($ million)

5.3 End-user segment analysis 2020 - 2024

Historic Market Size - End-user Segment 2020 - 2024 ($ million)

5.4 Type segment analysis 2020 - 2024

Historic Market Size - Type Segment 2020 - 2024 ($ million)

5.5 Geography segment analysis 2020 - 2024

Historic Market Size - Geography Segment 2020 - 2024 ($ million)

5.6 Country segment analysis 2020 - 2024

Historic Market Size - Country Segment 2020 - 2024 ($ million)

6. Qualitative Analysis

6.1 Impact of AI on global data center IT infrastructure market

6.2 Impact of geopolitical conflicts on global data center IT infrastructure market

7. Five Forces Analysis

7.1 Five forces summary

Five forces analysis - Comparison between 2025 and 2030

7.2 Bargaining power of buyers

Bargaining power of buyers - Impact of key factors 2025 and 2030

7.3 Bargaining power of suppliers

Bargaining power of suppliers - Impact of key factors in 2025 and 2030

7.4 Threat of new entrants

Threat of new entrants - Impact of key factors in 2025 and 2030

7.5 Threat of substitutes

Threat of substitutes - Impact of key factors in 2025 and 2030

7.6 Threat of rivalry

Threat of rivalry - Impact of key factors in 2025 and 2030

7.7 Market condition

Chart on Market condition - Five forces 2025 and 2030

8. Market Segmentation by Component

8.1 Market segments

Chart on Component - Market share 2025-2030 (%)
Data Table on Component - Market share 2025-2030 (%)

8.2 Comparison by Component

Chart on Comparison by Component
Data Table on Comparison by Component

8.3 Server infrastructure - Market size and forecast 2025-2030

Chart on Server infrastructure - Market size and forecast 2025-2030 ($ million)
Data Table on Server infrastructure - Market size and forecast 2025-2030 ($ million)
Chart on Server infrastructure - Year-over-year growth 2025-2030 (%)
Data Table on Server infrastructure - Year-over-year growth 2025-2030 (%)

8.4 Storage infrastructure - Market size and forecast 2025-2030

Chart on Storage infrastructure - Market size and forecast 2025-2030 ($ million)
Data Table on Storage infrastructure - Market size and forecast 2025-2030 ($ million)
Chart on Storage infrastructure - Year-over-year growth 2025-2030 (%)
Data Table on Storage infrastructure - Year-over-year growth 2025-2030 (%)

8.5 Software-defined data center - Market size and forecast 2025-2030

Chart on Software-defined data center - Market size and forecast 2025-2030 ($ million)
Data Table on Software-defined data center - Market size and forecast 2025-2030 ($ million)
Chart on Software-defined data center - Year-over-year growth 2025-2030 (%)
Data Table on Software-defined data center - Year-over-year growth 2025-2030 (%)

8.6 Network infrastructure - Market size and forecast 2025-2030

Chart on Network infrastructure - Market size and forecast 2025-2030 ($ million)
Data Table on Network infrastructure - Market size and forecast 2025-2030 ($ million)
Chart on Network infrastructure - Year-over-year growth 2025-2030 (%)
Data Table on Network infrastructure - Year-over-year growth 2025-2030 (%)

8.7 Others - Market size and forecast 2025-2030

Chart on Others - Market size and forecast 2025-2030 ($ million)
Data Table on Others - Market size and forecast 2025-2030 ($ million)
Chart on Others - Year-over-year growth 2025-2030 (%)
Data Table on Others - Year-over-year growth 2025-2030 (%)

8.8 Market opportunity by Component

Market opportunity by Component ($ million)
Data Table on Market opportunity by Component ($ million)

9. Market Segmentation by End-user

9.1 Market segments

Chart on End-user - Market share 2025-2030 (%)
Data Table on End-user - Market share 2025-2030 (%)

9.2 Comparison by End-user

Chart on Comparison by End-user
Data Table on Comparison by End-user

9.3 BFSI - Market size and forecast 2025-2030

Chart on BFSI - Market size and forecast 2025-2030 ($ million)
Data Table on BFSI - Market size and forecast 2025-2030 ($ million)
Chart on BFSI - Year-over-year growth 2025-2030 (%)
Data Table on BFSI - Year-over-year growth 2025-2030 (%)

9.4 Energy - Market size and forecast 2025-2030

Chart on Energy - Market size and forecast 2025-2030 ($ million)
Data Table on Energy - Market size and forecast 2025-2030 ($ million)
Chart on Energy - Year-over-year growth 2025-2030 (%)
Data Table on Energy - Year-over-year growth 2025-2030 (%)

9.5 Information system - Market size and forecast 2025-2030

Chart on Information system - Market size and forecast 2025-2030 ($ million)
Data Table on Information system - Market size and forecast 2025-2030 ($ million)
Chart on Information system - Year-over-year growth 2025-2030 (%)
Data Table on Information system - Year-over-year growth 2025-2030 (%)

9.6 Others - Market size and forecast 2025-2030

Chart on Others - Market size and forecast 2025-2030 ($ million)
Data Table on Others - Market size and forecast 2025-2030 ($ million)
Chart on Others - Year-over-year growth 2025-2030 (%)
Data Table on Others - Year-over-year growth 2025-2030 (%)

9.7 Market opportunity by End-user

Market opportunity by End-user ($ million)
Data Table on Market opportunity by End-user ($ million)

10. Market Segmentation by Type

10.1 Market segments

Chart on Type - Market share 2025-2030 (%)
Data Table on Type - Market share 2025-2030 (%)

10.2 Comparison by Type

Chart on Comparison by Type
Data Table on Comparison by Type

10.3 Hyperscale data center - Market size and forecast 2025-2030

Chart on Hyperscale data center - Market size and forecast 2025-2030 ($ million)
Data Table on Hyperscale data center - Market size and forecast 2025-2030 ($ million)
Chart on Hyperscale data center - Year-over-year growth 2025-2030 (%)
Data Table on Hyperscale data center - Year-over-year growth 2025-2030 (%)

10.4 Colocation data center - Market size and forecast 2025-2030

Chart on Colocation data center - Market size and forecast 2025-2030 ($ million)
Data Table on Colocation data center - Market size and forecast 2025-2030 ($ million)
Chart on Colocation data center - Year-over-year growth 2025-2030 (%)
Data Table on Colocation data center - Year-over-year growth 2025-2030 (%)

10.5 Enterprise data center - Market size and forecast 2025-2030

Chart on Enterprise data center - Market size and forecast 2025-2030 ($ million)
Data Table on Enterprise data center - Market size and forecast 2025-2030 ($ million)
Chart on Enterprise data center - Year-over-year growth 2025-2030 (%)
Data Table on Enterprise data center - Year-over-year growth 2025-2030 (%)

10.6 Edge data center - Market size and forecast 2025-2030

Chart on Edge data center - Market size and forecast 2025-2030 ($ million)
Data Table on Edge data center - Market size and forecast 2025-2030 ($ million)
Chart on Edge data center - Year-over-year growth 2025-2030 (%)
Data Table on Edge data center - Year-over-year growth 2025-2030 (%)

10.7 Market opportunity by Type

Market opportunity by Type ($ million)
Data Table on Market opportunity by Type ($ million)

11. Customer Landscape

11.1 Customer landscape overview

Analysis of price sensitivity, lifecycle, customer purchase basket, adoption rates, and purchase criteria

12. Geographic Landscape

12.1 Geographic segmentation

Chart on Market share by geography 2025-2030 (%)
Data Table on Market share by geography 2025-2030 (%)

12.2 Geographic comparison

Chart on Geographic comparison
Data Table on Geographic comparison

12.3 North America - Market size and forecast 2025-2030

Chart on North America - Market size and forecast 2025-2030 ($ million)
Data Table on North America - Market size and forecast 2025-2030 ($ million)
Chart on North America - Year-over-year growth 2025-2030 (%)
Data Table on North America - Year-over-year growth 2025-2030 (%)
Chart on Regional Comparison - North America
Data Table on Regional Comparison - North America

12.3.1 US - Market size and forecast 2025-2030

Chart on US - Market size and forecast 2025-2030 ($ million)
Data Table on US - Market size and forecast 2025-2030 ($ million)
Chart on US - Year-over-year growth 2025-2030 (%)
Data Table on US - Year-over-year growth 2025-2030 (%)

12.3.2 Canada - Market size and forecast 2025-2030

Chart on Canada - Market size and forecast 2025-2030 ($ million)
Data Table on Canada - Market size and forecast 2025-2030 ($ million)
Chart on Canada - Year-over-year growth 2025-2030 (%)
Data Table on Canada - Year-over-year growth 2025-2030 (%)

12.3.3 Mexico - Market size and forecast 2025-2030

Chart on Mexico - Market size and forecast 2025-2030 ($ million)
Data Table on Mexico - Market size and forecast 2025-2030 ($ million)
Chart on Mexico - Year-over-year growth 2025-2030 (%)
Data Table on Mexico - Year-over-year growth 2025-2030 (%)

12.4 Europe - Market size and forecast 2025-2030

Chart on Europe - Market size and forecast 2025-2030 ($ million)
Data Table on Europe - Market size and forecast 2025-2030 ($ million)
Chart on Europe - Year-over-year growth 2025-2030 (%)
Data Table on Europe - Year-over-year growth 2025-2030 (%)
Chart on Regional Comparison - Europe
Data Table on Regional Comparison - Europe

12.4.1 Germany - Market size and forecast 2025-2030

Chart on Germany - Market size and forecast 2025-2030 ($ million)
Data Table on Germany - Market size and forecast 2025-2030 ($ million)
Chart on Germany - Year-over-year growth 2025-2030 (%)
Data Table on Germany - Year-over-year growth 2025-2030 (%)

12.4.2 UK - Market size and forecast 2025-2030

Chart on UK - Market size and forecast 2025-2030 ($ million)
Data Table on UK - Market size and forecast 2025-2030 ($ million)
Chart on UK - Year-over-year growth 2025-2030 (%)
Data Table on UK - Year-over-year growth 2025-2030 (%)

12.4.3 France - Market size and forecast 2025-2030

Chart on France - Market size and forecast 2025-2030 ($ million)
Data Table on France - Market size and forecast 2025-2030 ($ million)
Chart on France - Year-over-year growth 2025-2030 (%)
Data Table on France - Year-over-year growth 2025-2030 (%)

12.4.4 Italy - Market size and forecast 2025-2030

Chart on Italy - Market size and forecast 2025-2030 ($ million)
Data Table on Italy - Market size and forecast 2025-2030 ($ million)
Chart on Italy - Year-over-year growth 2025-2030 (%)
Data Table on Italy - Year-over-year growth 2025-2030 (%)

12.4.5 Spain - Market size and forecast 2025-2030

Chart on Spain - Market size and forecast 2025-2030 ($ million)
Data Table on Spain - Market size and forecast 2025-2030 ($ million)
Chart on Spain - Year-over-year growth 2025-2030 (%)
Data Table on Spain - Year-over-year growth 2025-2030 (%)

12.4.6 The Netherlands - Market size and forecast 2025-2030

Chart on The Netherlands - Market size and forecast 2025-2030 ($ million)
Data Table on The Netherlands - Market size and forecast 2025-2030 ($ million)
Chart on The Netherlands - Year-over-year growth 2025-2030 (%)
Data Table on The Netherlands - Year-over-year growth 2025-2030 (%)

12.5 APAC - Market size and forecast 2025-2030

Chart on APAC - Market size and forecast 2025-2030 ($ million)
Data Table on APAC - Market size and forecast 2025-2030 ($ million)
Chart on APAC - Year-over-year growth 2025-2030 (%)
Data Table on APAC - Year-over-year growth 2025-2030 (%)
Chart on Regional Comparison - APAC
Data Table on Regional Comparison - APAC

12.5.1 China - Market size and forecast 2025-2030

Chart on China - Market size and forecast 2025-2030 ($ million)
Data Table on China - Market size and forecast 2025-2030 ($ million)
Chart on China - Year-over-year growth 2025-2030 (%)
Data Table on China - Year-over-year growth 2025-2030 (%)

12.5.2 Japan - Market size and forecast 2025-2030

Chart on Japan - Market size and forecast 2025-2030 ($ million)
Data Table on Japan - Market size and forecast 2025-2030 ($ million)
Chart on Japan - Year-over-year growth 2025-2030 (%)
Data Table on Japan - Year-over-year growth 2025-2030 (%)

12.5.3 India - Market size and forecast 2025-2030

Chart on India - Market size and forecast 2025-2030 ($ million)
Data Table on India - Market size and forecast 2025-2030 ($ million)
Chart on India - Year-over-year growth 2025-2030 (%)
Data Table on India - Year-over-year growth 2025-2030 (%)

12.5.4 Australia - Market size and forecast 2025-2030

Chart on Australia - Market size and forecast 2025-2030 ($ million)
Data Table on Australia - Market size and forecast 2025-2030 ($ million)
Chart on Australia - Year-over-year growth 2025-2030 (%)
Data Table on Australia - Year-over-year growth 2025-2030 (%)

12.5.5 South Korea - Market size and forecast 2025-2030

Chart on South Korea - Market size and forecast 2025-2030 ($ million)
Data Table on South Korea - Market size and forecast 2025-2030 ($ million)
Chart on South Korea - Year-over-year growth 2025-2030 (%)
Data Table on South Korea - Year-over-year growth 2025-2030 (%)

12.5.6 Indonesia - Market size and forecast 2025-2030

Chart on Indonesia - Market size and forecast 2025-2030 ($ million)
Data Table on Indonesia - Market size and forecast 2025-2030 ($ million)
Chart on Indonesia - Year-over-year growth 2025-2030 (%)
Data Table on Indonesia - Year-over-year growth 2025-2030 (%)

12.6 South America - Market size and forecast 2025-2030

Chart on South America - Market size and forecast 2025-2030 ($ million)
Data Table on South America - Market size and forecast 2025-2030 ($ million)
Chart on South America - Year-over-year growth 2025-2030 (%)
Data Table on South America - Year-over-year growth 2025-2030 (%)
Chart on Regional Comparison - South America
Data Table on Regional Comparison - South America

12.6.1 Brazil - Market size and forecast 2025-2030

Chart on Brazil - Market size and forecast 2025-2030 ($ million)
Data Table on Brazil - Market size and forecast 2025-2030 ($ million)
Chart on Brazil - Year-over-year growth 2025-2030 (%)
Data Table on Brazil - Year-over-year growth 2025-2030 (%)

12.6.2 Argentina - Market size and forecast 2025-2030

Chart on Argentina - Market size and forecast 2025-2030 ($ million)
Data Table on Argentina - Market size and forecast 2025-2030 ($ million)
Chart on Argentina - Year-over-year growth 2025-2030 (%)
Data Table on Argentina - Year-over-year growth 2025-2030 (%)

12.6.3 Chile - Market size and forecast 2025-2030

Chart on Chile - Market size and forecast 2025-2030 ($ million)
Data Table on Chile - Market size and forecast 2025-2030 ($ million)
Chart on Chile - Year-over-year growth 2025-2030 (%)
Data Table on Chile - Year-over-year growth 2025-2030 (%)

12.7 Middle East and Africa - Market size and forecast 2025-2030

Chart on Middle East and Africa - Market size and forecast 2025-2030 ($ million)
Data Table on Middle East and Africa - Market size and forecast 2025-2030 ($ million)
Chart on Middle East and Africa - Year-over-year growth 2025-2030 (%)
Data Table on Middle East and Africa - Year-over-year growth 2025-2030 (%)
Chart on Regional Comparison - Middle East and Africa
Data Table on Regional Comparison - Middle East and Africa

12.7.1 Saudi Arabia - Market size and forecast 2025-2030

Chart on Saudi Arabia - Market size and forecast 2025-2030 ($ million)
Data Table on Saudi Arabia - Market size and forecast 2025-2030 ($ million)
Chart on Saudi Arabia - Year-over-year growth 2025-2030 (%)
Data Table on Saudi Arabia - Year-over-year growth 2025-2030 (%)

12.7.2 UAE - Market size and forecast 2025-2030

Chart on UAE - Market size and forecast 2025-2030 ($ million)
Data Table on UAE - Market size and forecast 2025-2030 ($ million)
Chart on UAE - Year-over-year growth 2025-2030 (%)
Data Table on UAE - Year-over-year growth 2025-2030 (%)

12.7.3 South Africa - Market size and forecast 2025-2030

Chart on South Africa - Market size and forecast 2025-2030 ($ million)
Data Table on South Africa - Market size and forecast 2025-2030 ($ million)
Chart on South Africa - Year-over-year growth 2025-2030 (%)
Data Table on South Africa - Year-over-year growth 2025-2030 (%)

12.7.4 Turkey - Market size and forecast 2025-2030

Chart on Turkey - Market size and forecast 2025-2030 ($ million)
Data Table on Turkey - Market size and forecast 2025-2030 ($ million)
Chart on Turkey - Year-over-year growth 2025-2030 (%)
Data Table on Turkey - Year-over-year growth 2025-2030 (%)

12.7.5 Israel - Market size and forecast 2025-2030

Chart on Israel - Market size and forecast 2025-2030 ($ million)
Data Table on Israel - Market size and forecast 2025-2030 ($ million)
Chart on Israel - Year-over-year growth 2025-2030 (%)
Data Table on Israel - Year-over-year growth 2025-2030 (%)

12.8 Market opportunity by geography

Market opportunity by geography ($ million)
Data Tables on Market opportunity by geography ($ million)

13. Drivers, Challenges, and Opportunity

13.1 Market drivers

Exponential growth of hyperscale cloud services and digital transformation initiatives
Stricter data sovereignty regulations and regional compliance mandates
Modernization of enterprise IT through hybrid and multi-cloud architectures

13.2 Market challenges

Severe supply chain volatility and geopolitical trade restrictions
Intensifying power grid constraints and utility infrastructure limitations
Widening specialized talent gap and technical skill deficiencies

13.3 Impact of drivers and challenges

Impact of drivers and challenges in 2025 and 2030

13.4 Market opportunities

Proliferation of artificial intelligence and accelerated computing infrastructure
Expansion of edge computing and distributed infrastructure architectures
Transition toward sustainable and green data center technologies

14. Competitive Landscape

14.1 Overview

14.2

Overview on criticality of inputs and factors of differentiation

14.3 Landscape disruption

Overview on factors of disruption

14.4 Industry risks

Impact of key risks on business

15. Competitive Analysis

15.1 Companies profiled

Companies covered

15.2 Company ranking index

15.3 Market positioning of companies

Matrix on companies position and classification

15.4 Broadcom Inc.

Broadcom Inc. - Overview
Broadcom Inc. - Business segments
Broadcom Inc. - Key offerings
Broadcom Inc. - Segment focus
SWOT

15.5 Cisco Systems Inc.

Cisco Systems Inc. - Overview
Cisco Systems Inc. - Business segments
Cisco Systems Inc. - Key news
Cisco Systems Inc. - Key offerings
Cisco Systems Inc. - Segment focus
SWOT

15.6 Dell Technologies Inc.

Dell Technologies Inc. - Overview
Dell Technologies Inc. - Business segments
Dell Technologies Inc. - Key news
Dell Technologies Inc. - Key offerings
Dell Technologies Inc. - Segment focus
SWOT

15.7 Fujitsu Ltd.

Fujitsu Ltd. - Overview
Fujitsu Ltd. - Business segments
Fujitsu Ltd. - Key offerings
Fujitsu Ltd. - Segment focus
SWOT

15.8 Hewlett Packard Enterprise Co.

Hewlett Packard Enterprise Co. - Overview
Hewlett Packard Enterprise Co. - Business segments
Hewlett Packard Enterprise Co. - Key news
Hewlett Packard Enterprise Co. - Key offerings
Hewlett Packard Enterprise Co. - Segment focus
SWOT

15.9 Hitachi Vantara LLC

Hitachi Vantara LLC - Overview
Hitachi Vantara LLC - Product / Service
Hitachi Vantara LLC - Key offerings
SWOT

15.10 Huawei Technologies Co. Ltd.

Huawei Technologies Co. Ltd. - Overview
Huawei Technologies Co. Ltd. - Product / Service
Huawei Technologies Co. Ltd. - Key offerings
SWOT

15.11 IBM Corp.

IBM Corp. - Overview
IBM Corp. - Business segments
IBM Corp. - Key news
IBM Corp. - Key offerings
IBM Corp. - Segment focus
SWOT

15.12 Lenovo Group Ltd.

Lenovo Group Ltd. - Overview
Lenovo Group Ltd. - Business segments
Lenovo Group Ltd. - Key offerings
Lenovo Group Ltd. - Segment focus
SWOT

15.13 NetApp Inc.

NetApp Inc. - Overview
NetApp Inc. - Business segments
NetApp Inc. - Key news
NetApp Inc. - Key offerings
NetApp Inc. - Segment focus
SWOT

15.14 New H3C Technologies

New H3C Technologies - Overview
New H3C Technologies - Product / Service
New H3C Technologies - Key offerings
SWOT

15.15 NVIDIA Corp.

NVIDIA Corp. - Overview
NVIDIA Corp. - Business segments
NVIDIA Corp. - Key news
NVIDIA Corp. - Key offerings
NVIDIA Corp. - Segment focus
SWOT

15.16 Oracle Corp.

Oracle Corp. - Overview
Oracle Corp. - Business segments
Oracle Corp. - Key news
Oracle Corp. - Key offerings
Oracle Corp. - Segment focus
SWOT

15.17 Pure Storage Inc.

Pure Storage Inc. - Overview
Pure Storage Inc. - Business segments
Pure Storage Inc. - Key offerings
Pure Storage Inc. - Segment focus
SWOT

15.18 Super Micro Computer Inc.

Super Micro Computer Inc. - Overview
Super Micro Computer Inc. - Business segments
Super Micro Computer Inc. - Key offerings
Super Micro Computer Inc. - Segment focus
SWOT

16. Appendix

16.1 Scope of the report

Market definition
Objectives
Notes and caveats

16.2 Inclusions and exclusions checklist

Inclusions checklist
Exclusions checklist

16.3 Currency conversion rates for US$

16.4 Research methodology

16.5 Data procurement

Information sources

16.6 Data validation

16.7 Validation techniques employed for market sizing

16.8 Data synthesis

16.9 360 degree market analysis

16.10 List of abbreviations

Research Methodology

Technavio presents a detailed picture of the market by way of study, synthesis, and summation of data from multiple sources. The analysts have presented the various facets of the market with a particular focus on identifying the key industry influencers. The data thus presented is comprehensive, reliable, and the result of extensive research, both primary and secondary.

INFORMATION SOURCES

Primary sources

  • Manufacturers and suppliers
  • Channel partners
  • Industry experts
  • Strategic decision makers

Secondary sources

  • Industry journals and periodicals
  • Government data
  • Financial reports of key industry players
  • Historical data
  • Press releases

DATA ANALYSIS

Data Synthesis

  • Collation of data
  • Estimation of key figures
  • Analysis of derived insights

Data Validation

  • Triangulation with data models
  • Reference against proprietary databases
  • Corroboration with industry experts

REPORT WRITING

Qualitative

  • Market drivers
  • Market challenges
  • Market trends
  • Five forces analysis

Quantitative

  • Market size and forecast
  • Market segmentation
  • Geographical insights
  • Competitive landscape

Interested in this report?

Get your sample now to see our research methodology and insights!

Download Now

Frequently Asked Questions

Data Center IT Infrastructure market growth will increase by USD 112380.2 million during 2026-2030.

The Data Center IT Infrastructure market is expected to grow at a CAGR of 7.2% during 2026-2030.

Data Center IT Infrastructure market is segmented by Component (Server infrastructure, Storage infrastructure, Software-defined data center, Network infrastructure, Others) End-user (BFSI, Energy, Information system, Others) Type (Hyperscale data center, Colocation data center, Enterprise data center, Edge data center)

Arista Networks Inc., Broadcom Inc., Cisco Systems Inc., Dell Technologies Inc., Extreme Networks Inc., Fujitsu Ltd., Gigabyte Technology Co. Ltd., Hewlett Packard Enterprise Co., Hitachi Vantara LLC, Huawei Technologies Co. Ltd., IBM Corp., Lenovo Group Ltd., NetApp Inc., New H3C Technologies, NVIDIA Corp., Oracle Corp., Pure Storage Inc., Seagate Technology LLC, Super Micro Computer Inc., Western Digital Corp. are a few of the key vendors in the Data Center IT Infrastructure market.

North America will register the highest growth rate of 40.6% among the other regions. Therefore, the Data Center IT Infrastructure market in North America is expected to garner significant business opportunities for the vendors during the forecast period.

US, Canada, Mexico, Germany, UK, France, Italy, Spain, The Netherlands, China, Japan, India, Australia, South Korea, Indonesia, Brazil, Argentina, Chile, Saudi Arabia, UAE, South Africa, Turkey, Israel

  • Exponential growth of hyperscale cloud services and digital transformation initiatives is the driving factor this market.

The Data Center IT Infrastructure market vendors should focus on grabbing business opportunities from the Component segment as it accounted for the largest market share in the base year.
RIA - Research AI Assistant
Ask RIA