Defense Aircraft Aviation Fuel Market Analysis, Size, and Forecast 2026-2030: North America (US, Canada, and Mexico), APAC (China, Japan, and India), Europe (Germany, UK, and France), South America (Brazil and Argentina), Middle East and Africa (Saudi Arabia, UAE, and South Africa), and Rest of World (ROW)

Defense Aircraft Aviation Fuel Market Analysis, Size, and Forecast 2026-2030:
North America (US, Canada, and Mexico), APAC (China, Japan, and India), Europe (Germany, UK, and France), South America (Brazil and Argentina), Middle East and Africa (Saudi Arabia, UAE, and South Africa), and Rest of World (ROW)

Published: Dec 2025 298 Pages SKU: IRTNTR75523

Market Overview at a Glance

$22.25 B
Market Opportunity
6.4%
CAGR 2025 - 2030
36.7%
APAC Growth
$32.08 B
Air turbine fuel segment 2024

Defense Aircraft Aviation Fuel Market Size 2026-2030

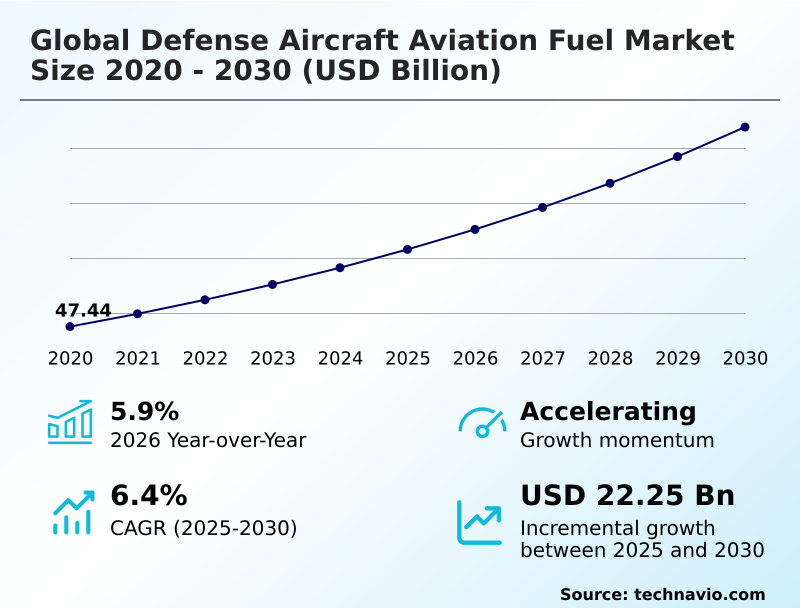
The defense aircraft aviation fuel market size is valued to increase by USD 22.25 billion, at a CAGR of 6.4% from 2025 to 2030. Increasing use of military UAVs will drive the defense aircraft aviation fuel market.

Major Market Trends & Insights

  • APAC dominated the market and accounted for a 36.7% growth during the forecast period.
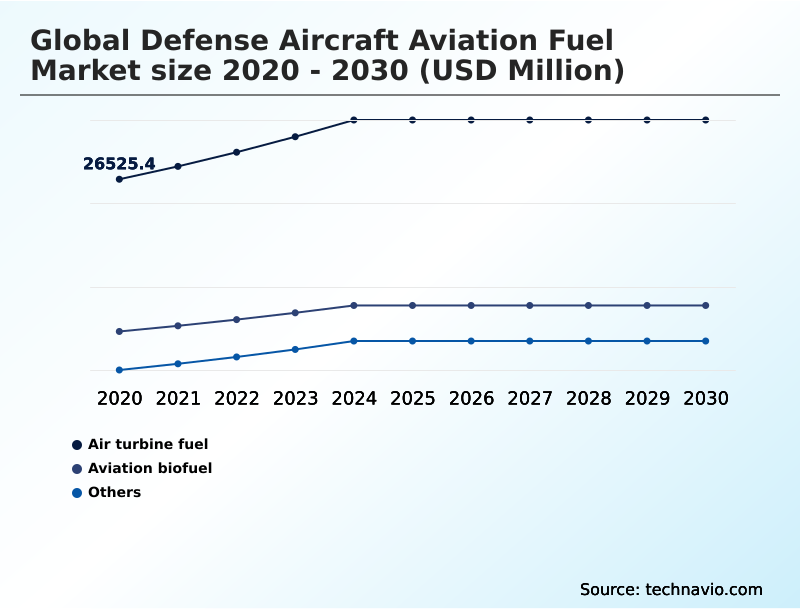
  • By Product - Air turbine fuel segment was valued at USD 32.08 billion in 2024
  • By Application - Military operations segment accounted for the largest market revenue share in 2024

Market Size & Forecast

  • Market Opportunities: USD 36.28 billion
  • Market Future Opportunities: USD 22.25 billion
  • CAGR from 2025 to 2030 : 6.4%

Market Summary

What will be the Size of the Defense Aircraft Aviation Fuel Market during the forecast period?

Get Key Insights on Market Forecast (PDF) Request Free Sample

How is the Defense Aircraft Aviation Fuel Market Segmented?

The defense aircraft aviation fuel industry research report provides comprehensive data (region-wise segment analysis), with forecasts and estimates in "USD million" for the period 2026-2030, as well as historical data from 2020-2024 for the following segments.

  • Product
    • Air turbine fuel
    • Aviation biofuel
    • Others
  • Application
    • Military operations
    • Training missions
    • Humanitarian aid
    • Research and development
  • Aircraft type
    • Fighter aircraft
    • Transport planes
    • Helicopters
    • Others
  • Geography
    • North America
      • US
      • Canada
      • Mexico
    • APAC
      • China
      • Japan
      • India
    • Europe
      • Germany
      • UK
      • France
    • South America
      • Brazil
      • Argentina
    • Middle East and Africa
      • Saudi Arabia
      • UAE
      • South Africa
    • Rest of World (ROW)

By Product Insights

The air turbine fuel segment is estimated to witness significant growth during the forecast period.

Request Free Sample

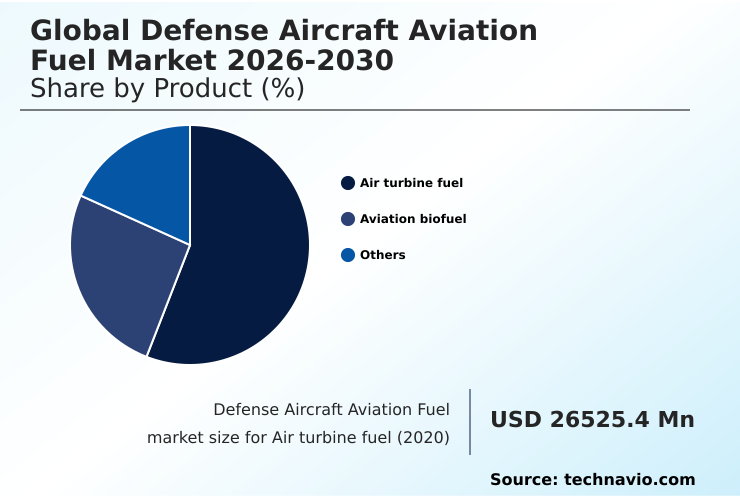
The Air turbine fuel segment was valued at USD 32.08 billion in 2024 and showed a gradual increase during the forecast period.

Request Free Sample

Regional Analysis

APAC is estimated to contribute 36.7% to the growth of the global market during the forecast period.Technavio’s analysts have elaborately explained the regional trends and drivers that shape the market during the forecast period.

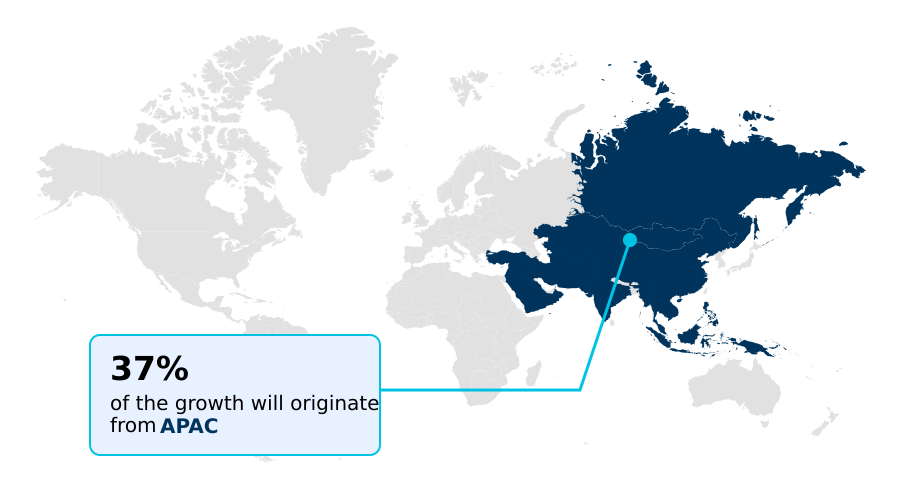
See How Defense Aircraft Aviation Fuel Market Demand is Rising in APAC Request Free Sample

Market Dynamics

Our researchers analyzed the data with 2025 as the base year, along with the key drivers, trends, and challenges. A holistic analysis of drivers will help companies refine their marketing strategies to gain a competitive advantage.

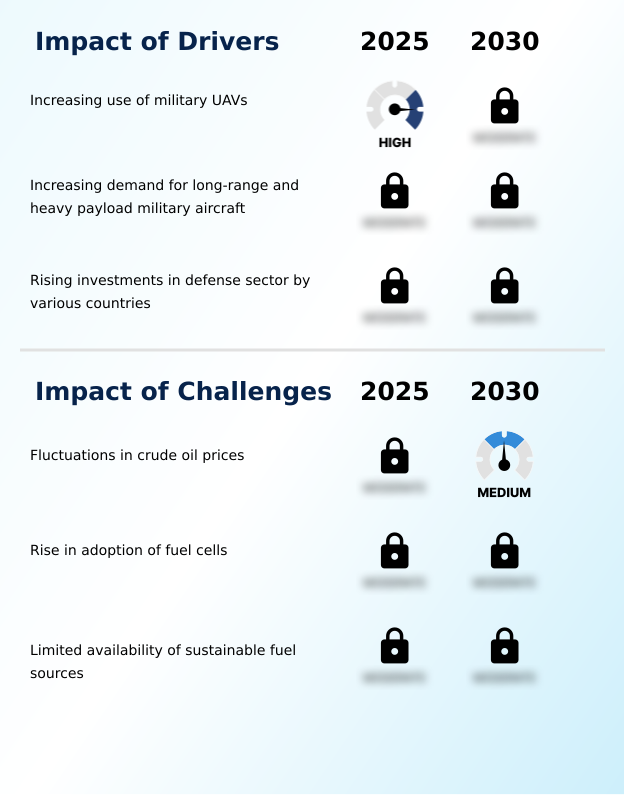
What are the key market drivers leading to the rise in the adoption of Defense Aircraft Aviation Fuel Industry?

What are the market trends shaping the Defense Aircraft Aviation Fuel Industry?

What challenges does the Defense Aircraft Aviation Fuel Industry face during its growth?

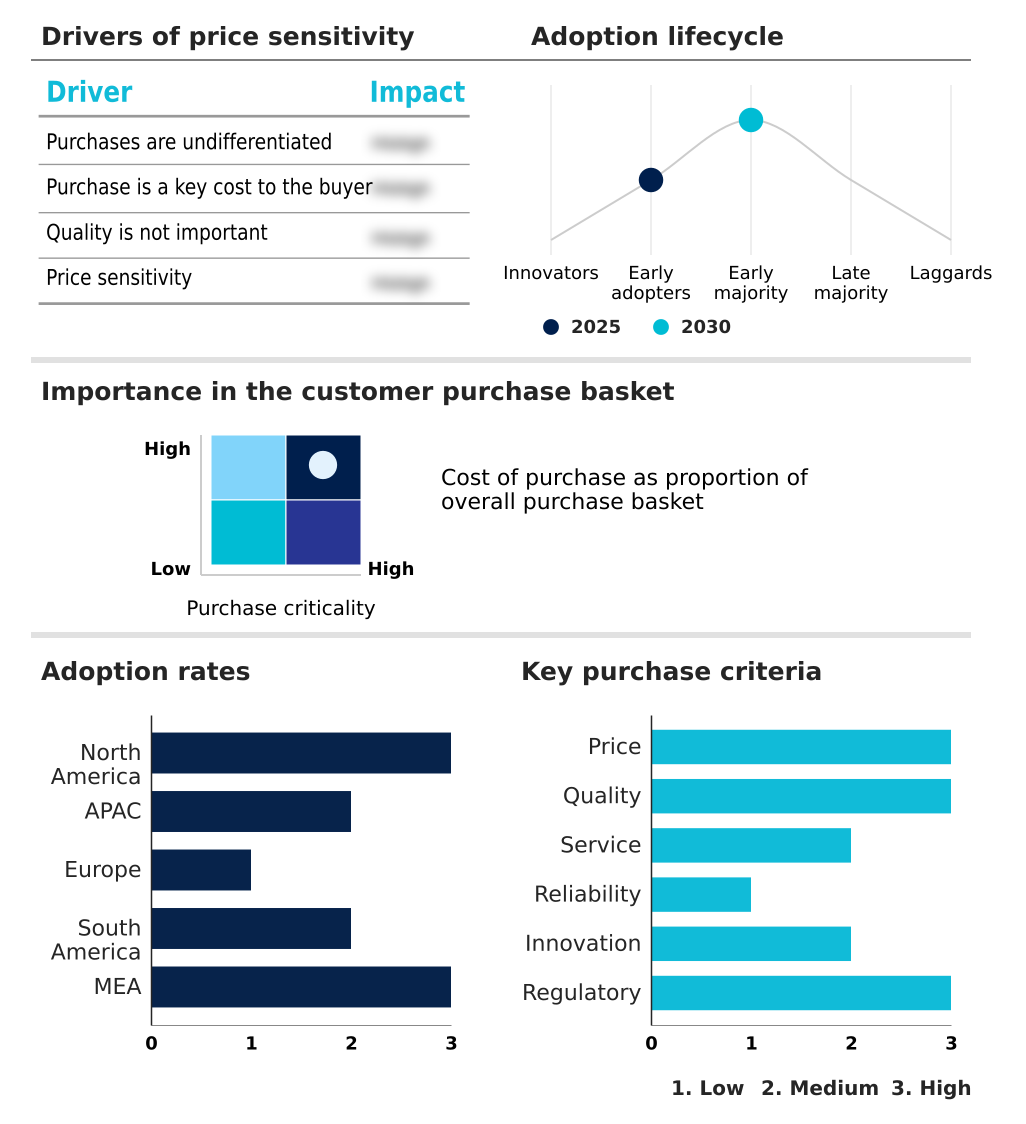
Exclusive Technavio Analysis on Customer Landscape

The defense aircraft aviation fuel market forecasting report includes the adoption lifecycle of the market, covering from the innovator’s stage to the laggard’s stage. It focuses on adoption rates in different regions based on penetration. Furthermore, the defense aircraft aviation fuel market report also includes key purchase criteria and drivers of price sensitivity to help companies evaluate and develop their market growth analysis strategies.

Customer Landscape of Defense Aircraft Aviation Fuel Industry

Competitive Landscape

Companies are implementing various strategies, such as strategic alliances, defense aircraft aviation fuel market forecast, partnerships, mergers and acquisitions, geographical expansion, and product/service launches, to enhance their presence in the industry.

BP Plc -

The industry research and growth report includes detailed analyses of the competitive landscape of the market and information about key companies, including:

  • BP Plc
  • Chevron Corp.
  • Emirates National Oil Co.
  • Exxon Mobil Corp.
  • Honeywell International Inc.
  • Indian Oil Corp. Ltd.
  • Marathon Petroleum Corp.
  • MOL Group
  • Neste Corp.
  • Petroleo Brasileiro SA
  • PJSC LUKOIL
  • Repsol SA
  • Shell plc
  • SkyNRG BV
  • Swedish Biofuels AB
  • TotalEnergies SE
  • Valero Energy Corp.
  • Vitol Netherlands Cooperatief UA
  • World Kinect Corp

Qualitative and quantitative analysis of companies has been conducted to help clients understand the wider business environment as well as the strengths and weaknesses of key industry players. Data is qualitatively analyzed to categorize companies as pure play, category-focused, industry-focused, and diversified; it is quantitatively analyzed to categorize companies as dominant, leading, strong, tentative, and weak.

Recent Development and News in Defense aircraft aviation fuel market

Dive into Technavio’s robust research methodology, blending expert interviews, extensive data synthesis, and validated models for unparalleled Defense Aircraft Aviation Fuel Market insights. See full methodology.

Market Scope
Page number 298
Base year 2025
Historic period 2020-2024
Forecast period 2026-2030
Growth momentum & CAGR Accelerate at a CAGR of 6.4%
Market growth 2026-2030 USD 22247.2 million
Market structure Fragmented
YoY growth 2025-2026(%) 5.9%
Key countries US, Canada, Mexico, China, Japan, India, South Korea, Australia, Indonesia, Germany, UK, France, Italy, Spain, The Netherlands, Brazil, Argentina, Chile, Saudi Arabia, UAE, South Africa, Israel and Turkey
Competitive landscape Leading Companies, Market Positioning of Companies, Competitive Strategies, and Industry Risks

Request Free Sample

Research Analyst Overview

What are the Key Data Covered in this Defense Aircraft Aviation Fuel Market Research and Growth Report?

  • What is the expected growth of the Defense Aircraft Aviation Fuel Market between 2026 and 2030?

    • USD 22.25 billion, at a CAGR of 6.4%

  • What segmentation does the market report cover?

    • The report is segmented by Product (Air turbine fuel, Aviation biofuel, and Others), Application (Military operations, Training missions, Humanitarian aid, and Research and development), Aircraft Type (Fighter aircraft, Transport planes, Helicopters, and Others) and Geography (North America, APAC, Europe, South America, Middle East and Africa)

  • Which regions are analyzed in the report?

    • North America, APAC, Europe, South America and Middle East and Africa

  • What are the key growth drivers and market challenges?

    • Increasing use of military UAVs, Fluctuations in crude oil prices

  • Who are the major players in the Defense Aircraft Aviation Fuel Market?

    • BP Plc, Chevron Corp., Emirates National Oil Co., Exxon Mobil Corp., Honeywell International Inc., Indian Oil Corp. Ltd., Marathon Petroleum Corp., MOL Group, Neste Corp., Petroleo Brasileiro SA, PJSC LUKOIL, Repsol SA, Shell plc, SkyNRG BV, Swedish Biofuels AB, TotalEnergies SE, Valero Energy Corp., Vitol Netherlands Cooperatief UA and World Kinect Corp

Market Research Insights

We can help! Our analysts can customize this defense aircraft aviation fuel market research report to meet your requirements.

Get in touch

1. Executive Summary

1.1 Market overview

Executive Summary - Chart on Market Overview
Executive Summary - Data Table on Market Overview
Executive Summary - Chart on Global Market Characteristics
Executive Summary - Chart on Market by Geography
Executive Summary - Chart on Market Segmentation by Product
Executive Summary - Chart on Market Segmentation by Application
Executive Summary - Chart on Market Segmentation by Aircraft Type
Executive Summary - Chart on Incremental Growth
Executive Summary - Data Table on Incremental Growth
Executive Summary - Chart on Company Market Positioning

2. Technavio Analysis

2.1 Analysis of price sensitivity, lifecycle, customer purchase basket, adoption rates, and purchase criteria

2.2 Criticality of inputs and Factors of differentiation

Chart on Overview on criticality of inputs and factors of differentiation

2.3 Factors of disruption

Chart on Overview on factors of disruption

2.4 Impact of drivers and challenges

Chart on Impact of drivers and challenges in 2025 and 2030

3. Market Landscape

3.1 Market ecosystem

Chart on Parent Market
Data Table on - Parent Market

3.2 Market characteristics

Chart on Market characteristics analysis

3.3 Value chain analysis

Chart on Value chain analysis

4. Market Sizing

4.1 Market definition

Data Table on Offerings of companies included in the market definition

4.2 Market segment analysis

Market segments

4.3 Market size 2025

4.4 Market outlook: Forecast for 2025-2030

Chart on Global - Market size and forecast 2025-2030 ($ million)
Data Table on Global - Market size and forecast 2025-2030 ($ million)
Chart on Global Market: Year-over-year growth 2025-2030 (%)
Data Table on Global Market: Year-over-year growth 2025-2030 (%)

5. Historic Market Size

5.1 Global Defense Aircraft Aviation Fuel Market 2020 - 2024

Historic Market Size - Data Table on Global Defense Aircraft Aviation Fuel Market 2020 - 2024 ($ million)

5.2 Product segment analysis 2020 - 2024

Historic Market Size - Product Segment 2020 - 2024 ($ million)

5.3 Application segment analysis 2020 - 2024

Historic Market Size - Application Segment 2020 - 2024 ($ million)

5.4 Aircraft Type segment analysis 2020 - 2024

Historic Market Size - Aircraft Type Segment 2020 - 2024 ($ million)

5.5 Geography segment analysis 2020 - 2024

Historic Market Size - Geography Segment 2020 - 2024 ($ million)

5.6 Country segment analysis 2020 - 2024

Historic Market Size - Country Segment 2020 - 2024 ($ million)

6. Qualitative Analysis

6.1 The AI impact on Global Defense Aircraft Aviation Fuel Market

7. Five Forces Analysis

7.1 Five forces summary

Five forces analysis - Comparison between 2025 and 2030

7.2 Bargaining power of buyers

Bargaining power of buyers - Impact of key factors 2025 and 2030

7.3 Bargaining power of suppliers

Bargaining power of suppliers - Impact of key factors in 2025 and 2030

7.4 Threat of new entrants

Threat of new entrants - Impact of key factors in 2025 and 2030

7.5 Threat of substitutes

Threat of substitutes - Impact of key factors in 2025 and 2030

7.6 Threat of rivalry

Threat of rivalry - Impact of key factors in 2025 and 2030

7.7 Market condition

Chart on Market condition - Five forces 2025 and 2030

8. Market Segmentation by Product

8.1 Market segments

Chart on Product - Market share 2025-2030 (%)
Data Table on Product - Market share 2025-2030 (%)

8.2 Comparison by Product

Chart on Comparison by Product
Data Table on Comparison by Product

8.3 Air turbine fuel - Market size and forecast 2025-2030

Chart on Air turbine fuel - Market size and forecast 2025-2030 ($ million)
Data Table on Air turbine fuel - Market size and forecast 2025-2030 ($ million)
Chart on Air turbine fuel - Year-over-year growth 2025-2030 (%)
Data Table on Air turbine fuel - Year-over-year growth 2025-2030 (%)

8.4 Aviation biofuel - Market size and forecast 2025-2030

Chart on Aviation biofuel - Market size and forecast 2025-2030 ($ million)
Data Table on Aviation biofuel - Market size and forecast 2025-2030 ($ million)
Chart on Aviation biofuel - Year-over-year growth 2025-2030 (%)
Data Table on Aviation biofuel - Year-over-year growth 2025-2030 (%)

8.5 Others - Market size and forecast 2025-2030

Chart on Others - Market size and forecast 2025-2030 ($ million)
Data Table on Others - Market size and forecast 2025-2030 ($ million)
Chart on Others - Year-over-year growth 2025-2030 (%)
Data Table on Others - Year-over-year growth 2025-2030 (%)

8.6 Market opportunity by Product

Market opportunity by Product ($ million)
Data Table on Market opportunity by Product ($ million)

9. Market Segmentation by Application

9.1 Market segments

Chart on Application - Market share 2025-2030 (%)
Data Table on Application - Market share 2025-2030 (%)

9.2 Comparison by Application

Chart on Comparison by Application
Data Table on Comparison by Application

9.3 Military operations - Market size and forecast 2025-2030

Chart on Military operations - Market size and forecast 2025-2030 ($ million)
Data Table on Military operations - Market size and forecast 2025-2030 ($ million)
Chart on Military operations - Year-over-year growth 2025-2030 (%)
Data Table on Military operations - Year-over-year growth 2025-2030 (%)

9.4 Training missions - Market size and forecast 2025-2030

Chart on Training missions - Market size and forecast 2025-2030 ($ million)
Data Table on Training missions - Market size and forecast 2025-2030 ($ million)
Chart on Training missions - Year-over-year growth 2025-2030 (%)
Data Table on Training missions - Year-over-year growth 2025-2030 (%)

9.5 Humanitarian aid - Market size and forecast 2025-2030

Chart on Humanitarian aid - Market size and forecast 2025-2030 ($ million)
Data Table on Humanitarian aid - Market size and forecast 2025-2030 ($ million)
Chart on Humanitarian aid - Year-over-year growth 2025-2030 (%)
Data Table on Humanitarian aid - Year-over-year growth 2025-2030 (%)

9.6 Research and development - Market size and forecast 2025-2030

Chart on Research and development - Market size and forecast 2025-2030 ($ million)
Data Table on Research and development - Market size and forecast 2025-2030 ($ million)
Chart on Research and development - Year-over-year growth 2025-2030 (%)
Data Table on Research and development - Year-over-year growth 2025-2030 (%)

9.7 Market opportunity by Application

Market opportunity by Application ($ million)
Data Table on Market opportunity by Application ($ million)

10. Market Segmentation by Aircraft Type

10.1 Market segments

Chart on Aircraft Type - Market share 2025-2030 (%)
Data Table on Aircraft Type - Market share 2025-2030 (%)

10.2 Comparison by Aircraft Type

Chart on Comparison by Aircraft Type
Data Table on Comparison by Aircraft Type

10.3 Fighter aircraft - Market size and forecast 2025-2030

Chart on Fighter aircraft - Market size and forecast 2025-2030 ($ million)
Data Table on Fighter aircraft - Market size and forecast 2025-2030 ($ million)
Chart on Fighter aircraft - Year-over-year growth 2025-2030 (%)
Data Table on Fighter aircraft - Year-over-year growth 2025-2030 (%)

10.4 Transport planes - Market size and forecast 2025-2030

Chart on Transport planes - Market size and forecast 2025-2030 ($ million)
Data Table on Transport planes - Market size and forecast 2025-2030 ($ million)
Chart on Transport planes - Year-over-year growth 2025-2030 (%)
Data Table on Transport planes - Year-over-year growth 2025-2030 (%)

10.5 Helicopters - Market size and forecast 2025-2030

Chart on Helicopters - Market size and forecast 2025-2030 ($ million)
Data Table on Helicopters - Market size and forecast 2025-2030 ($ million)
Chart on Helicopters - Year-over-year growth 2025-2030 (%)
Data Table on Helicopters - Year-over-year growth 2025-2030 (%)

10.6 Others - Market size and forecast 2025-2030

Chart on Others - Market size and forecast 2025-2030 ($ million)
Data Table on Others - Market size and forecast 2025-2030 ($ million)
Chart on Others - Year-over-year growth 2025-2030 (%)
Data Table on Others - Year-over-year growth 2025-2030 (%)

10.7 Market opportunity by Aircraft Type

Market opportunity by Aircraft Type ($ million)
Data Table on Market opportunity by Aircraft Type ($ million)

11. Customer Landscape

11.1 Customer landscape overview

Analysis of price sensitivity, lifecycle, customer purchase basket, adoption rates, and purchase criteria

12. Geographic Landscape

12.1 Geographic segmentation

Chart on Market share by geography 2025-2030 (%)
Data Table on Market share by geography 2025-2030 (%)

12.2 Geographic comparison

Chart on Geographic comparison
Data Table on Geographic comparison

12.3 North America - Market size and forecast 2025-2030

Chart on North America - Market size and forecast 2025-2030 ($ million)
Data Table on North America - Market size and forecast 2025-2030 ($ million)
Chart on North America - Year-over-year growth 2025-2030 (%)
Data Table on North America - Year-over-year growth 2025-2030 (%)
Chart on Regional Comparison - North America
Data Table on Regional Comparison - North America

12.3.1 US - Market size and forecast 2025-2030

Chart on US - Market size and forecast 2025-2030 ($ million)
Data Table on US - Market size and forecast 2025-2030 ($ million)
Chart on US - Year-over-year growth 2025-2030 (%)
Data Table on US - Year-over-year growth 2025-2030 (%)

12.3.2 Canada - Market size and forecast 2025-2030

Chart on Canada - Market size and forecast 2025-2030 ($ million)
Data Table on Canada - Market size and forecast 2025-2030 ($ million)
Chart on Canada - Year-over-year growth 2025-2030 (%)
Data Table on Canada - Year-over-year growth 2025-2030 (%)

12.3.3 Mexico - Market size and forecast 2025-2030

Chart on Mexico - Market size and forecast 2025-2030 ($ million)
Data Table on Mexico - Market size and forecast 2025-2030 ($ million)
Chart on Mexico - Year-over-year growth 2025-2030 (%)
Data Table on Mexico - Year-over-year growth 2025-2030 (%)

12.4 APAC - Market size and forecast 2025-2030

Chart on APAC - Market size and forecast 2025-2030 ($ million)
Data Table on APAC - Market size and forecast 2025-2030 ($ million)
Chart on APAC - Year-over-year growth 2025-2030 (%)
Data Table on APAC - Year-over-year growth 2025-2030 (%)
Chart on Regional Comparison - APAC
Data Table on Regional Comparison - APAC

12.4.1 China - Market size and forecast 2025-2030

Chart on China - Market size and forecast 2025-2030 ($ million)
Data Table on China - Market size and forecast 2025-2030 ($ million)
Chart on China - Year-over-year growth 2025-2030 (%)
Data Table on China - Year-over-year growth 2025-2030 (%)

12.4.2 Japan - Market size and forecast 2025-2030

Chart on Japan - Market size and forecast 2025-2030 ($ million)
Data Table on Japan - Market size and forecast 2025-2030 ($ million)
Chart on Japan - Year-over-year growth 2025-2030 (%)
Data Table on Japan - Year-over-year growth 2025-2030 (%)

12.4.3 India - Market size and forecast 2025-2030

Chart on India - Market size and forecast 2025-2030 ($ million)
Data Table on India - Market size and forecast 2025-2030 ($ million)
Chart on India - Year-over-year growth 2025-2030 (%)
Data Table on India - Year-over-year growth 2025-2030 (%)

12.4.4 South Korea - Market size and forecast 2025-2030

Chart on South Korea - Market size and forecast 2025-2030 ($ million)
Data Table on South Korea - Market size and forecast 2025-2030 ($ million)
Chart on South Korea - Year-over-year growth 2025-2030 (%)
Data Table on South Korea - Year-over-year growth 2025-2030 (%)

12.4.5 Australia - Market size and forecast 2025-2030

Chart on Australia - Market size and forecast 2025-2030 ($ million)
Data Table on Australia - Market size and forecast 2025-2030 ($ million)
Chart on Australia - Year-over-year growth 2025-2030 (%)
Data Table on Australia - Year-over-year growth 2025-2030 (%)

12.4.6 Indonesia - Market size and forecast 2025-2030

Chart on Indonesia - Market size and forecast 2025-2030 ($ million)
Data Table on Indonesia - Market size and forecast 2025-2030 ($ million)
Chart on Indonesia - Year-over-year growth 2025-2030 (%)
Data Table on Indonesia - Year-over-year growth 2025-2030 (%)

12.5 Europe - Market size and forecast 2025-2030

Chart on Europe - Market size and forecast 2025-2030 ($ million)
Data Table on Europe - Market size and forecast 2025-2030 ($ million)
Chart on Europe - Year-over-year growth 2025-2030 (%)
Data Table on Europe - Year-over-year growth 2025-2030 (%)
Chart on Regional Comparison - Europe
Data Table on Regional Comparison - Europe

12.5.1 Germany - Market size and forecast 2025-2030

Chart on Germany - Market size and forecast 2025-2030 ($ million)
Data Table on Germany - Market size and forecast 2025-2030 ($ million)
Chart on Germany - Year-over-year growth 2025-2030 (%)
Data Table on Germany - Year-over-year growth 2025-2030 (%)

12.5.2 UK - Market size and forecast 2025-2030

Chart on UK - Market size and forecast 2025-2030 ($ million)
Data Table on UK - Market size and forecast 2025-2030 ($ million)
Chart on UK - Year-over-year growth 2025-2030 (%)
Data Table on UK - Year-over-year growth 2025-2030 (%)

12.5.3 France - Market size and forecast 2025-2030

Chart on France - Market size and forecast 2025-2030 ($ million)
Data Table on France - Market size and forecast 2025-2030 ($ million)
Chart on France - Year-over-year growth 2025-2030 (%)
Data Table on France - Year-over-year growth 2025-2030 (%)

12.5.4 Italy - Market size and forecast 2025-2030

Chart on Italy - Market size and forecast 2025-2030 ($ million)
Data Table on Italy - Market size and forecast 2025-2030 ($ million)
Chart on Italy - Year-over-year growth 2025-2030 (%)
Data Table on Italy - Year-over-year growth 2025-2030 (%)

12.5.5 Spain - Market size and forecast 2025-2030

Chart on Spain - Market size and forecast 2025-2030 ($ million)
Data Table on Spain - Market size and forecast 2025-2030 ($ million)
Chart on Spain - Year-over-year growth 2025-2030 (%)
Data Table on Spain - Year-over-year growth 2025-2030 (%)

12.5.6 The Netherlands - Market size and forecast 2025-2030

Chart on The Netherlands - Market size and forecast 2025-2030 ($ million)
Data Table on The Netherlands - Market size and forecast 2025-2030 ($ million)
Chart on The Netherlands - Year-over-year growth 2025-2030 (%)
Data Table on The Netherlands - Year-over-year growth 2025-2030 (%)

12.6 South America - Market size and forecast 2025-2030

Chart on South America - Market size and forecast 2025-2030 ($ million)
Data Table on South America - Market size and forecast 2025-2030 ($ million)
Chart on South America - Year-over-year growth 2025-2030 (%)
Data Table on South America - Year-over-year growth 2025-2030 (%)
Chart on Regional Comparison - South America
Data Table on Regional Comparison - South America

12.6.1 Brazil - Market size and forecast 2025-2030

Chart on Brazil - Market size and forecast 2025-2030 ($ million)
Data Table on Brazil - Market size and forecast 2025-2030 ($ million)
Chart on Brazil - Year-over-year growth 2025-2030 (%)
Data Table on Brazil - Year-over-year growth 2025-2030 (%)

12.6.2 Argentina - Market size and forecast 2025-2030

Chart on Argentina - Market size and forecast 2025-2030 ($ million)
Data Table on Argentina - Market size and forecast 2025-2030 ($ million)
Chart on Argentina - Year-over-year growth 2025-2030 (%)
Data Table on Argentina - Year-over-year growth 2025-2030 (%)

12.6.3 Chile - Market size and forecast 2025-2030

Chart on Chile - Market size and forecast 2025-2030 ($ million)
Data Table on Chile - Market size and forecast 2025-2030 ($ million)
Chart on Chile - Year-over-year growth 2025-2030 (%)
Data Table on Chile - Year-over-year growth 2025-2030 (%)

12.7 Middle East and Africa - Market size and forecast 2025-2030

Chart on Middle East and Africa - Market size and forecast 2025-2030 ($ million)
Data Table on Middle East and Africa - Market size and forecast 2025-2030 ($ million)
Chart on Middle East and Africa - Year-over-year growth 2025-2030 (%)
Data Table on Middle East and Africa - Year-over-year growth 2025-2030 (%)
Chart on Regional Comparison - Middle East and Africa
Data Table on Regional Comparison - Middle East and Africa

12.7.1 Saudi Arabia - Market size and forecast 2025-2030

Chart on Saudi Arabia - Market size and forecast 2025-2030 ($ million)
Data Table on Saudi Arabia - Market size and forecast 2025-2030 ($ million)
Chart on Saudi Arabia - Year-over-year growth 2025-2030 (%)
Data Table on Saudi Arabia - Year-over-year growth 2025-2030 (%)

12.7.2 UAE - Market size and forecast 2025-2030

Chart on UAE - Market size and forecast 2025-2030 ($ million)
Data Table on UAE - Market size and forecast 2025-2030 ($ million)
Chart on UAE - Year-over-year growth 2025-2030 (%)
Data Table on UAE - Year-over-year growth 2025-2030 (%)

12.7.3 South Africa - Market size and forecast 2025-2030

Chart on South Africa - Market size and forecast 2025-2030 ($ million)
Data Table on South Africa - Market size and forecast 2025-2030 ($ million)
Chart on South Africa - Year-over-year growth 2025-2030 (%)
Data Table on South Africa - Year-over-year growth 2025-2030 (%)

12.7.4 Israel - Market size and forecast 2025-2030

Chart on Israel - Market size and forecast 2025-2030 ($ million)
Data Table on Israel - Market size and forecast 2025-2030 ($ million)
Chart on Israel - Year-over-year growth 2025-2030 (%)
Data Table on Israel - Year-over-year growth 2025-2030 (%)

12.7.5 Turkey - Market size and forecast 2025-2030

Chart on Turkey - Market size and forecast 2025-2030 ($ million)
Data Table on Turkey - Market size and forecast 2025-2030 ($ million)
Chart on Turkey - Year-over-year growth 2025-2030 (%)
Data Table on Turkey - Year-over-year growth 2025-2030 (%)

12.8 Market opportunity by geography

Market opportunity by geography ($ million)
Data Tables on Market opportunity by geography ($ million)

13. Drivers, Challenges, and Opportunity

13.1 Market drivers

Increasing use of military UAVs
Increasing demand for long-range and heavy payload military aircraft
Rising investments in defense sector by various countries

13.2 Market challenges

Fluctuations in crude oil prices
Rise in adoption of fuel cells
Limited availability of sustainable fuel sources

13.3 Impact of drivers and challenges

Impact of drivers and challenges in 2025 and 2030

13.4 Market opportunities

Increase in demand for jet fuel
Use of alternative fuels to reduce dependence on conventional fuels and decrease carbon emissions
Advancements in technology to enhance fuel efficiency and reduce maintenance costs

14. Competitive Landscape

14.1 Overview

14.2

Overview on criticality of inputs and factors of differentiation

14.3 Landscape disruption

Overview on factors of disruption

14.4 Industry risks

Impact of key risks on business

15. Competitive Analysis

15.1 Companies profiled

Companies covered

15.2 Company ranking index

15.3 Market positioning of companies

Matrix on companies position and classification

15.4 BP Plc

BP Plc - Overview
BP Plc - Business segments
BP Plc - Key news
BP Plc - Key offerings
BP Plc - Segment focus
SWOT

15.5 Chevron Corp.

Chevron Corp. - Overview
Chevron Corp. - Business segments
Chevron Corp. - Key news
Chevron Corp. - Key offerings
Chevron Corp. - Segment focus
SWOT

15.6 Emirates National Oil Co.

Emirates National Oil Co. - Overview
Emirates National Oil Co. - Product / Service
Emirates National Oil Co. - Key offerings
SWOT

15.7 Exxon Mobil Corp.

Exxon Mobil Corp. - Overview
Exxon Mobil Corp. - Business segments
Exxon Mobil Corp. - Key offerings
Exxon Mobil Corp. - Segment focus
SWOT

15.8 Honeywell International Inc.

Honeywell International Inc. - Overview
Honeywell International Inc. - Business segments
Honeywell International Inc. - Key news
Honeywell International Inc. - Key offerings
Honeywell International Inc. - Segment focus
SWOT

15.9 Indian Oil Corp. Ltd.

Indian Oil Corp. Ltd. - Overview
Indian Oil Corp. Ltd. - Business segments
Indian Oil Corp. Ltd. - Key news
Indian Oil Corp. Ltd. - Key offerings
Indian Oil Corp. Ltd. - Segment focus
SWOT

15.10 Marathon Petroleum Corp.

Marathon Petroleum Corp. - Overview
Marathon Petroleum Corp. - Business segments
Marathon Petroleum Corp. - Key offerings
Marathon Petroleum Corp. - Segment focus
SWOT

15.11 Neste Corp.

Neste Corp. - Overview
Neste Corp. - Business segments
Neste Corp. - Key news
Neste Corp. - Key offerings
Neste Corp. - Segment focus
SWOT

15.12 PJSC LUKOIL

PJSC LUKOIL - Overview
PJSC LUKOIL - Product / Service
PJSC LUKOIL - Key offerings
SWOT

15.13 Repsol SA

Repsol SA - Overview
Repsol SA - Business segments
Repsol SA - Key news
Repsol SA - Key offerings
Repsol SA - Segment focus
SWOT

15.14 Shell plc

Shell plc - Overview
Shell plc - Business segments
Shell plc - Key news
Shell plc - Key offerings
Shell plc - Segment focus
SWOT

15.15 TotalEnergies SE

TotalEnergies SE - Overview
TotalEnergies SE - Business segments
TotalEnergies SE - Key news
TotalEnergies SE - Key offerings
TotalEnergies SE - Segment focus
SWOT

15.16 Valero Energy Corp.

Valero Energy Corp. - Overview
Valero Energy Corp. - Business segments
Valero Energy Corp. - Key offerings
Valero Energy Corp. - Segment focus
SWOT

15.17 Vitol Netherlands Cooperatief UA

Vitol Netherlands Cooperatief UA - Overview
Vitol Netherlands Cooperatief UA - Product / Service
Vitol Netherlands Cooperatief UA - Key offerings
SWOT

15.18 World Kinect Corp

World Kinect Corp - Overview
World Kinect Corp - Business segments
World Kinect Corp - Key offerings
World Kinect Corp - Segment focus
SWOT

16. Appendix

16.1 Scope of the report

Market definition
Objectives
Notes and caveats

16.2 Inclusions and exclusions checklist

Inclusions checklist
Exclusions checklist

16.3 Currency conversion rates for US$

16.4 Research methodology

16.5 Data procurement

Information sources

16.6 Data validation

16.7 Validation techniques employed for market sizing

16.8 Data synthesis

16.9 360 degree market analysis

16.10 List of abbreviations

Research Methodology

Technavio presents a detailed picture of the market by way of study, synthesis, and summation of data from multiple sources. The analysts have presented the various facets of the market with a particular focus on identifying the key industry influencers. The data thus presented is comprehensive, reliable, and the result of extensive research, both primary and secondary.

INFORMATION SOURCES

Primary sources

  • Manufacturers and suppliers
  • Channel partners
  • Industry experts
  • Strategic decision makers

Secondary sources

  • Industry journals and periodicals
  • Government data
  • Financial reports of key industry players
  • Historical data
  • Press releases

DATA ANALYSIS

Data Synthesis

  • Collation of data
  • Estimation of key figures
  • Analysis of derived insights

Data Validation

  • Triangulation with data models
  • Reference against proprietary databases
  • Corroboration with industry experts

REPORT WRITING

Qualitative

  • Market drivers
  • Market challenges
  • Market trends
  • Five forces analysis

Quantitative

  • Market size and forecast
  • Market segmentation
  • Geographical insights
  • Competitive landscape

Interested in this report?

Get your sample now to see our research methodology and insights!

Download Now

Frequently Asked Questions

Defense Aircraft Aviation Fuel market growth will increase by USD 22247.2 million during 2026-2030.

The Defense Aircraft Aviation Fuel market is expected to grow at a CAGR of 6.4% during 2026-2030.

Defense Aircraft Aviation Fuel market is segmented by Product (Air turbine fuel, Aviation biofuel, Others) Application (Military operations, Training missions, Humanitarian aid, Research and development) Aircraft type (Fighter aircraft, Transport planes, Helicopters, Others)

BP Plc, Chevron Corp., Emirates National Oil Co., Exxon Mobil Corp., Honeywell International Inc., Indian Oil Corp. Ltd., Marathon Petroleum Corp., MOL Group, Neste Corp., Petroleo Brasileiro SA, PJSC LUKOIL, Repsol SA, Shell plc, SkyNRG BV, Swedish Biofuels AB, TotalEnergies SE, Valero Energy Corp., Vitol Netherlands Cooperatief UA, World Kinect Corp are a few of the key vendors in the Defense Aircraft Aviation Fuel market.

APAC will register the highest growth rate of 36.7% among the other regions. Therefore, the Defense Aircraft Aviation Fuel market in APAC is expected to garner significant business opportunities for the vendors during the forecast period.

US, Canada, Mexico, China, Japan, India, South Korea, Australia, Indonesia, Germany, UK, France, Italy, Spain, The Netherlands, Brazil, Argentina, Chile, Saudi Arabia, UAE, South Africa, Israel, Turkey

  • Increasing use of military UAVs is the driving factor this market.

The Defense Aircraft Aviation Fuel market vendors should focus on grabbing business opportunities from the Product segment as it accounted for the largest market share in the base year.