Dental Imaging Market Analysis, Size, and Forecast 2026-2030: North America (US, Canada, and Mexico), APAC (China, Japan, and India), Europe (Germany, UK, and France), South America (Brazil and Argentina), Middle East and Africa (Saudi Arabia, South Africa, and Turkey), Asia, Rest of World (ROW)

Dental Imaging Market Analysis, Size, and Forecast 2026-2030:
North America (US, Canada, and Mexico), APAC (China, Japan, and India), Europe (Germany, UK, and France), South America (Brazil and Argentina), Middle East and Africa (Saudi Arabia, South Africa, and Turkey), Asia, Rest of World (ROW)

Published: Apr 2026 296 Pages SKU: IRTNTR75074

Market Overview at a Glance

$1.89 B
Market Opportunity
7.7%
CAGR 2025 - 2030
37.9%
North America Growth
$2.00 B
Dental clinics segment 2024

Dental Imaging Market Size 2026-2030

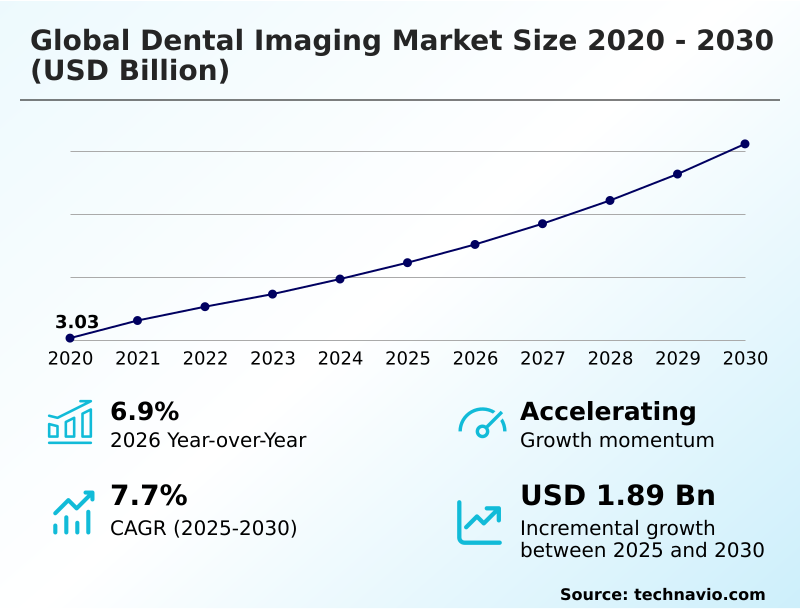
The dental imaging market size is valued to increase by USD 1.89 billion, at a CAGR of 7.7% from 2025 to 2030. Integration of AI and ML in diagnostic workflows will drive the dental imaging market.

Major Market Trends & Insights

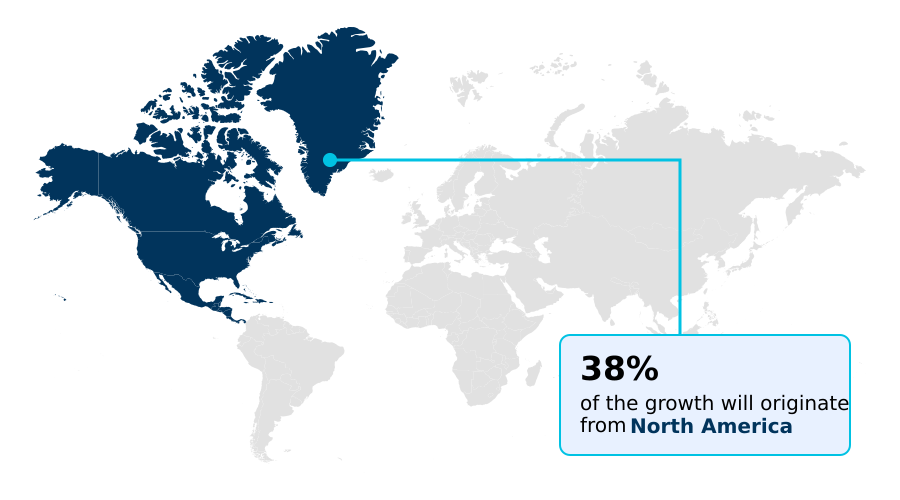
  • North America dominated the market and accounted for a 37.9% growth during the forecast period.
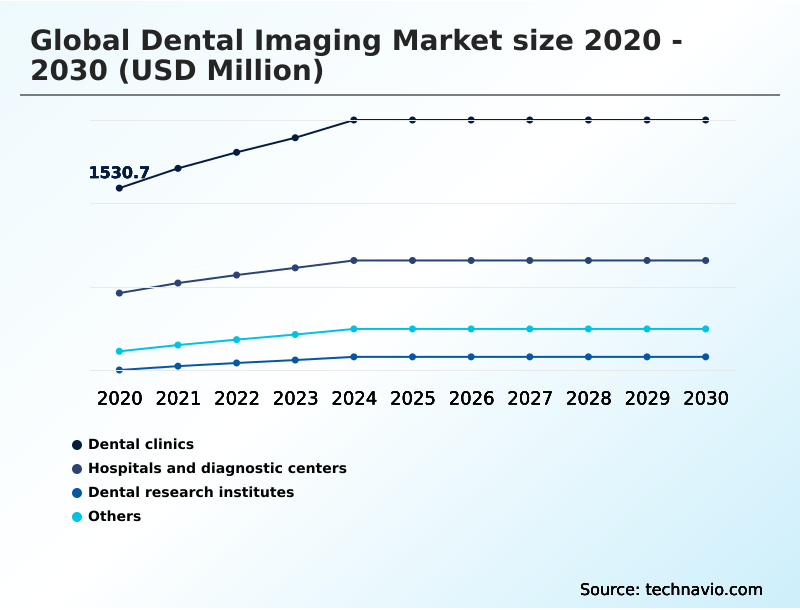
  • By End-user - Dental clinics segment was valued at USD 2.00 billion in 2024
  • By Application - Diagnostic segment accounted for the largest market revenue share in 2024

Market Size & Forecast

  • Market Opportunities: USD 3.09 billion
  • Market Future Opportunities: USD 1.89 billion
  • CAGR from 2025 to 2030 : 7.7%

Market Summary

  • The dental imaging market is undergoing a significant transformation, moving from conventional film to integrated digital ecosystems. This evolution is driven by the clinical demand for superior diagnostic precision, especially for complex procedures like implantology and orthodontics.
  • The rising prevalence of oral health issues and a growing interest in aesthetic dentistry fuel the adoption of advanced hardware, including intraoral scanners and cone beam computed tomography systems, which offer detailed three-dimensional views. A key dynamic is the integration of artificial intelligence into imaging software, which automates the detection of subtle pathologies and reduces diagnostic errors.
  • For instance, a multi-location dental service organization can implement a cloud-based platform to standardize image analysis and quality of care, leading to improved diagnostic consistency and operational efficiency across its network.
  • Although the high cost of this technology presents a challenge for smaller practices, the demonstrable improvements in patient safety, thanks to lower radiation doses and enhanced diagnostic accuracy, continue to propel market expansion.

What will be the Size of the Dental Imaging Market during the forecast period?

Get Key Insights on Market Forecast (PDF) Request Free Sample

How is the Dental Imaging Market Segmented?

The dental imaging industry research report provides comprehensive data (region-wise segment analysis), with forecasts and estimates in "USD million" for the period 2026-2030, as well as historical data from 2020-2024 for the following segments.

  • End-user
    • Dental clinics
    • Hospitals and diagnostic centers
    • Dental research institutes
    • Others
  • Application
    • Diagnostic
    • Cosmetic
    • Forensic
  • Type
    • Intraoral imaging
    • Extraoral imaging
    • Cone beam computed tomography
    • 3D dental imaging
    • Others
  • Geography
    • North America
      • US
      • Canada
      • Mexico
    • Asia
    • Europe
      • Germany
      • UK
      • France
    • Rest of World (ROW)

By End-user Insights

The dental clinics segment is estimated to witness significant growth during the forecast period.

Dental clinics represent the largest end-user segment, driven by a broad transition toward localized, patient-centric care models. These facilities are modernizing diagnostic capabilities to enhance clinical outcomes, making intraoral radiography and digital x-ray sensors baseline requirements.

This shift enables faster workflows with real-time digital radiography, replacing legacy analog methods. In developed markets, practitioners are investing in integrated ecosystems that combine 3d dental modeling with practice management systems for seamless data handling.

Over 70% of urban clinics have adopted fully digital workflows, accommodating demand for same-day restorative procedures.

This utilization of advanced imaging, including cephalometric analysis, allows solo practitioners to perform complex procedures like guided implant surgery and orthodontic planning in-house, retaining revenue and improving the quality of patient care.

Request Free Sample

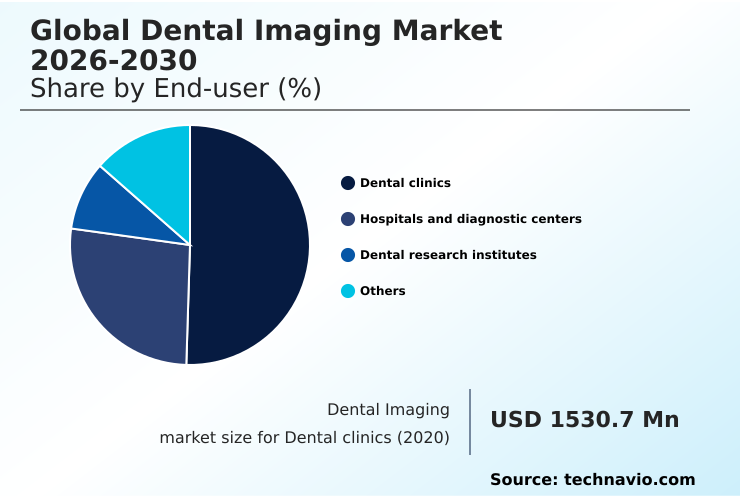
The Dental clinics segment was valued at USD 2.00 billion in 2024 and showed a gradual increase during the forecast period.

Request Free Sample

Regional Analysis

North America is estimated to contribute 37.9% to the growth of the global market during the forecast period.Technavio’s analysts have elaborately explained the regional trends and drivers that shape the market during the forecast period.

See How Dental Imaging Market Demand is Rising in North America Request Free Sample

The global dental imaging market exhibits distinct regional dynamics. North America remains a dominant region, with high adoption of advanced technologies like cone beam computed tomography, driven by large dental service organizations.

Its incremental growth contributes over 37% to the global market. In contrast, Asia is the fastest-growing region, with adoption rates expanding at nearly 8% annually, significantly outpacing Europe.

This growth is fueled by modernizing healthcare infrastructure and a rising focus on high-quality care, leading to increased demand for panoramic imaging systems and diagnostic software.

Europe shows steady growth, with a focus on integrating AI-powered caries detection and ensuring regulatory compliance for medical imaging informatics.

The shift toward digital radiography is a common thread, but the pace and investment priorities vary, shaping the competitive landscape in each geography.

Market Dynamics

Our researchers analyzed the data with 2025 as the base year, along with the key drivers, trends, and challenges. A holistic analysis of drivers will help companies refine their marketing strategies to gain a competitive advantage.

  • The strategic implementation of advanced imaging technologies is reshaping clinical protocols across various dental specialties. The use of CBCT for endodontic evaluation has become a standard for complex root canal anatomies, providing critical 3D views that traditional radiographs cannot offer. Similarly, the role of 3D imaging for maxillofacial surgery is indispensable for precise surgical planning and improved patient outcomes.
  • In restorative dentistry, practices utilizing intraoral scanners for same-day crowns report patient visit times that are up to 40% shorter than those using conventional lab-based methods, directly boosting clinic productivity. The application of AI algorithms for periodontal bone loss assessment allows for earlier and more accurate diagnoses. Furthermore, digital workflows for full-arch implant reconstruction are becoming more common, enhancing predictability.
  • The integration of CBCT in orthodontic diagnosis aids in complex case planning, while intraoral scanners are fundamental for creating clear aligner treatment plans. Advanced software now facilitates virtual articulators for occlusal analysis and digital smile design for aesthetic cases. The technology is also crucial for guided bone regeneration procedures, TMJ diagnostics, and evaluating pediatric dental development.
  • Moreover, 3D printing from intraoral scans enables in-house production of surgical guides. The technology also supports advanced sleep apnea appliance fabrication, improves accuracy in cosmetic dentistry simulations, and is essential for detecting vertical root fractures, showcasing its broad utility.

What are the key market drivers leading to the rise in the adoption of Dental Imaging Industry?

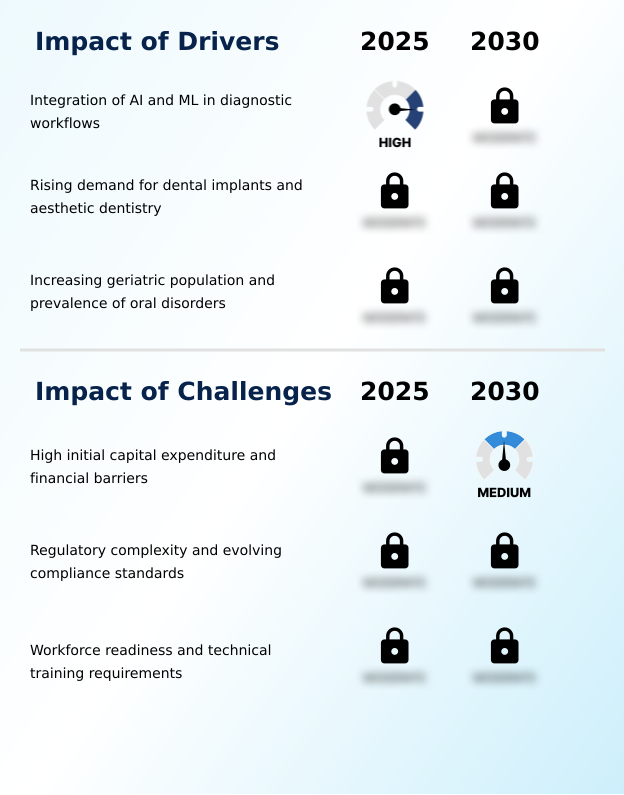
  • A key market driver is the increasing integration of artificial intelligence and machine learning technologies into diagnostic workflows, which improves accuracy and efficiency.

  • Market growth is primarily driven by technological advancements that improve diagnostic precision and workflow efficiency.
  • The integration of AI and ML into diagnostic software is a significant factor, automating tasks like cephalometric analysis and enhancing the capabilities of panoramic imaging systems.
  • The rising demand for aesthetic and restorative procedures, such as those requiring dental implant planning, fuels the adoption of cone beam computed tomography.
  • This technology is critical for procedures where 3D visualization is necessary, leading to a 15% increase in system sales in key demographics.
  • Additionally, an aging population with a higher prevalence of complex oral health issues necessitates advanced imaging modalities like digital x-ray sensors and intraoral radiography to ensure accurate diagnoses and effective treatment planning, solidifying the need for digital radiography.

What are the market trends shaping the Dental Imaging Industry?

  • The market is observing a significant trend toward the proliferation of AI-driven diagnostic automation, which is enhancing clinical decision support systems within dental practices.

  • Key market trends are centered on automation and enhanced visualization, driven by the integration of sophisticated diagnostic software. The proliferation of AI-powered caries detection is reshaping preventive care, with some algorithms demonstrating over 90% accuracy in identifying incipient lesions, a notable improvement over unassisted visual checks.
  • This trend is complemented by the move toward comprehensive 3D dental modeling, which provides clinicians with a holistic view for treatment planning. The adoption of portable digital radiography solutions has increased accessibility in non-traditional settings by 25%. Furthermore, the evolution of medical imaging informatics enables seamless data sharing, supporting collaborative diagnostics.
  • These advancements in digital radiography and cephalometric analysis are making workflows more efficient and improving the precision of clinical outcomes across the board.

What challenges does the Dental Imaging Industry face during its growth?

  • The substantial initial capital expenditure required for advanced imaging systems presents a significant financial barrier and a key challenge to market growth.

  • Significant challenges constrain market adoption, primarily related to cost and complexity. The high capital expenditure for systems like cone beam computed tomography is a major hurdle for smaller practices. The total cost of ownership for such a system can be 40% higher than the initial hardware price when factoring in software licenses and maintenance.
  • This financial barrier slows the replacement of older panoramic imaging equipment. Additionally, the complexity of integrating new diagnostic software with existing practice management systems creates technical challenges.
  • The need for specialized training on advanced features like 3D dental modeling and AI-powered caries detection adds to the operational burden, while navigating the evolving standards for medical imaging informatics presents a continuous compliance challenge for practitioners.

Exclusive Technavio Analysis on Customer Landscape

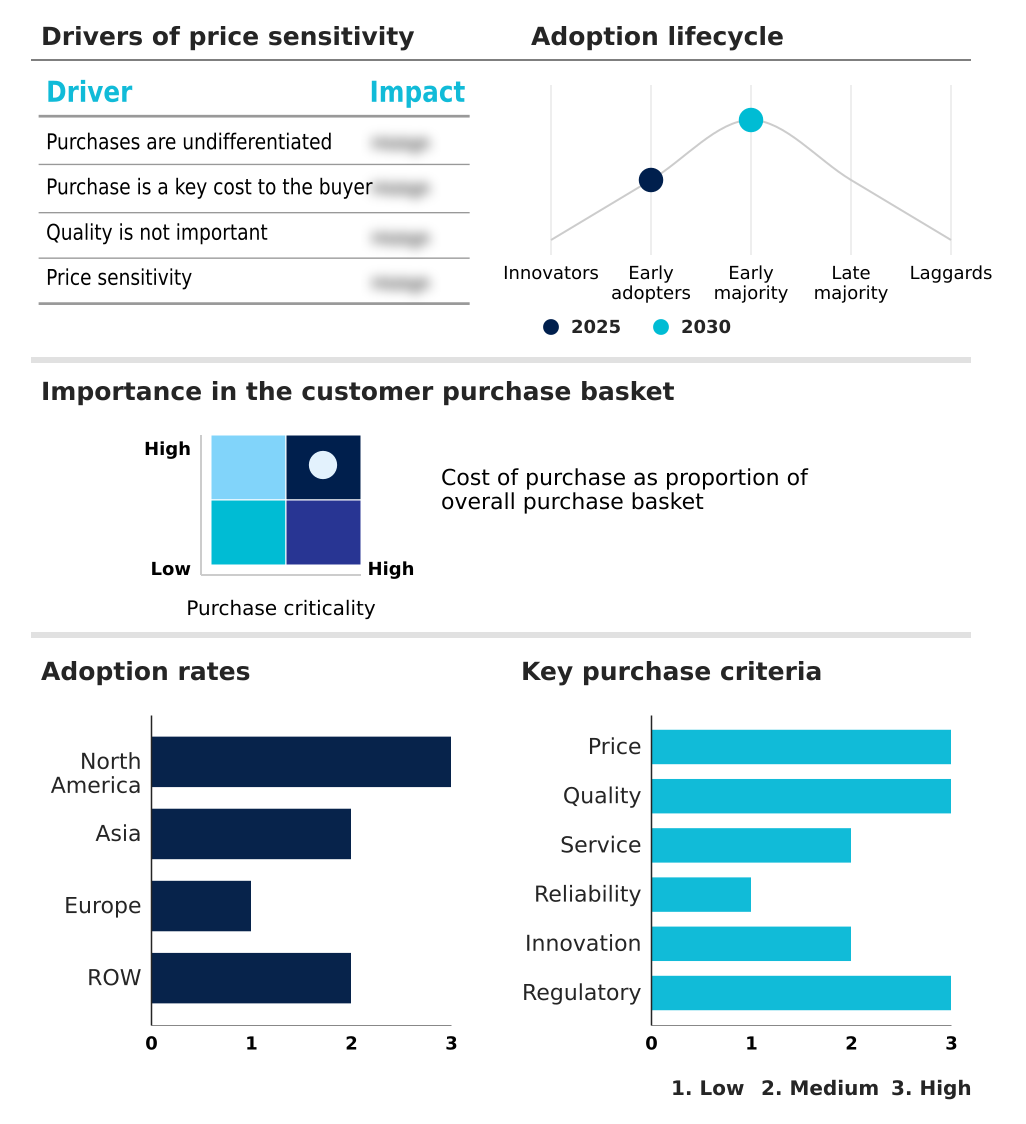
The dental imaging market forecasting report includes the adoption lifecycle of the market, covering from the innovator’s stage to the laggard’s stage. It focuses on adoption rates in different regions based on penetration. Furthermore, the dental imaging market report also includes key purchase criteria and drivers of price sensitivity to help companies evaluate and develop their market growth analysis strategies.

Customer Landscape of Dental Imaging Industry

Competitive Landscape

Companies are implementing various strategies, such as strategic alliances, dental imaging market forecast, partnerships, mergers and acquisitions, geographical expansion, and product/service launches, to enhance their presence in the industry.

3Shape AS - The vendor portfolio includes advanced intraoral scanners and integrated software platforms, enabling comprehensive digital impression and diagnostic workflows for dental professionals.

The industry research and growth report includes detailed analyses of the competitive landscape of the market and information about key companies, including:

  • 3Shape AS
  • ACTEON Group
  • Air Techniques Inc.
  • Align Technology Inc.
  • Asahi Roentgen Industry Co Ltd
  • Carestream Dental LLC
  • Dentsply Sirona Inc.
  • Durr Dental SE
  • Envista Holdings Corp.
  • GENORAY Co. Ltd.
  • J. Morita Corp.
  • Medit Corp.
  • Midmark Corp.
  • Owandy Radiology
  • Planmeca Oy
  • PreXion Inc.
  • Ray Co Ltd
  • Shining 3D Tech Co Ltd.
  • Xline SRL
  • Yoshida Dental Mfg Co Ltd

Qualitative and quantitative analysis of companies has been conducted to help clients understand the wider business environment as well as the strengths and weaknesses of key industry players. Data is qualitatively analyzed to categorize companies as pure play, category-focused, industry-focused, and diversified; it is quantitatively analyzed to categorize companies as dominant, leading, strong, tentative, and weak.

Recent Development and News in Dental imaging market

  • In September 2024, Dentsply Sirona Inc. launched its next-generation Axeos 2D/3D imaging system, featuring a 15% reduction in radiation dose and an expanded field of view for enhanced orthodontic and implantology planning.
  • In November 2024, Planmeca Oy and Align Technology Inc. announced a strategic partnership to ensure seamless interoperability between Planmeca's Romexis software and the iTero intraoral scanner, streamlining clear aligner workflows.
  • In January 2025, Carestream Dental LLC received FDA 510(k) clearance for its AI-powered CS Imaging version 8 software, which automates the detection of periapical lesions on 2D radiographs with over 90% accuracy.
  • In April 2025, Envista Holdings Corp. announced the acquisition of a leading dental AI software startup for approximately $300 million to integrate predictive analytics for periodontal disease into its DTX Studio Clinic platform.

Dive into Technavio’s robust research methodology, blending expert interviews, extensive data synthesis, and validated models for unparalleled Dental Imaging Market insights. See full methodology.

Market Scope
Page number 296
Base year 2025
Historic period 2020-2024
Forecast period 2026-2030
Growth momentum & CAGR Accelerate at a CAGR of 7.7%
Market growth 2026-2030 USD 1891.3 million
Market structure Fragmented
YoY growth 2025-2026(%) 6.9%
Key countries US, Canada, Mexico, China, Japan, India, South Korea, Thailand, Indonesia, Germany, UK, France, Italy, Spain, The Netherlands, Brazil, Saudi Arabia, South Africa, Turkey, UAE, Argentina, Chile and Australia
Competitive landscape Leading Companies, Market Positioning of Companies, Competitive Strategies, and Industry Risks

Request Free Sample

Research Analyst Overview

  • The dental imaging market is evolving beyond hardware-centric solutions toward integrated, software-driven ecosystems. Key technologies such as cone beam computed tomography (CBCT) and digital x-ray sensors are now foundational, with differentiation shifting to software capabilities. The adoption of AI-powered caries detection and cephalometric analysis is becoming a critical value driver, automating routine tasks and enhancing diagnostic accuracy.
  • For instance, integrated platforms leveraging these tools have demonstrated a 30% reduction in image analysis time for complex cases. This shift forces leadership to make strategic decisions regarding capital investment in new 3D dental modeling systems versus allocating budgets for extensive staff training on sophisticated diagnostic software.
  • The market’s trajectory is defined by the seamless fusion of intraoral radiography and medical imaging informatics, creating a connected environment where data from panoramic imaging and digital radiography informs every stage of treatment, from diagnosis to final restoration.

What are the Key Data Covered in this Dental Imaging Market Research and Growth Report?

  • What is the expected growth of the Dental Imaging Market between 2026 and 2030?

    • USD 1.89 billion, at a CAGR of 7.7%

  • What segmentation does the market report cover?

    • The report is segmented by End-user (Dental clinics, Hospitals and diagnostic centers, Dental research institutes, and Others), Application (Diagnostic, Cosmetic, and Forensic), Type (Intraoral imaging, Extraoral imaging, Cone beam computed tomography, 3D dental imaging, and Others) and Geography (North America, Asia, Europe, Rest of World (ROW))

  • Which regions are analyzed in the report?

    • North America, Asia, Europe and Rest of World (ROW)

  • What are the key growth drivers and market challenges?

    • Integration of AI and ML in diagnostic workflows , High initial capital expenditure and financial barriers

  • Who are the major players in the Dental Imaging Market?

    • 3Shape AS, ACTEON Group, Air Techniques Inc., Align Technology Inc., Asahi Roentgen Industry Co Ltd, Carestream Dental LLC, Dentsply Sirona Inc., Durr Dental SE, Envista Holdings Corp., GENORAY Co. Ltd., J. Morita Corp., Medit Corp., Midmark Corp., Owandy Radiology, Planmeca Oy, PreXion Inc., Ray Co Ltd, Shining 3D Tech Co Ltd., Xline SRL and Yoshida Dental Mfg Co Ltd

Market Research Insights

  • The dental imaging market is defined by a rapid technological evolution where digital workflows and intelligent software are becoming standard. The integration of digital impression systems enhances diagnostic precision for complex procedures, with adoption rates in specialty practices increasing by over 30% in recent years.
  • This shift is reinforced by orthodontic treatment planning software that leverages 3D models to improve case acceptance. Furthermore, advanced radiographic interpretation aids powered by AI can reduce diagnostic oversights by more than 25% compared to manual review. These systems not only support dental implant planning but also streamline forensic odontology.
  • The focus on minimally invasive dentistry and patient-centric care models drives the demand for solutions that offer both superior clinical outcomes and operational efficiencies.

We can help! Our analysts can customize this dental imaging market research report to meet your requirements.

Get in touch

1. Executive Summary

1.1 Market overview

Executive Summary - Chart on Market Overview
Executive Summary - Data Table on Market Overview
Executive Summary - Chart on Global Market Characteristics
Executive Summary - Chart on Market by Geography
Executive Summary - Chart on Market Segmentation by End-user
Executive Summary - Chart on Market Segmentation by Application
Executive Summary - Chart on Market Segmentation by Type
Executive Summary - Chart on Incremental Growth
Executive Summary - Data Table on Incremental Growth
Executive Summary - Chart on Company Market Positioning

2. Technavio Analysis

2.1 Analysis of price sensitivity, lifecycle, customer purchase basket, adoption rates, and purchase criteria

2.2 Criticality of inputs and Factors of differentiation

Chart on Overview on criticality of inputs and factors of differentiation

2.3 Factors of disruption

Chart on Overview on factors of disruption

2.4 Impact of drivers and challenges

Chart on Impact of drivers and challenges in 2025 and 2030

3. Market Landscape

3.1 Market ecosystem

Chart on Parent Market
Data Table on - Parent Market

3.2 Market characteristics

Chart on Market characteristics analysis

3.3 Value chain analysis

Chart on Value chain analysis

4. Market Sizing

4.1 Market definition

Data Table on Offerings of companies included in the market definition

4.2 Market segment analysis

Market segments

4.3 Market size 2025

4.4 Market outlook: Forecast for 2025-2030

Chart on Global - Market size and forecast 2025-2030 ($ million)
Data Table on Global - Market size and forecast 2025-2030 ($ million)
Chart on Global Market: Year-over-year growth 2025-2030 (%)
Data Table on Global Market: Year-over-year growth 2025-2030 (%)

5. Historic Market Size

5.1 Global Dental Imaging Market 2020 - 2024

Historic Market Size - Data Table on Global Dental Imaging Market 2020 - 2024 ($ million)

5.2 End-user segment analysis 2020 - 2024

Historic Market Size - End-user Segment 2020 - 2024 ($ million)

5.3 Application segment analysis 2020 - 2024

Historic Market Size - Application Segment 2020 - 2024 ($ million)

5.4 Type segment analysis 2020 - 2024

Historic Market Size - Type Segment 2020 - 2024 ($ million)

5.5 Geography segment analysis 2020 - 2024

Historic Market Size - Geography Segment 2020 - 2024 ($ million)

5.6 Country segment analysis 2020 - 2024

Historic Market Size - Country Segment 2020 - 2024 ($ million)

6. Qualitative Analysis

6.1 Impact of AI on global dental imaging market

6.2 Impact of geopolitical conflict on global dental imaging market

7. Five Forces Analysis

7.1 Five forces summary

Five forces analysis - Comparison between 2025 and 2030

7.2 Bargaining power of buyers

Bargaining power of buyers - Impact of key factors 2025 and 2030

7.3 Bargaining power of suppliers

Bargaining power of suppliers - Impact of key factors in 2025 and 2030

7.4 Threat of new entrants

Threat of new entrants - Impact of key factors in 2025 and 2030

7.5 Threat of substitutes

Threat of substitutes - Impact of key factors in 2025 and 2030

7.6 Threat of rivalry

Threat of rivalry - Impact of key factors in 2025 and 2030

7.7 Market condition

Chart on Market condition - Five forces 2025 and 2030

8. Market Segmentation by End-user

8.1 Market segments

Chart on End-user - Market share 2025-2030 (%)
Data Table on End-user - Market share 2025-2030 (%)

8.2 Comparison by End-user

Chart on Comparison by End-user
Data Table on Comparison by End-user

8.3 Dental clinics - Market size and forecast 2025-2030

Chart on Dental clinics - Market size and forecast 2025-2030 ($ million)
Data Table on Dental clinics - Market size and forecast 2025-2030 ($ million)
Chart on Dental clinics - Year-over-year growth 2025-2030 (%)
Data Table on Dental clinics - Year-over-year growth 2025-2030 (%)

8.4 Hospitals and diagnostic centers - Market size and forecast 2025-2030

Chart on Hospitals and diagnostic centers - Market size and forecast 2025-2030 ($ million)
Data Table on Hospitals and diagnostic centers - Market size and forecast 2025-2030 ($ million)
Chart on Hospitals and diagnostic centers - Year-over-year growth 2025-2030 (%)
Data Table on Hospitals and diagnostic centers - Year-over-year growth 2025-2030 (%)

8.5 Dental research institutes - Market size and forecast 2025-2030

Chart on Dental research institutes - Market size and forecast 2025-2030 ($ million)
Data Table on Dental research institutes - Market size and forecast 2025-2030 ($ million)
Chart on Dental research institutes - Year-over-year growth 2025-2030 (%)
Data Table on Dental research institutes - Year-over-year growth 2025-2030 (%)

8.6 Others - Market size and forecast 2025-2030

Chart on Others - Market size and forecast 2025-2030 ($ million)
Data Table on Others - Market size and forecast 2025-2030 ($ million)
Chart on Others - Year-over-year growth 2025-2030 (%)
Data Table on Others - Year-over-year growth 2025-2030 (%)

8.7 Market opportunity by End-user

Market opportunity by End-user ($ million)
Data Table on Market opportunity by End-user ($ million)

9. Market Segmentation by Application

9.1 Market segments

Chart on Application - Market share 2025-2030 (%)
Data Table on Application - Market share 2025-2030 (%)

9.2 Comparison by Application

Chart on Comparison by Application
Data Table on Comparison by Application

9.3 Diagnostic - Market size and forecast 2025-2030

Chart on Diagnostic - Market size and forecast 2025-2030 ($ million)
Data Table on Diagnostic - Market size and forecast 2025-2030 ($ million)
Chart on Diagnostic - Year-over-year growth 2025-2030 (%)
Data Table on Diagnostic - Year-over-year growth 2025-2030 (%)

9.4 Cosmetic - Market size and forecast 2025-2030

Chart on Cosmetic - Market size and forecast 2025-2030 ($ million)
Data Table on Cosmetic - Market size and forecast 2025-2030 ($ million)
Chart on Cosmetic - Year-over-year growth 2025-2030 (%)
Data Table on Cosmetic - Year-over-year growth 2025-2030 (%)

9.5 Forensic - Market size and forecast 2025-2030

Chart on Forensic - Market size and forecast 2025-2030 ($ million)
Data Table on Forensic - Market size and forecast 2025-2030 ($ million)
Chart on Forensic - Year-over-year growth 2025-2030 (%)
Data Table on Forensic - Year-over-year growth 2025-2030 (%)

9.6 Market opportunity by Application

Market opportunity by Application ($ million)
Data Table on Market opportunity by Application ($ million)

10. Market Segmentation by Type

10.1 Market segments

Chart on Type - Market share 2025-2030 (%)
Data Table on Type - Market share 2025-2030 (%)

10.2 Comparison by Type

Chart on Comparison by Type
Data Table on Comparison by Type

10.3 Intraoral imaging - Market size and forecast 2025-2030

Chart on Intraoral imaging - Market size and forecast 2025-2030 ($ million)
Data Table on Intraoral imaging - Market size and forecast 2025-2030 ($ million)
Chart on Intraoral imaging - Year-over-year growth 2025-2030 (%)
Data Table on Intraoral imaging - Year-over-year growth 2025-2030 (%)

10.4 Extraoral imaging - Market size and forecast 2025-2030

Chart on Extraoral imaging - Market size and forecast 2025-2030 ($ million)
Data Table on Extraoral imaging - Market size and forecast 2025-2030 ($ million)
Chart on Extraoral imaging - Year-over-year growth 2025-2030 (%)
Data Table on Extraoral imaging - Year-over-year growth 2025-2030 (%)

10.5 Cone beam computed tomography - Market size and forecast 2025-2030

Chart on Cone beam computed tomography - Market size and forecast 2025-2030 ($ million)
Data Table on Cone beam computed tomography - Market size and forecast 2025-2030 ($ million)
Chart on Cone beam computed tomography - Year-over-year growth 2025-2030 (%)
Data Table on Cone beam computed tomography - Year-over-year growth 2025-2030 (%)

10.6 3D dental imaging - Market size and forecast 2025-2030

Chart on 3D dental imaging - Market size and forecast 2025-2030 ($ million)
Data Table on 3D dental imaging - Market size and forecast 2025-2030 ($ million)
Chart on 3D dental imaging - Year-over-year growth 2025-2030 (%)
Data Table on 3D dental imaging - Year-over-year growth 2025-2030 (%)

10.7 Others - Market size and forecast 2025-2030

Chart on Others - Market size and forecast 2025-2030 ($ million)
Data Table on Others - Market size and forecast 2025-2030 ($ million)
Chart on Others - Year-over-year growth 2025-2030 (%)
Data Table on Others - Year-over-year growth 2025-2030 (%)

10.8 Market opportunity by Type

Market opportunity by Type ($ million)
Data Table on Market opportunity by Type ($ million)

11. Customer Landscape

11.1 Customer landscape overview

Analysis of price sensitivity, lifecycle, customer purchase basket, adoption rates, and purchase criteria

12. Geographic Landscape

12.1 Geographic segmentation

Chart on Market share by geography 2025-2030 (%)
Data Table on Market share by geography 2025-2030 (%)

12.2 Geographic comparison

Chart on Geographic comparison
Data Table on Geographic comparison

12.3 North America - Market size and forecast 2025-2030

Chart on North America - Market size and forecast 2025-2030 ($ million)
Data Table on North America - Market size and forecast 2025-2030 ($ million)
Chart on North America - Year-over-year growth 2025-2030 (%)
Data Table on North America - Year-over-year growth 2025-2030 (%)
Chart on Regional Comparison - North America
Data Table on Regional Comparison - North America

12.3.1 US - Market size and forecast 2025-2030

Chart on US - Market size and forecast 2025-2030 ($ million)
Data Table on US - Market size and forecast 2025-2030 ($ million)
Chart on US - Year-over-year growth 2025-2030 (%)
Data Table on US - Year-over-year growth 2025-2030 (%)

12.3.2 Canada - Market size and forecast 2025-2030

Chart on Canada - Market size and forecast 2025-2030 ($ million)
Data Table on Canada - Market size and forecast 2025-2030 ($ million)
Chart on Canada - Year-over-year growth 2025-2030 (%)
Data Table on Canada - Year-over-year growth 2025-2030 (%)

12.3.3 Mexico - Market size and forecast 2025-2030

Chart on Mexico - Market size and forecast 2025-2030 ($ million)
Data Table on Mexico - Market size and forecast 2025-2030 ($ million)
Chart on Mexico - Year-over-year growth 2025-2030 (%)
Data Table on Mexico - Year-over-year growth 2025-2030 (%)

12.4 Asia - Market size and forecast 2025-2030

Chart on Asia - Market size and forecast 2025-2030 ($ million)
Data Table on Asia - Market size and forecast 2025-2030 ($ million)
Chart on Asia - Year-over-year growth 2025-2030 (%)
Data Table on Asia - Year-over-year growth 2025-2030 (%)
Chart on Regional Comparison - Asia
Data Table on Regional Comparison - Asia

12.4.1 China - Market size and forecast 2025-2030

Chart on China - Market size and forecast 2025-2030 ($ million)
Data Table on China - Market size and forecast 2025-2030 ($ million)
Chart on China - Year-over-year growth 2025-2030 (%)
Data Table on China - Year-over-year growth 2025-2030 (%)

12.4.2 Japan - Market size and forecast 2025-2030

Chart on Japan - Market size and forecast 2025-2030 ($ million)
Data Table on Japan - Market size and forecast 2025-2030 ($ million)
Chart on Japan - Year-over-year growth 2025-2030 (%)
Data Table on Japan - Year-over-year growth 2025-2030 (%)

12.4.3 India - Market size and forecast 2025-2030

Chart on India - Market size and forecast 2025-2030 ($ million)
Data Table on India - Market size and forecast 2025-2030 ($ million)
Chart on India - Year-over-year growth 2025-2030 (%)
Data Table on India - Year-over-year growth 2025-2030 (%)

12.4.4 South Korea - Market size and forecast 2025-2030

Chart on South Korea - Market size and forecast 2025-2030 ($ million)
Data Table on South Korea - Market size and forecast 2025-2030 ($ million)
Chart on South Korea - Year-over-year growth 2025-2030 (%)
Data Table on South Korea - Year-over-year growth 2025-2030 (%)

12.4.5 Thailand - Market size and forecast 2025-2030

Chart on Thailand - Market size and forecast 2025-2030 ($ million)
Data Table on Thailand - Market size and forecast 2025-2030 ($ million)
Chart on Thailand - Year-over-year growth 2025-2030 (%)
Data Table on Thailand - Year-over-year growth 2025-2030 (%)

12.4.6 Indonesia - Market size and forecast 2025-2030

Chart on Indonesia - Market size and forecast 2025-2030 ($ million)
Data Table on Indonesia - Market size and forecast 2025-2030 ($ million)
Chart on Indonesia - Year-over-year growth 2025-2030 (%)
Data Table on Indonesia - Year-over-year growth 2025-2030 (%)

12.5 Europe - Market size and forecast 2025-2030

Chart on Europe - Market size and forecast 2025-2030 ($ million)
Data Table on Europe - Market size and forecast 2025-2030 ($ million)
Chart on Europe - Year-over-year growth 2025-2030 (%)
Data Table on Europe - Year-over-year growth 2025-2030 (%)
Chart on Regional Comparison - Europe
Data Table on Regional Comparison - Europe

12.5.1 Germany - Market size and forecast 2025-2030

Chart on Germany - Market size and forecast 2025-2030 ($ million)
Data Table on Germany - Market size and forecast 2025-2030 ($ million)
Chart on Germany - Year-over-year growth 2025-2030 (%)
Data Table on Germany - Year-over-year growth 2025-2030 (%)

12.5.2 UK - Market size and forecast 2025-2030

Chart on UK - Market size and forecast 2025-2030 ($ million)
Data Table on UK - Market size and forecast 2025-2030 ($ million)
Chart on UK - Year-over-year growth 2025-2030 (%)
Data Table on UK - Year-over-year growth 2025-2030 (%)

12.5.3 France - Market size and forecast 2025-2030

Chart on France - Market size and forecast 2025-2030 ($ million)
Data Table on France - Market size and forecast 2025-2030 ($ million)
Chart on France - Year-over-year growth 2025-2030 (%)
Data Table on France - Year-over-year growth 2025-2030 (%)

12.5.4 Italy - Market size and forecast 2025-2030

Chart on Italy - Market size and forecast 2025-2030 ($ million)
Data Table on Italy - Market size and forecast 2025-2030 ($ million)
Chart on Italy - Year-over-year growth 2025-2030 (%)
Data Table on Italy - Year-over-year growth 2025-2030 (%)

12.5.5 Spain - Market size and forecast 2025-2030

Chart on Spain - Market size and forecast 2025-2030 ($ million)
Data Table on Spain - Market size and forecast 2025-2030 ($ million)
Chart on Spain - Year-over-year growth 2025-2030 (%)
Data Table on Spain - Year-over-year growth 2025-2030 (%)

12.5.6 The Netherlands - Market size and forecast 2025-2030

Chart on The Netherlands - Market size and forecast 2025-2030 ($ million)
Data Table on The Netherlands - Market size and forecast 2025-2030 ($ million)
Chart on The Netherlands - Year-over-year growth 2025-2030 (%)
Data Table on The Netherlands - Year-over-year growth 2025-2030 (%)

12.6 Rest of World (ROW) - Market size and forecast 2025-2030

Chart on Rest of World (ROW) - Market size and forecast 2025-2030 ($ million)
Data Table on Rest of World (ROW) - Market size and forecast 2025-2030 ($ million)
Chart on Rest of World (ROW) - Year-over-year growth 2025-2030 (%)
Data Table on Rest of World (ROW) - Year-over-year growth 2025-2030 (%)
Chart on Regional Comparison - Rest of World (ROW)
Data Table on Regional Comparison - Rest of World (ROW)

12.6.1 Brazil - Market size and forecast 2025-2030

Chart on Brazil - Market size and forecast 2025-2030 ($ million)
Data Table on Brazil - Market size and forecast 2025-2030 ($ million)
Chart on Brazil - Year-over-year growth 2025-2030 (%)
Data Table on Brazil - Year-over-year growth 2025-2030 (%)

12.6.2 Saudi Arabia - Market size and forecast 2025-2030

Chart on Saudi Arabia - Market size and forecast 2025-2030 ($ million)
Data Table on Saudi Arabia - Market size and forecast 2025-2030 ($ million)
Chart on Saudi Arabia - Year-over-year growth 2025-2030 (%)
Data Table on Saudi Arabia - Year-over-year growth 2025-2030 (%)

12.6.3 South Africa - Market size and forecast 2025-2030

Chart on South Africa - Market size and forecast 2025-2030 ($ million)
Data Table on South Africa - Market size and forecast 2025-2030 ($ million)
Chart on South Africa - Year-over-year growth 2025-2030 (%)
Data Table on South Africa - Year-over-year growth 2025-2030 (%)

12.6.4 Turkey - Market size and forecast 2025-2030

Chart on Turkey - Market size and forecast 2025-2030 ($ million)
Data Table on Turkey - Market size and forecast 2025-2030 ($ million)
Chart on Turkey - Year-over-year growth 2025-2030 (%)
Data Table on Turkey - Year-over-year growth 2025-2030 (%)

12.6.5 UAE - Market size and forecast 2025-2030

Chart on UAE - Market size and forecast 2025-2030 ($ million)
Data Table on UAE - Market size and forecast 2025-2030 ($ million)
Chart on UAE - Year-over-year growth 2025-2030 (%)
Data Table on UAE - Year-over-year growth 2025-2030 (%)

12.6.6 Argentina - Market size and forecast 2025-2030

Chart on Argentina - Market size and forecast 2025-2030 ($ million)
Data Table on Argentina - Market size and forecast 2025-2030 ($ million)
Chart on Argentina - Year-over-year growth 2025-2030 (%)
Data Table on Argentina - Year-over-year growth 2025-2030 (%)

12.6.7 Chile - Market size and forecast 2025-2030

Chart on Chile - Market size and forecast 2025-2030 ($ million)
Data Table on Chile - Market size and forecast 2025-2030 ($ million)
Chart on Chile - Year-over-year growth 2025-2030 (%)
Data Table on Chile - Year-over-year growth 2025-2030 (%)

12.6.8 Australia - Market size and forecast 2025-2030

Chart on Australia - Market size and forecast 2025-2030 ($ million)
Data Table on Australia - Market size and forecast 2025-2030 ($ million)
Chart on Australia - Year-over-year growth 2025-2030 (%)
Data Table on Australia - Year-over-year growth 2025-2030 (%)

12.7 Market opportunity by geography

Market opportunity by geography ($ million)
Data Tables on Market opportunity by geography ($ million)

13. Drivers, Challenges, and Opportunity

13.1 Market drivers

Integration of AI and ML in diagnostic workflows
Rising demand for dental implants and aesthetic dentistry
Increasing geriatric population and prevalence of oral disorders

13.2 Market challenges

High initial capital expenditure and financial barriers
Regulatory complexity and evolving compliance standards
Workforce readiness and technical training requirements

13.3 Impact of drivers and challenges

Impact of drivers and challenges in 2025 and 2030

13.4 Market opportunities

Proliferation of AI driven diagnostic automation and decision support
Shift toward point of care miniaturization and portable imaging solutions
Evolution toward comprehensive 3D digital workflows and same day dentistry

14. Competitive Landscape

14.1 Overview

14.2

Overview on criticality of inputs and factors of differentiation

14.3 Landscape disruption

Overview on factors of disruption

14.4 Industry risks

Impact of key risks on business

15. Competitive Analysis

15.1 Companies profiled

Companies covered

15.2 Company ranking index

15.3 Market positioning of companies

Matrix on companies position and classification

15.4 3Shape AS

3Shape AS - Overview
3Shape AS - Product / Service
3Shape AS - Key offerings
SWOT

15.5 ACTEON Group

ACTEON Group - Overview
ACTEON Group - Product / Service
ACTEON Group - Key offerings
SWOT

15.6 Align Technology Inc.

Align Technology Inc. - Overview
Align Technology Inc. - Business segments
Align Technology Inc. - Key offerings
Align Technology Inc. - Segment focus
SWOT

15.7 Asahi Roentgen Industry Co Ltd

Asahi Roentgen Industry Co Ltd - Overview
Asahi Roentgen Industry Co Ltd - Product / Service
Asahi Roentgen Industry Co Ltd - Key offerings
SWOT

15.8 Carestream Dental LLC

Carestream Dental LLC - Overview
Carestream Dental LLC - Product / Service
Carestream Dental LLC - Key offerings
SWOT

15.9 Dentsply Sirona Inc.

Dentsply Sirona Inc. - Overview
Dentsply Sirona Inc. - Business segments
Dentsply Sirona Inc. - Key offerings
Dentsply Sirona Inc. - Segment focus
SWOT

15.10 Durr Dental SE

Durr Dental SE - Overview
Durr Dental SE - Product / Service
Durr Dental SE - Key offerings
SWOT

15.11 Envista Holdings Corp.

Envista Holdings Corp. - Overview
Envista Holdings Corp. - Business segments
Envista Holdings Corp. - Key offerings
Envista Holdings Corp. - Segment focus
SWOT

15.12 J. Morita Corp.

J. Morita Corp. - Overview
J. Morita Corp. - Product / Service
J. Morita Corp. - Key offerings
SWOT

15.13 Medit Corp.

Medit Corp. - Overview
Medit Corp. - Product / Service
Medit Corp. - Key offerings
SWOT

15.14 Midmark Corp.

Midmark Corp. - Overview
Midmark Corp. - Product / Service
Midmark Corp. - Key offerings
SWOT

15.15 Owandy Radiology

Owandy Radiology - Overview
Owandy Radiology - Product / Service
Owandy Radiology - Key offerings
SWOT

15.16 Planmeca Oy

Planmeca Oy - Overview
Planmeca Oy - Product / Service
Planmeca Oy - Key offerings
SWOT

15.17 PreXion Inc.

PreXion Inc. - Overview
PreXion Inc. - Product / Service
PreXion Inc. - Key offerings
SWOT

15.18 Yoshida Dental Mfg Co Ltd

Yoshida Dental Mfg Co Ltd - Overview
Yoshida Dental Mfg Co Ltd - Product / Service
Yoshida Dental Mfg Co Ltd - Key offerings
SWOT

16. Appendix

16.1 Scope of the report

Market definition
Objectives
Notes and caveats

16.2 Inclusions and exclusions checklist

Inclusions checklist
Exclusions checklist

16.3 Currency conversion rates for US$

16.4 Research methodology

16.5 Data procurement

Information sources

16.6 Data validation

16.7 Validation techniques employed for market sizing

16.8 Data synthesis

16.9 360 degree market analysis

16.10 List of abbreviations

Research Methodology

Technavio presents a detailed picture of the market by way of study, synthesis, and summation of data from multiple sources. The analysts have presented the various facets of the market with a particular focus on identifying the key industry influencers. The data thus presented is comprehensive, reliable, and the result of extensive research, both primary and secondary.

INFORMATION SOURCES

Primary sources

  • Manufacturers and suppliers
  • Channel partners
  • Industry experts
  • Strategic decision makers

Secondary sources

  • Industry journals and periodicals
  • Government data
  • Financial reports of key industry players
  • Historical data
  • Press releases

DATA ANALYSIS

Data Synthesis

  • Collation of data
  • Estimation of key figures
  • Analysis of derived insights

Data Validation

  • Triangulation with data models
  • Reference against proprietary databases
  • Corroboration with industry experts

REPORT WRITING

Qualitative

  • Market drivers
  • Market challenges
  • Market trends
  • Five forces analysis

Quantitative

  • Market size and forecast
  • Market segmentation
  • Geographical insights
  • Competitive landscape

Interested in this report?

Get your sample now to see our research methodology and insights!

Download Now

Frequently Asked Questions

Dental Imaging market growth will increase by USD 1891.3 million during 2026-2030.

The Dental Imaging market is expected to grow at a CAGR of 7.7% during 2026-2030.

Dental Imaging market is segmented by End-user (Dental clinics, Hospitals and diagnostic centers, Dental research institutes, Others) Application (Diagnostic, Cosmetic, Forensic) Type (Intraoral imaging, Extraoral imaging, Cone beam computed tomography, 3D dental imaging, Others)

3Shape AS, ACTEON Group, Air Techniques Inc., Align Technology Inc., Asahi Roentgen Industry Co Ltd, Carestream Dental LLC, Dentsply Sirona Inc., Durr Dental SE, Envista Holdings Corp., GENORAY Co. Ltd., J. Morita Corp., Medit Corp., Midmark Corp., Owandy Radiology, Planmeca Oy, PreXion Inc., Ray Co Ltd, Shining 3D Tech Co Ltd., Xline SRL, Yoshida Dental Mfg Co Ltd are a few of the key vendors in the Dental Imaging market.

North America will register the highest growth rate of 37.9% among the other regions. Therefore, the Dental Imaging market in North America is expected to garner significant business opportunities for the vendors during the forecast period.

US, Canada, Mexico, China, Japan, India, South Korea, Thailand, Indonesia, Germany, UK, France, Italy, Spain, The Netherlands, Brazil, Saudi Arabia, South Africa, Turkey, UAE, Argentina, Chile, Australia

  • Integration of AI and ML in diagnostic workflows is the driving factor this market.

The Dental Imaging market vendors should focus on grabbing business opportunities from the End-user segment as it accounted for the largest market share in the base year.
RIA - Research AI Assistant
Ask RIA