
DevOps Tools Market Size 2025-2029
The DevOps tools market size is forecast to increase by USD 13.9 billion at a CAGR of 16.4% between 2024 and 2029.
- The market is experiencing significant growth due to several key trends. The increasing adoption of cloud computing is driving market growth as organizations seek for the automation of their IT infrastructure and applications in the cloud. New product launches by companies are providing innovative solutions to address the complexities of DevOps practices. However, the shortage of skilled professionals with expertise in DevOps tools and practices poses a challenge for organizations looking to implement these solutions. As businesses continue to prioritize agility and efficiency in their IT operations, the market is expected to continue its growth trajectory. Organizations in North America are particularly active in adopting DevOps practices, making this region a major market for DevOps tools.
What will be the size of the DevOps Tools Market during the forecast period?

- The market is experiencing strong growth, driven by the increasing adoption of Agile methodologies and the shift towards cloud-based infrastructure. Businesses are prioritizing automation and collaboration to enhance software delivery, improve IT service management, and ensure compliance with various regulations. DevOps tools are essential for managing project workflows, enabling continuous testing, and facilitating change management in a rapidly evolving digital workplace. Artificial Intelligence (AI) and Machine Learning (ML) are increasingly integrated into DevOps tools to optimize cloud cost, enhance application monitoring, and support data analytics. Low-code and no-code development platforms are gaining traction, enabling faster development cycles and easier integration of new technologies.
- Moreover, hybrid cloud, serverless computing, and edge computing are also driving market growth, as businesses seek to balance the benefits of cloud security and cybersecurity with the need for business agility and online transaction processing. DevOps tools are also critical for managing the risks associated with cloud migration, disaster recovery, and ITIL framework implementation. Collaboration tools, API management, and service management platforms are essential for effective communication and coordination among development, operations, and other stakeholders. Compliance automation, governance, and continuous testing are also key areas of focus, as businesses seek to maintain security and reliability while delivering high-quality software at speed.
How is this DevOps Tools Industry segmented and which is the largest segment?
The DevOps tools industry research report provides comprehensive data (region-wise segment analysis), with forecasts and estimates in "USD billion" for the period 2025-2029, as well as historical data from 2019-2023 for the following segments.
- End-user
- IT
- BFSI
- Telecommunication
- Retail
- Others
- Deployment
- On-premises
- Cloud
- Geography
- North America
- Canada
- US
- Europe
- Germany
- UK
- France
- APAC
- China
- India
- Japan
- South America
- Brazil
- Middle East and Africa
- North America
By End-user Insights
- The IT segment is estimated to witness significant growth during the forecast period.
The market is experiencing significant growth due to increasing adoption by the IT sector. IT companies are leveraging these tools to accelerate software development, improve application performance, and enhance customer experiences. The trend toward cloud-native applications, automation, and continuous delivery pipelines is driving demand for advanced DevOps practices and technologies. Software development firms, IT service providers, and tech startups are the primary users within the IT sector. DevOps tools enable agile and efficient development processes, ensuring interoperability and standardization across the software development ecosystem. Cloud technologies, including cloud hosting and cloud services, are integral to DevOps strategies, offering flexibility and scalability.

Get a glance at the DevOps Tools Industry report of share of various segments Request Free Sample
The IT segment was valued at USD 2.16 billion in 2019 and showed a gradual increase during the forecast period.
Regional Analysis
- North America is estimated to contribute 34% to the growth of the global market during the forecast period.
Technavio's analysts have elaborately explained the regional trends and drivers that shape the market during the forecast period.

For more insights on the market share of various regions, Request Free Sample
The market in North America, with a significant focus on the US, is experiencing substantial growth due to substantial investments in digital transformation. In 2025, US businesses are projected to invest over USD1 trillion in modernizing their operations, driving the adoption of advanced technologies and practices. This trend is evident in the retail sector, where e-commerce sales reached USD300.1 billion in Q3 2024, marking a 20% year-over-year increase. DevOps tools, including automation, configuration management, and orchestration, are essential components of digital transformation. These tools facilitate agile development, continuous delivery, and cloud strategies, enabling organizations to deliver applications faster and more efficiently. DevOps solutions also support standardization, compliance, and security, ensuring customer satisfaction and data privacy. Additionally, DevOps tools are integral to microservice architecture, containerization, and Kubernetes, which are increasingly popular in cloud-native applications. The market for DevOps tools is expected to continue growing, driven by the flexibility and efficiency they offer in the face of digital transformation.
Market Dynamics
Our market researchers analyzed the data with 2024 as the base year, along with the key drivers, trends, and challenges. A holistic analysis of drivers will help companies refine their marketing strategies to gain a competitive advantage.
What are the key market drivers leading to the rise in the adoption of DevOps Tools Industry?
Increased adoption of cloud computing is the key driver of the market.
- The market is experiencing significant growth, driven by the increasing adoption of agile methodologies and cloud technologies. Agile development and system administration enable faster release cycles and improved collaboration between developers, designers, and operations teams. Version control systems and configuration management tools are essential DevOps tools that facilitate these processes, ensuring standardization and interoperability. Cloud hosting and containerization have become integral to DevOps strategies, providing flexibility and automation for software deployment and scaling. Container services like Kubernetes and orchestration tools enable the deployment and management of microservices and cloud-native applications. DevOps teams require continuous delivery tools to ensure seamless updates and integration testing, while API tools streamline communication between services.
- In addition, cloud strategies, including hybrid integration and on-premises deployment, offer organizations the flexibility to choose the best solution for their needs. Security and compliance are critical concerns, with DevOps teams requiring tools to ensure data privacy and security in cloud environments. DevOps tools are not limited to the IT & telecommunication industry but are also being adopted in manufacturing, retail, finance, insurance, and other sectors. The flexibility and automation offered by DevOps tools are essential for digital transformation and the development of modern applications, such as SaaS and monolithic architecture. DevOps training and continuous delivery are crucial for organizations to effectively implement these tools and maximize their benefits.
What are the market trends shaping the DevOps Tools Industry?
New launches by companies is the upcoming market trend.
- The market is experiencing significant growth due to the increasing adoption of Agile methodologies and cloud technologies in various industries, including IT & telecommunication, manufacturing, retail, finance, and insurance. DevOps tools enable cooperation between developers, designers, and operations teams, facilitating continuous integration, delivery, and deployment of applications. These tools provide automation of various processes such as version control, configuration management, API management, and orchestration, ensuring flexibility and standardization in development cycles. Cloud services and containerization have become essential components of DevOps strategies, with Kubernetes gaining popularity for container orchestration and cloud-native applications. DevOps solutions offer life cycle support for on-premises and cloud environments, ensuring data security and compliance with regulatory requirements.
- Moreover, open-source libraries and tools play a crucial role in the DevOps ecosystem, providing interoperability and ease of integration. DevOps training and continuous delivery tools are essential for organizations undergoing digital transformation, enabling faster release processes and improved customer experience. New technologies, such as artificial intelligence and machine learning, are being integrated into DevOps tools to enhance automation and streamline processes. The market is witnessing a shift towards hybrid integration and on-premises deployment, with SaaS and container services becoming increasingly popular. DevOps teams are focusing on production support, updates, and integration testing to ensure seamless software deployment and maintain high levels of client satisfaction.
What challenges does the DevOps Tools Industry face during its growth?
Shortage of skilled professionals is a key challenge affecting the industry growth.
- The market is experiencing significant growth due to the increasing adoption of Agile methodologies, such as Scrum and Lean, in various industries including IT & telecommunication, manufacturing, retail, finance, and insurance. DevOps tools enable closer cooperation between developers and operations teams, facilitating faster software deployment, integration testing, and updates. These tools also support cloud technologies, including containerization, Kubernetes, and cloud services, which are essential for digital transformation and the development of cloud-native applications. DevOps tools provide automation and standardization, improving efficiency and reducing errors. They offer flexibility, allowing for continuous delivery and integration, and support for microservice architecture. API tools and orchestration are critical components, ensuring seamless communication between services and applications.
- In addition, DevOps tools are essential for organizations undergoing cloud strategies, whether in the cloud or on-premises. They offer life cycle support, ensuring security, compliance, and data privacy. DevOps teams require a range of organizational tools to manage their development cycles effectively, from version control to configuration management. The market dynamics are driven by the need for agility and flexibility in response to changing customer expectations and the increasing importance of mobile transactions. Artificial intelligence and machine learning are also playing an increasingly significant role, improving customer experience and streamlining processes. Despite these benefits, the market faces challenges, including the shortage of skilled professionals with expertise in both development and operations.
Exclusive Customer Landscape
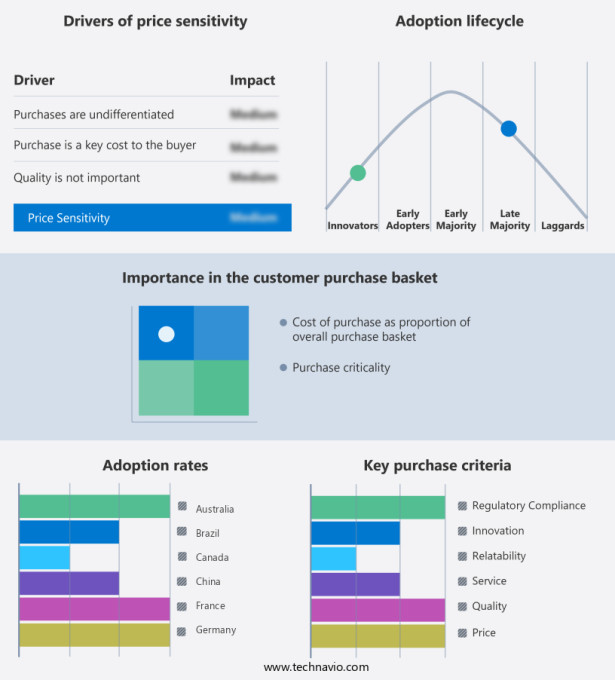
The market forecasting report includes the adoption lifecycle of the market, covering from the innovator's stage to the laggard's stage. It focuses on adoption rates in different regions based on penetration. Furthermore, the market report also includes key purchase criteria and drivers of price sensitivity to help companies evaluate and develop their market growth analysis strategies.
Customer Landscape
Key Companies & Market Insights
Companies are implementing various strategies, such as strategic alliances, market forecast, partnerships, mergers and acquisitions, geographical expansion, and product/service launches, to enhance their presence in the industry.
Amazon.com Inc. - The company offers DevOps tools such as AWS Developer Tools that securely store applications source code and automatically build, test, and deploy application to AWS or on-premises environment.
The industry research and growth report includes detailed analyses of the competitive landscape of the market and information about key companies, including:
- Atlassian Corp.
- BDY PSA
- BMC Software Inc.
- Broadcom Inc.
- Circle Internet Services Inc.
- Cisco Systems Inc.
- CloudBees Inc.
- Datadog Inc.
- Docker Inc.
- Dynatrace Inc.
- GITLAB INC.
- Harness Inc.
- Huawei Cloud Computing Technologies Co. Ltd.
- International Business Machines Corp.
- Microsoft Corp.
- Octopus Deploy
- Oracle Corp.
- Perforce Software Inc.
- Progress Software Corp.
Qualitative and quantitative analysis of companies has been conducted to help clients understand the wider business environment as well as the strengths and weaknesses of key industry players. Data is qualitatively analyzed to categorize companies as pure play, category-focused, industry-focused, and diversified; it is quantitatively analyzed to categorize companies as dominant, leading, strong, tentative, and weak.
Research Analyst Overview
DevOps tools have become an integral part of modern IT infrastructure, enabling organizations to streamline their software development processes and deliver high-quality applications faster. These tools facilitate collaboration between developers and operations teams, ensuring that software is deployed efficiently and effectively. The market is characterized by a strong focus on automation, standardization, and flexibility. Agile system administration and continuous delivery are key components of this market, with organizations seeking to improve customer satisfaction by reducing development cycles and enhancing the overall IT & telecommunication experience. Cloud technologies, including cloud hosting and cloud services, have significantly impacted the DevOps landscape.
Moreover, containerization, container services, and orchestration tools like Kubernetes have become popular choices for deploying cloud-native applications and managing complex IT environments. DevOps tools are not limited to the tech industry, but are also being adopted in manufacturing, finance, insurance, retail, and other sectors. In the banking sector, for instance, DevOps tools are used to streamline software deployment and ensure compliance with regulatory requirements. DevOps solutions are available in various forms, including on-premises, SaaS, and hybrid integration. Open-source libraries and tools have played a crucial role in the DevOps market, providing cost-effective solutions and fostering innovation. Security and compliance are critical considerations in the DevOps landscape.
In addition, DevOps teams must ensure data privacy and security throughout the software development life cycle, from design to production. DevOps tools provide features like API tools, configuration management tools, and interoperability to help organizations meet these challenges. DevOps tools also support remote working and collaboration, enabling teams to work together effectively even when physically apart. This has become increasingly important in the current business climate, where remote work has become the norm for many organizations. The DevOps market is constantly evolving, with new technologies and trends emerging regularly. Continuous delivery tools, for instance, enable organizations to automate their release processes and deliver updates more frequently.
Furthermore, microservices and microservice architectures are also gaining popularity, providing flexibility and scalability for modern applications. DevOps tools are essential for organizations undergoing digital transformation, helping them adapt to changing business needs and customer demands. They enable organizations to respond quickly to market trends and deliver high-quality software that meets the evolving needs of their customers. Therefore, the market is a dynamic and innovative space, driven by a need for automation, standardization, and flexibility. DevOps tools are essential for organizations seeking to streamline their software development processes, improve customer satisfaction, and stay competitive in today's fast-paced business environment.
|
DevOps Tools Market Scope |
|
|
Report Coverage |
Details |
|
Page number |
213 |
|
Base year |
2024 |
|
Historic period |
2019-2023 |
|
Forecast period |
2025-2029 |
|
Growth momentum & CAGR |
Accelerate at a CAGR of 16.4% |
|
Market growth 2025-2029 |
USD 13.9 billion |
|
Market structure |
Fragmented |
|
YoY growth 2024-2025(%) |
15.0 |
|
Key countries |
US, India, UK, Germany, Australia, China, Canada, France, Japan, and Brazil |
|
Competitive landscape |
Leading Companies, Market Positioning of Companies, Competitive Strategies, and Industry Risks |
What are the Key Data Covered in this DevOps Tools Market Research and Growth Report?
- CAGR of the DevOps Tools industry during the forecast period
- Detailed information on factors that will drive the DevOps Tools growth and forecasting between 2025 and 2029
- Precise estimation of the size of the market and its contribution of the industry in focus to the parent market
- Accurate predictions about upcoming growth and trends and changes in consumer behaviour
- Growth of the market across North America, Europe, APAC, South America, and Middle East and Africa
- Thorough analysis of the market's competitive landscape and detailed information about companies
- Comprehensive analysis of factors that will challenge the devops tools market growth of industry companies
We can help! Our analysts can customize this devops tools market research report to meet your requirements.