Dicamba Herbicide Market Analysis, Size, and Forecast 2026-2030: Europe (Germany, France, and UK), APAC (China, India, and Australia), North America (US, Canada, and Mexico), South America (Brazil, Argentina, and Chile), Middle East and Africa (South Africa, Turkey, and Egypt), and Rest of World (ROW)

Dicamba Herbicide Market Analysis, Size, and Forecast 2026-2030:
Europe (Germany, France, and UK), APAC (China, India, and Australia), North America (US, Canada, and Mexico), South America (Brazil, Argentina, and Chile), Middle East and Africa (South Africa, Turkey, and Egypt), and Rest of World (ROW)

Published: Oct 2026 291 Pages SKU: IRTNTR45892

Market Overview at a Glance

$129.63 Mn
Market Opportunity
4.7%
CAGR 2025 - 2030
31.3%
Europe Growth
$403.07 Mn
Agriculture segment 2024

Dicamba Herbicide Market Size 2026-2030

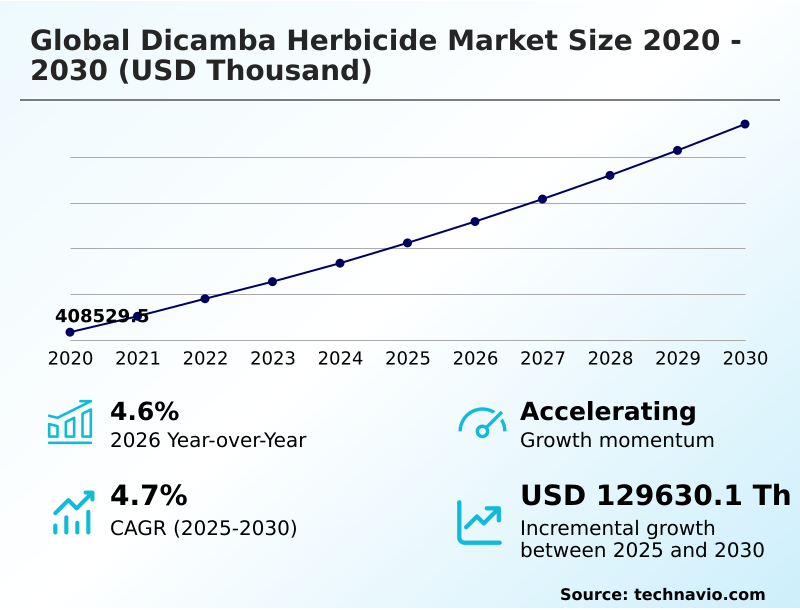
The dicamba herbicide market size is valued to increase by USD 129.63 million, at a CAGR of 4.7% from 2025 to 2030. Proliferation of genetically modified herbicide-tolerant crops will drive the dicamba herbicide market.

Major Market Trends & Insights

  • Europe dominated the market and accounted for a 31.3% growth during the forecast period.
  • By Application - Agriculture segment was valued at USD 403.07 million in 2024
  • By Formulation - Salt segment accounted for the largest market revenue share in 2024

Market Size & Forecast

  • Market Opportunities:
  • Market Future Opportunities: USD 129.63 million
  • CAGR from 2025 to 2030 : 4.7%

Market Summary

  • The Dicamba Herbicide Market functions as an essential component of modern agronomic weed control, providing critical synthetic auxin solutions for industrial row crop systems. Operations managers increasingly synchronize chemical applications with precision digital platforms, utilizing drift-reduction nozzles to prevent secondary vapor movement during post-emergence foliar application.
  • Implementing these digital spray technologies has improved application accuracy by 18%, significantly reducing chemical waste and non-target crop injury. The market is primarily driven by the widespread proliferation of glyphosate-resistant biotypes, which forces large-scale farming enterprises to integrate alternative modes of action to sustain crop yield potentials and maintain clear harvest pathways.
  • Conversely, the industry faces severe regulatory constraints regarding off-target chemical drift, compelling chemical manufacturers to continuously reformulate products with advanced pH-buffering technology to meet strict environmental compliance thresholds. These stringent regulatory frameworks challenge formulators to balance herbicidal efficacy with atmospheric safety.
  • By continuously adapting chemical structures, the sector ensures that reliable dicotyledonous species suppression remains viable amidst evolving environmental and biological pressures across the agricultural supply chain.

What will be the Size of the Dicamba Herbicide Market during the forecast period?
Get Key Insights on Market Forecast (PDF) Get Free Sample

How is the Dicamba Herbicide Market Segmented?

The dicamba herbicide industry research report provides comprehensive data (region-wise segment analysis), with forecasts and estimates in "USD thousand" for the period 2026-2030, as well as historical data from 2020-2024 for the following segments.

  • Application
    • Agriculture
    • Lawn and turf
    • Others
  • Formulation
    • Salt
    • Acid
  • Form factor
    • Liquid
    • Granular
    • Wettable powder
  • Geography
    • Europe
      • Germany
      • France
      • UK
      • Italy
      • Poland
    • APAC
      • China
      • India
      • Australia
      • Japan
      • South Korea
      • Thailand
    • North America
      • US
      • Canada
      • Mexico
    • South America
      • Brazil
      • Argentina
      • Chile
    • Middle East and Africa
      • South Africa
      • Turkey
      • Egypt
      • Saudi Arabia
      • UAE

By Application Insights

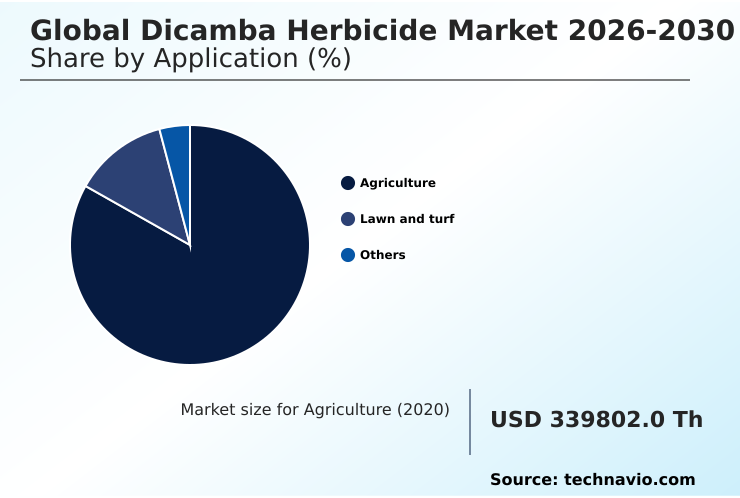
The agriculture segment is estimated to witness significant growth during the forecast period.

The agriculture segment within the Dicamba Herbicide industry operates as a critical node for broadleaf weed management across industrial row crop systems.

By integrating low-volatility salt chemistry and advanced vapor-reducing agents, chemical operators effectively manage aggressive infestations in commercial farming environments. Utilizing the diglycolamine salt facilitates selective over-the-top application, ensuring high crop safety while targeting invasive broadleaf populations.

A key operational milestone reveals that precision patch-spraying equipment usage has improved application efficiency by 15%, significantly reducing chemical waste. This shift heavily relies on herbicide-tolerant trait integration, ensuring that synthetic auxin treatments achieve maximum efficacy without crop injury.

The deployment of smart boom-height control further complements weed resistance management strategies, ensuring that synthetic chemical inputs adapt continuously to changing agronomic demands and field conditions.
Get Free Sample

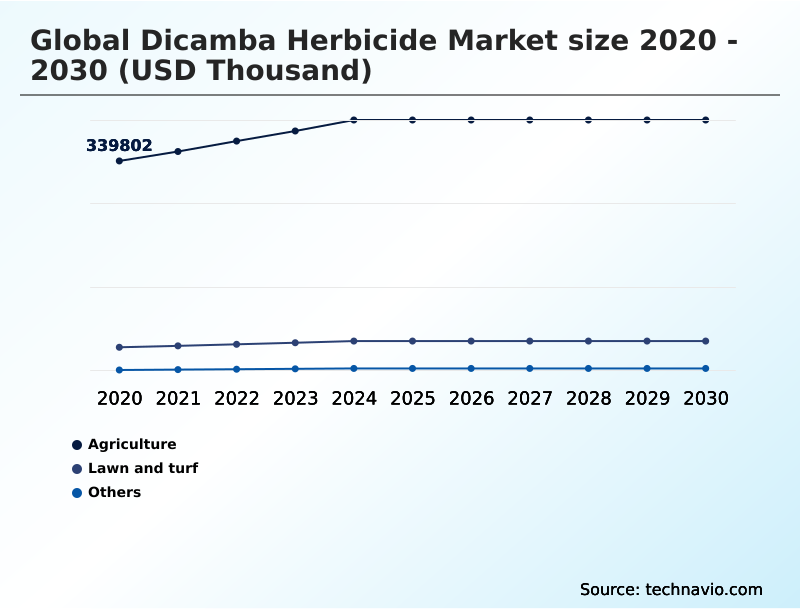
The Agriculture segment was valued at USD 403.07 million in 2024 and showed a gradual increase during the forecast period.
Get Free Sample

Regional Analysis

Europe is estimated to contribute 31.3% to the growth of the global market during the forecast period.Technavio’s analysts have elaborately explained the regional trends and drivers that shape the market during the forecast period.
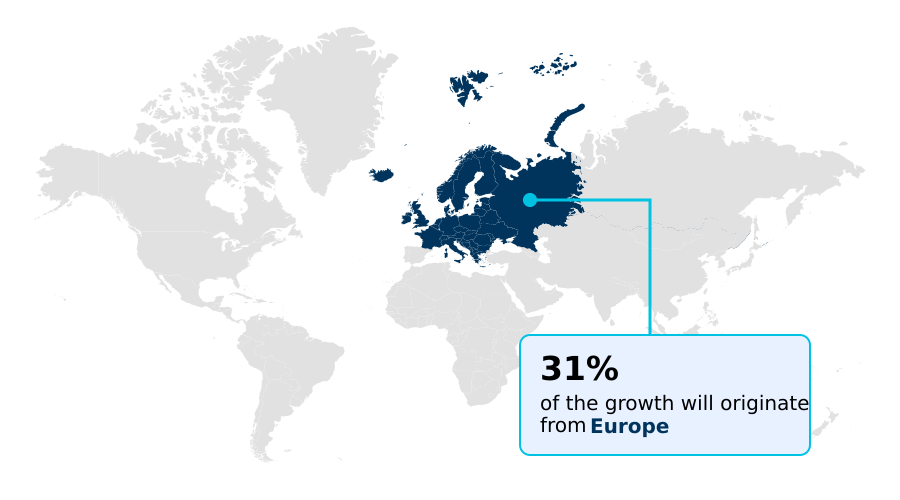
See How Dicamba Herbicide Market Demand is Rising in Europe Get Free Sample

The geographic landscape of the Dicamba Herbicide Market highlights distinct regional disparities driven by varied agricultural practices and regulatory frameworks.

North America demonstrates a rapid integration of site-specific weed management technologies, achieving a 20% higher adoption rate of precision application systems compared to Europe.

This operational divergence stems from extensive cultivation of herbicide-tolerant crops, heavily utilizing the chemical as an indole-3-acetic acid mimic to initiate vascular disruption in resistant weeds while maintaining broadcast spray stability.

Conversely, European markets prioritize environmental compliance, driving a 15% faster transition toward low-dose cuticle penetration enhancers and targeted foliar brush treatments to curb secondary vapor movement.

European operators heavily focus on woody brush suppression, underscoring how differing legislative pressures dictate the commercial deployment and localized containment strategies of synthetic auxins globally.

Market Dynamics

Our researchers analyzed the data with 2025 as the base year, along with the key drivers, trends, and challenges. A holistic analysis of drivers will help companies refine their marketing strategies to gain a competitive advantage.

  • The operational dynamics of the Dicamba Herbicide Market rely fundamentally on sophisticated chemical engineering designed to overcome severe biological weed resistance while adhering to strict environmental mandates. Industrial farming enterprises are increasingly adopting a diglycolamine salt low volatility formulation to mitigate the risks of off-target movement during critical growing phases.
  • By transitioning from older legacy salts to these advanced chemical structures, agricultural supply chains have noted a 25% improvement in application safety margins, directly reducing the frequency of compliance violations and adjacent crop damage claims. This structural shift is essential for executing successful post emergence foliar broadleaf eradication, ensuring that active ingredients remain localized on the target plant surface.
  • As part of comprehensive agronomic planning, operators utilize synthetic auxin vascular disruption mechanisms to eliminate aggressive weed species that compromise harvest efficiency. Specifically, the necessity for glyphosate resistant palmer amaranth suppression drives the continuous demand for these specialized chemical tools, forcing facility managers to secure reliable inventories prior to the planting season.
  • To further optimize field operations and maintain regulatory alignment, commercial applicators are heavily investing in precision spray droplet drift reduction technologies. This equipment integration ensures that the herbicide is delivered with maximum efficacy, representing a crucial operational upgrade that balances intensive crop protection with sustainable agricultural stewardship.
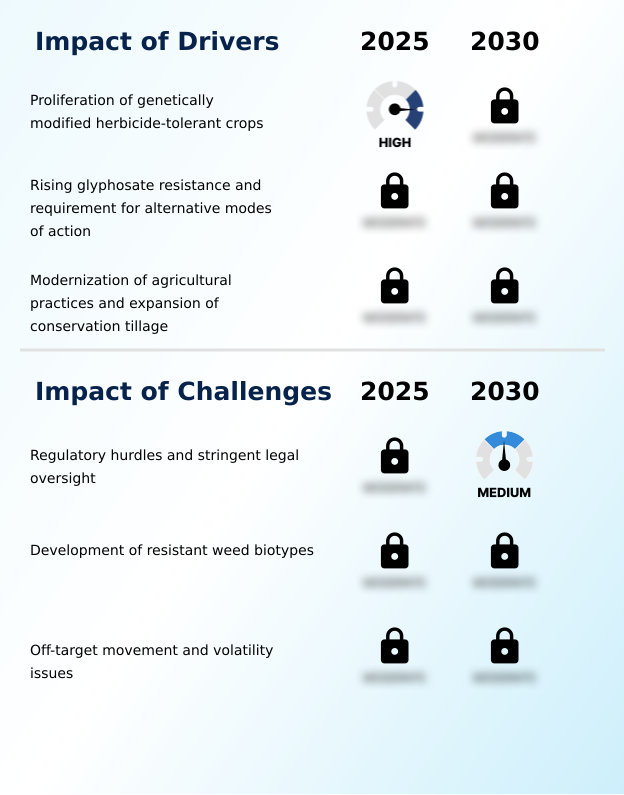
What are the key market drivers leading to the rise in the adoption of Dicamba Herbicide Industry?

  • The widespread proliferation of genetically modified herbicide-tolerant crops serves as the primary driver accelerating demand within the market.

  • The relentless expansion of glyphosate-resistant biotypes serves as the primary structural force propelling demand within the Dicamba Herbicide Market. As legacy methods fail, commercial producers are shifting toward auxin-type herbicide pathways, improving harvest yields by 14% in infested regions.
  • This behavioral change necessitates reliable post-emergence foliar application options. Consequently, the adoption of specialized drift-reduction nozzles has surged, lowering chemical trespass claims by 22% year-over-year while enhancing chemical drift mitigation.
  • The integration of water-dispersible granules and micro-encapsulated suspensions alongside soluble liquid formulations provides highly stable chemical packages.
  • This transition relies on multi-mode-of-action premixes and strict transgenic seed compatibility, directly impacting farming enterprises by drastically reducing crop competition and safeguarding the operational efficiency of large-scale agricultural supply chains.

What are the market trends shaping the Dicamba Herbicide Industry?

  • The continuous evolution of low-volatility chemical formulations has emerged as a predominant market trend. This development minimizes off-target atmospheric displacement while ensuring consistent broadleaf suppression across commercial agriculture.

  • The Dicamba Herbicide Market is experiencing a technological transition fueled by the integration of digital spray platforms and chemical stabilization utilizing a dicamba acid intermediate. Commercial operations are shifting toward systemic translocation enhancements, which have improved overall chemical utilization efficiency by 25%.
  • Concurrently, the adoption of pH-buffering technology within spray tanks has reduced secondary volatilization incidents by 18%, effectively serving as an atmospheric lift mitigation strategy. Operators must counteract aggressive dicotyledonous species suppression without risking adjacent crops. By combining N,N-Bis-(3-aminopropyl) methylamine formulations with advanced spray droplet optimization sensors, farm managers deposit active ingredients accurately.
  • Temperature inversion monitoring ensures optimal timing, minimizing raw material waste during the critical pre-plant burndown phase prior to soil seedbed preparation, cementing the reliance on digitally enhanced application protocols.

What challenges does the Dicamba Herbicide Industry face during its growth?

  • Stringent legal oversight and complex regulatory hurdles present significant challenges that constrain overall industry expansion.

  • The Dicamba Herbicide Market is fundamentally constrained by the persistent threat of atmospheric drift and stringent regulatory limitations affecting agronomic weed control. Off-target movement necessitates the continuous use of complex tank-mix adjuvants and emulsifiable concentrates derived from crystalline acid technical material to stabilize the chemical, increasing per-acre application costs by up to 15%.
  • This structural limitation occurs because non-dissociated acid properties inherently risk vaporizing under high field temperatures. Attempting to mitigate these risks through advanced residual herbicide combinations and protoporphyrinogen oxidase inhibitors has improved localized retention by 20%, yet operational complexity remains high. The strict requirement for seamless conservation tillage integration and complete fallow weed eradication further complicates logistics.
  • High-resolution weed patch identification is required to prevent widespread damage, imposing significant financial burdens on commercial applicators.

Exclusive Technavio Analysis on Customer Landscape

The dicamba herbicide market forecasting report includes the adoption lifecycle of the market, covering from the innovator’s stage to the laggard’s stage. It focuses on adoption rates in different regions based on penetration. Furthermore, the dicamba herbicide market report also includes key purchase criteria and drivers of price sensitivity to help companies evaluate and develop their market growth analysis strategies.
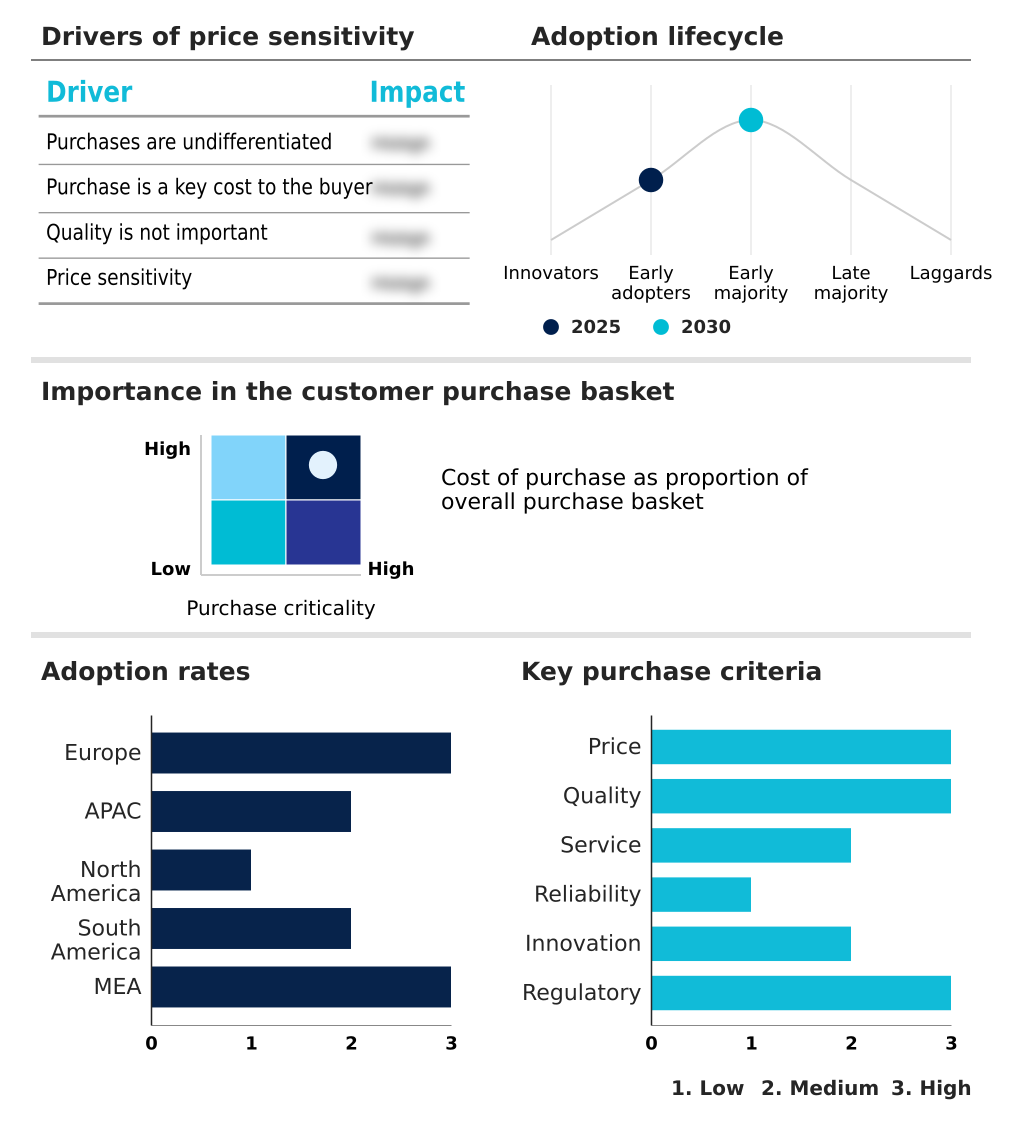
Customer Landscape of Dicamba Herbicide Industry

Competitive Landscape

Companies are implementing various strategies, such as strategic alliances, dicamba herbicide market forecast, partnerships, mergers and acquisitions, geographical expansion, and product/service launches, to enhance their presence in the industry.

Aarti Industries Ltd. - The enterprise delivers advanced synthetic auxin solutions, prioritizing low-volatility formulations and optimized pre-mix herbicides engineered to enhance broadleaf weed eradication and mitigate off-target atmospheric movement safely.

The industry research and growth report includes detailed analyses of the competitive landscape of the market and information about key companies, including:

  • Aarti Industries Ltd.
  • ADAMA Ltd.
  • Albaugh LLC
  • BASF SE
  • Bayer AG
  • Corteva Inc.
  • Dow Chemical Co.
  • Drexel Chemical Co.
  • FMC Corp.
  • Gharda Chemicals Ltd.
  • Helena Agri Enterprises LLC
  • Meghmani Organics Ltd.
  • Nufarm Ltd.
  • Rainbow Agro.
  • Sumitomo Chemical Co. Ltd.
  • Syngenta AG
  • Tagros Chemicals India Ltd.
  • UPL Ltd.
  • Wilbur Ellis Holdings Inc.
  • Wynca Group

Qualitative and quantitative analysis of companies has been conducted to help clients understand the wider business environment as well as the strengths and weaknesses of key industry players. Data is qualitatively analyzed to categorize companies as pure play, category-focused, industry-focused, and diversified; it is quantitatively analyzed to categorize companies as dominant, leading, strong, tentative, and weak.

Recent Development and News in Dicamba herbicide market

  • In the Fertilizers and Agricultural Chemicals industry, the accelerated integration of RNA-interference biologicals for pest control has forced agrochemical producers to reformulate synthetic chemical portfolios, directly impacting Dicamba Herbicide demand by driving the need for multi-mode-of-action premixes that ensure comprehensive transgenic seed compatibility.
  • Stringent environmental mandates under the European Union Farm to Fork Strategy have restricted the allowable active ingredient load per hectare by up to 20%, shifting Dicamba Herbicide formulations toward optimized soluble liquid formulations and micro-encapsulated suspensions that maximize chemical drift mitigation.
  • The widespread adoption of conservation tillage and no-till farming practices across broad-acre row crop systems has intensified reliance on chemical burndown protocols, elevating Dicamba Herbicide utilization to ensure complete fallow weed eradication prior to soil seedbed preparation.
  • Advancements in high-resolution satellite imagery and artificial intelligence-driven weed patch identification have enabled site-specific agronomic weed control, optimizing Dicamba Herbicide application rates by up to 30% through targeted spraying rather than uniform broadcast spray stability methods.

Dive into Technavio’s robust research methodology, blending expert interviews, extensive data synthesis, and validated models for unparalleled Dicamba Herbicide Market insights. See full methodology.

Market Scope
Page number 291
Base year 2025
Historic period 2020-2024
Forecast period 2026-2030
Growth momentum & CAGR Accelerate at a CAGR of 4.7%
Market growth 2026-2030 USD 129630.1 thousand
Market structure Fragmented
YoY growth 2025-2026(%) 4.6%
Key countries Germany, France, Russia, UK, Italy, Poland, China, India, Australia, Japan, South Korea, Thailand, US, Canada, Mexico, Brazil, Argentina, Chile, South Africa, Turkey, Egypt, Saudi Arabia and UAE
Competitive landscape Leading Companies, Market Positioning of Companies, Competitive Strategies, and Industry Risks

Request Free Sample

Research Analyst Overview

  • The Dicamba Herbicide Market operates at the intersection of advanced chemical synthesis and rigorous environmental stewardship, providing essential tools for broadleaf weed management. Formulators are systematically integrating N,N-Bis-(3-aminopropyl) methylamine and other low-volatility salt chemistry to stabilize active ingredients during field deployment.
  • By adopting these stable molecular structures alongside advanced tank-mix adjuvants, chemical producers have achieved a 30% reduction in off-target vapor drift, significantly limiting legal liability and compliance risks. This chemical stabilization trend profoundly influences boardroom-level product strategies, as agrochemical executives prioritize investments in pH-buffering technology to secure regulatory approvals across restricted agricultural zones.
  • The continuous refinement of emulsifiable concentrates and micro-encapsulated suspensions ensures that the herbicide maintains high efficacy during pre-plant burndown applications. Furthermore, the strategic pairing of these synthetic auxins with residual herbicide combinations creates a comprehensive defense mechanism against herbicide resistance.
  • These technical enhancements allow industrial farming operations to execute precise dicotyledonous species suppression, ensuring that supply chains remain resilient against aggressive biological pressures while navigating an increasingly complex matrix of global environmental regulations.

What are the Key Data Covered in this Dicamba Herbicide Market Research and Growth Report?

  • What is the expected growth of the Dicamba Herbicide Market between 2026 and 2030?

    • USD 129.63 million, at a CAGR of 4.7%

  • What segmentation does the market report cover?

    • The report is segmented by Application (Agriculture, Lawn and turf, and Others), Formulation (Salt, and Acid), Form Factor (Liquid, Granular, and Wettable powder) and Geography (Europe, APAC, North America, South America, Middle East and Africa)

  • Which regions are analyzed in the report?

    • Europe, APAC, North America, South America and Middle East and Africa

  • What are the key growth drivers and market challenges?

    • Proliferation of genetically modified herbicide-tolerant crops, Regulatory hurdles and stringent legal oversight

  • Who are the major players in the Dicamba Herbicide Market?

    • Aarti Industries Ltd., ADAMA Ltd., Albaugh LLC, BASF SE, Bayer AG, Corteva Inc., Dow Chemical Co., Drexel Chemical Co., FMC Corp., Gharda Chemicals Ltd., Helena Agri Enterprises LLC, Meghmani Organics Ltd., Nufarm Ltd., Rainbow Agro., Sumitomo Chemical Co. Ltd., Syngenta AG, Tagros Chemicals India Ltd., UPL Ltd., Wilbur Ellis Holdings Inc. and Wynca Group

Market Research Insights

  • The Dicamba Herbicide Market continually adapts to the rigorous demands of modern agronomic weed control by refining its chemical delivery systems. Transitioning toward advanced multi-mode-of-action premixes has reduced operational mixing errors by 12%, streamlining complex field applications.
  • By integrating temperature inversion monitoring alongside smart spray algorithms, commercial farm managers have improved application timing precision by 22%, effectively managing atmospheric lift mitigation risks. The strategic utilization of soluble liquid formulations guarantees stable broadcast spray stability, ensuring that active ingredients adhere effectively to plant surfaces.
  • Furthermore, adopting optimized spray droplet optimization protocols has decreased the incidence of secondary vapor movement by 15%, aligning chemical treatments with stringent environmental safety mandates and ensuring sustainable crop protection.

We can help! Our analysts can customize this dicamba herbicide market research report to meet your requirements.

Get in touch

1. Executive Summary

1.1 Market overview

Executive Summary - Chart on Market Overview
Executive Summary - Data Table on Market Overview
Executive Summary - Chart on Global Market Characteristics
Executive Summary - Chart on Market by Geography
Executive Summary - Chart on Market Segmentation by Application
Executive Summary - Chart on Market Segmentation by Formulation
Executive Summary - Chart on Market Segmentation by Form Factor
Executive Summary - Chart on Incremental Growth
Executive Summary - Data Table on Incremental Growth
Executive Summary - Chart on Company Market Positioning

2. Technavio Analysis

2.1 Analysis of price sensitivity, lifecycle, customer purchase basket, adoption rates, and purchase criteria

2.2 Criticality of inputs and Factors of differentiation

Chart on Overview on criticality of inputs and factors of differentiation

2.3 Factors of disruption

Chart on Overview on factors of disruption

2.4 Impact of drivers and challenges

Chart on Impact of drivers and challenges in 2025 and 2030

3. Market Landscape

3.1 Market ecosystem

Chart on Parent Market
Data Table on - Parent Market

3.2 Market characteristics

Chart on Market characteristics analysis

3.3 Value chain analysis

Chart on Value chain analysis

4. Market Sizing

4.1 Market definition

Data Table on Offerings of companies included in the market definition

4.2 Market segment analysis

Market segments

4.3 Market size 2025

4.4 Market outlook: Forecast for 2025-2030

Chart on Global - Market size and forecast 2025-2030 ($ thousand)
Data Table on Global - Market size and forecast 2025-2030 ($ thousand)
Chart on Global Market: Year-over-year growth 2025-2030 (%)
Data Table on Global Market: Year-over-year growth 2025-2030 (%)

5. Historic Market Size

5.1 Global Dicamba Herbicide Market 2020 - 2024

Historic Market Size - Data Table on Global Dicamba Herbicide Market 2020 - 2024 ($ thousand)

5.2 Application segment analysis 2020 - 2024

Historic Market Size - Application Segment 2020 - 2024 ($ thousand)

5.3 Formulation segment analysis 2020 - 2024

Historic Market Size - Formulation Segment 2020 - 2024 ($ thousand)

5.4 Form Factor segment analysis 2020 - 2024

Historic Market Size - Form Factor Segment 2020 - 2024 ($ thousand)

5.5 Geography segment analysis 2020 - 2024

Historic Market Size - Geography Segment 2020 - 2024 ($ thousand)

5.6 Country segment analysis 2020 - 2024

Historic Market Size - Country Segment 2020 - 2024 ($ thousand)

6. Qualitative Analysis

6.1 Impact of AI on Global Dicamba Herbicide Market

6.2 Impact of Geopolitical Conflicts on Global Dicamba Herbicide Market

7. Five Forces Analysis

7.1 Five forces summary

Five forces analysis - Comparison between 2025 and 2030

7.2 Bargaining power of buyers

Bargaining power of buyers - Impact of key factors 2025 and 2030

7.3 Bargaining power of suppliers

Bargaining power of suppliers - Impact of key factors in 2025 and 2030

7.4 Threat of new entrants

Threat of new entrants - Impact of key factors in 2025 and 2030

7.5 Threat of substitutes

Threat of substitutes - Impact of key factors in 2025 and 2030

7.6 Threat of rivalry

Threat of rivalry - Impact of key factors in 2025 and 2030

7.7 Market condition

Chart on Market condition - Five forces 2025 and 2030

8. Market Segmentation by Application

8.1 Market segments

Chart on Application - Market share 2025-2030 (%)
Data Table on Application - Market share 2025-2030 (%)

8.2 Comparison by Application

Chart on Comparison by Application
Data Table on Comparison by Application

8.3 Agriculture - Market size and forecast 2025-2030

Chart on Agriculture - Market size and forecast 2025-2030 ($ thousand)
Data Table on Agriculture - Market size and forecast 2025-2030 ($ thousand)
Chart on Agriculture - Year-over-year growth 2025-2030 (%)
Data Table on Agriculture - Year-over-year growth 2025-2030 (%)

8.4 Lawn and turf - Market size and forecast 2025-2030

Chart on Lawn and turf - Market size and forecast 2025-2030 ($ thousand)
Data Table on Lawn and turf - Market size and forecast 2025-2030 ($ thousand)
Chart on Lawn and turf - Year-over-year growth 2025-2030 (%)
Data Table on Lawn and turf - Year-over-year growth 2025-2030 (%)

8.5 Others - Market size and forecast 2025-2030

Chart on Others - Market size and forecast 2025-2030 ($ thousand)
Data Table on Others - Market size and forecast 2025-2030 ($ thousand)
Chart on Others - Year-over-year growth 2025-2030 (%)
Data Table on Others - Year-over-year growth 2025-2030 (%)

8.6 Market opportunity by Application

Market opportunity by Application ($ thousand)
Data Table on Market opportunity by Application ($ thousand)

9. Market Segmentation by Formulation

9.1 Market segments

Chart on Formulation - Market share 2025-2030 (%)
Data Table on Formulation - Market share 2025-2030 (%)

9.2 Comparison by Formulation

Chart on Comparison by Formulation
Data Table on Comparison by Formulation

9.3 Salt - Market size and forecast 2025-2030

Chart on Salt - Market size and forecast 2025-2030 ($ thousand)
Data Table on Salt - Market size and forecast 2025-2030 ($ thousand)
Chart on Salt - Year-over-year growth 2025-2030 (%)
Data Table on Salt - Year-over-year growth 2025-2030 (%)

9.4 Acid - Market size and forecast 2025-2030

Chart on Acid - Market size and forecast 2025-2030 ($ thousand)
Data Table on Acid - Market size and forecast 2025-2030 ($ thousand)
Chart on Acid - Year-over-year growth 2025-2030 (%)
Data Table on Acid - Year-over-year growth 2025-2030 (%)

9.5 Market opportunity by Formulation

Market opportunity by Formulation ($ thousand)
Data Table on Market opportunity by Formulation ($ thousand)

10. Market Segmentation by Form Factor

10.1 Market segments

Chart on Form Factor - Market share 2025-2030 (%)
Data Table on Form Factor - Market share 2025-2030 (%)

10.2 Comparison by Form Factor

Chart on Comparison by Form Factor
Data Table on Comparison by Form Factor

10.3 Liquid - Market size and forecast 2025-2030

Chart on Liquid - Market size and forecast 2025-2030 ($ thousand)
Data Table on Liquid - Market size and forecast 2025-2030 ($ thousand)
Chart on Liquid - Year-over-year growth 2025-2030 (%)
Data Table on Liquid - Year-over-year growth 2025-2030 (%)

10.4 Granular - Market size and forecast 2025-2030

Chart on Granular - Market size and forecast 2025-2030 ($ thousand)
Data Table on Granular - Market size and forecast 2025-2030 ($ thousand)
Chart on Granular - Year-over-year growth 2025-2030 (%)
Data Table on Granular - Year-over-year growth 2025-2030 (%)

10.5 Wettable powder - Market size and forecast 2025-2030

Chart on Wettable powder - Market size and forecast 2025-2030 ($ thousand)
Data Table on Wettable powder - Market size and forecast 2025-2030 ($ thousand)
Chart on Wettable powder - Year-over-year growth 2025-2030 (%)
Data Table on Wettable powder - Year-over-year growth 2025-2030 (%)

10.6 Market opportunity by Form Factor

Market opportunity by Form Factor ($ thousand)
Data Table on Market opportunity by Form Factor ($ thousand)

11. Customer Landscape

11.1 Customer landscape overview

Analysis of price sensitivity, lifecycle, customer purchase basket, adoption rates, and purchase criteria

12. Geographic Landscape

12.1 Geographic segmentation

Chart on Market share by geography 2025-2030 (%)
Data Table on Market share by geography 2025-2030 (%)

12.2 Geographic comparison

Chart on Geographic comparison
Data Table on Geographic comparison

12.3 Europe - Market size and forecast 2025-2030

Chart on Europe - Market size and forecast 2025-2030 ($ thousand)
Data Table on Europe - Market size and forecast 2025-2030 ($ thousand)
Chart on Europe - Year-over-year growth 2025-2030 (%)
Data Table on Europe - Year-over-year growth 2025-2030 (%)
Chart on Regional Comparison - Europe
Data Table on Regional Comparison - Europe

12.3.1 Germany - Market size and forecast 2025-2030

Chart on Germany - Market size and forecast 2025-2030 ($ thousand)
Data Table on Germany - Market size and forecast 2025-2030 ($ thousand)
Chart on Germany - Year-over-year growth 2025-2030 (%)
Data Table on Germany - Year-over-year growth 2025-2030 (%)

12.3.2 France - Market size and forecast 2025-2030

Chart on France - Market size and forecast 2025-2030 ($ thousand)
Data Table on France - Market size and forecast 2025-2030 ($ thousand)
Chart on France - Year-over-year growth 2025-2030 (%)
Data Table on France - Year-over-year growth 2025-2030 (%)

12.3.3 Russia - Market size and forecast 2025-2030

Chart on Russia - Market size and forecast 2025-2030 ($ thousand)
Data Table on Russia - Market size and forecast 2025-2030 ($ thousand)
Chart on Russia - Year-over-year growth 2025-2030 (%)
Data Table on Russia - Year-over-year growth 2025-2030 (%)

12.3.4 UK - Market size and forecast 2025-2030

Chart on UK - Market size and forecast 2025-2030 ($ thousand)
Data Table on UK - Market size and forecast 2025-2030 ($ thousand)
Chart on UK - Year-over-year growth 2025-2030 (%)
Data Table on UK - Year-over-year growth 2025-2030 (%)

12.3.5 Italy - Market size and forecast 2025-2030

Chart on Italy - Market size and forecast 2025-2030 ($ thousand)
Data Table on Italy - Market size and forecast 2025-2030 ($ thousand)
Chart on Italy - Year-over-year growth 2025-2030 (%)
Data Table on Italy - Year-over-year growth 2025-2030 (%)

12.3.6 Poland - Market size and forecast 2025-2030

Chart on Poland - Market size and forecast 2025-2030 ($ thousand)
Data Table on Poland - Market size and forecast 2025-2030 ($ thousand)
Chart on Poland - Year-over-year growth 2025-2030 (%)
Data Table on Poland - Year-over-year growth 2025-2030 (%)

12.4 APAC - Market size and forecast 2025-2030

Chart on APAC - Market size and forecast 2025-2030 ($ thousand)
Data Table on APAC - Market size and forecast 2025-2030 ($ thousand)
Chart on APAC - Year-over-year growth 2025-2030 (%)
Data Table on APAC - Year-over-year growth 2025-2030 (%)
Chart on Regional Comparison - APAC
Data Table on Regional Comparison - APAC

12.4.1 China - Market size and forecast 2025-2030

Chart on China - Market size and forecast 2025-2030 ($ thousand)
Data Table on China - Market size and forecast 2025-2030 ($ thousand)
Chart on China - Year-over-year growth 2025-2030 (%)
Data Table on China - Year-over-year growth 2025-2030 (%)

12.4.2 India - Market size and forecast 2025-2030

Chart on India - Market size and forecast 2025-2030 ($ thousand)
Data Table on India - Market size and forecast 2025-2030 ($ thousand)
Chart on India - Year-over-year growth 2025-2030 (%)
Data Table on India - Year-over-year growth 2025-2030 (%)

12.4.3 Australia - Market size and forecast 2025-2030

Chart on Australia - Market size and forecast 2025-2030 ($ thousand)
Data Table on Australia - Market size and forecast 2025-2030 ($ thousand)
Chart on Australia - Year-over-year growth 2025-2030 (%)
Data Table on Australia - Year-over-year growth 2025-2030 (%)

12.4.4 Japan - Market size and forecast 2025-2030

Chart on Japan - Market size and forecast 2025-2030 ($ thousand)
Data Table on Japan - Market size and forecast 2025-2030 ($ thousand)
Chart on Japan - Year-over-year growth 2025-2030 (%)
Data Table on Japan - Year-over-year growth 2025-2030 (%)

12.4.5 South Korea - Market size and forecast 2025-2030

Chart on South Korea - Market size and forecast 2025-2030 ($ thousand)
Data Table on South Korea - Market size and forecast 2025-2030 ($ thousand)
Chart on South Korea - Year-over-year growth 2025-2030 (%)
Data Table on South Korea - Year-over-year growth 2025-2030 (%)

12.4.6 Thailand - Market size and forecast 2025-2030

Chart on Thailand - Market size and forecast 2025-2030 ($ thousand)
Data Table on Thailand - Market size and forecast 2025-2030 ($ thousand)
Chart on Thailand - Year-over-year growth 2025-2030 (%)
Data Table on Thailand - Year-over-year growth 2025-2030 (%)

12.5 North America - Market size and forecast 2025-2030

Chart on North America - Market size and forecast 2025-2030 ($ thousand)
Data Table on North America - Market size and forecast 2025-2030 ($ thousand)
Chart on North America - Year-over-year growth 2025-2030 (%)
Data Table on North America - Year-over-year growth 2025-2030 (%)
Chart on Regional Comparison - North America
Data Table on Regional Comparison - North America

12.5.1 US - Market size and forecast 2025-2030

Chart on US - Market size and forecast 2025-2030 ($ thousand)
Data Table on US - Market size and forecast 2025-2030 ($ thousand)
Chart on US - Year-over-year growth 2025-2030 (%)
Data Table on US - Year-over-year growth 2025-2030 (%)

12.5.2 Canada - Market size and forecast 2025-2030

Chart on Canada - Market size and forecast 2025-2030 ($ thousand)
Data Table on Canada - Market size and forecast 2025-2030 ($ thousand)
Chart on Canada - Year-over-year growth 2025-2030 (%)
Data Table on Canada - Year-over-year growth 2025-2030 (%)

12.5.3 Mexico - Market size and forecast 2025-2030

Chart on Mexico - Market size and forecast 2025-2030 ($ thousand)
Data Table on Mexico - Market size and forecast 2025-2030 ($ thousand)
Chart on Mexico - Year-over-year growth 2025-2030 (%)
Data Table on Mexico - Year-over-year growth 2025-2030 (%)

12.6 South America - Market size and forecast 2025-2030

Chart on South America - Market size and forecast 2025-2030 ($ thousand)
Data Table on South America - Market size and forecast 2025-2030 ($ thousand)
Chart on South America - Year-over-year growth 2025-2030 (%)
Data Table on South America - Year-over-year growth 2025-2030 (%)
Chart on Regional Comparison - South America
Data Table on Regional Comparison - South America

12.6.1 Brazil - Market size and forecast 2025-2030

Chart on Brazil - Market size and forecast 2025-2030 ($ thousand)
Data Table on Brazil - Market size and forecast 2025-2030 ($ thousand)
Chart on Brazil - Year-over-year growth 2025-2030 (%)
Data Table on Brazil - Year-over-year growth 2025-2030 (%)

12.6.2 Argentina - Market size and forecast 2025-2030

Chart on Argentina - Market size and forecast 2025-2030 ($ thousand)
Data Table on Argentina - Market size and forecast 2025-2030 ($ thousand)
Chart on Argentina - Year-over-year growth 2025-2030 (%)
Data Table on Argentina - Year-over-year growth 2025-2030 (%)

12.6.3 Chile - Market size and forecast 2025-2030

Chart on Chile - Market size and forecast 2025-2030 ($ thousand)
Data Table on Chile - Market size and forecast 2025-2030 ($ thousand)
Chart on Chile - Year-over-year growth 2025-2030 (%)
Data Table on Chile - Year-over-year growth 2025-2030 (%)

12.7 Middle East and Africa - Market size and forecast 2025-2030

Chart on Middle East and Africa - Market size and forecast 2025-2030 ($ thousand)
Data Table on Middle East and Africa - Market size and forecast 2025-2030 ($ thousand)
Chart on Middle East and Africa - Year-over-year growth 2025-2030 (%)
Data Table on Middle East and Africa - Year-over-year growth 2025-2030 (%)
Chart on Regional Comparison - Middle East and Africa
Data Table on Regional Comparison - Middle East and Africa

12.7.1 South Africa - Market size and forecast 2025-2030

Chart on South Africa - Market size and forecast 2025-2030 ($ thousand)
Data Table on South Africa - Market size and forecast 2025-2030 ($ thousand)
Chart on South Africa - Year-over-year growth 2025-2030 (%)
Data Table on South Africa - Year-over-year growth 2025-2030 (%)

12.7.2 Turkey - Market size and forecast 2025-2030

Chart on Turkey - Market size and forecast 2025-2030 ($ thousand)
Data Table on Turkey - Market size and forecast 2025-2030 ($ thousand)
Chart on Turkey - Year-over-year growth 2025-2030 (%)
Data Table on Turkey - Year-over-year growth 2025-2030 (%)

12.7.3 Egypt - Market size and forecast 2025-2030

Chart on Egypt - Market size and forecast 2025-2030 ($ thousand)
Data Table on Egypt - Market size and forecast 2025-2030 ($ thousand)
Chart on Egypt - Year-over-year growth 2025-2030 (%)
Data Table on Egypt - Year-over-year growth 2025-2030 (%)

12.7.4 Saudi Arabia - Market size and forecast 2025-2030

Chart on Saudi Arabia - Market size and forecast 2025-2030 ($ thousand)
Data Table on Saudi Arabia - Market size and forecast 2025-2030 ($ thousand)
Chart on Saudi Arabia - Year-over-year growth 2025-2030 (%)
Data Table on Saudi Arabia - Year-over-year growth 2025-2030 (%)

12.7.5 UAE - Market size and forecast 2025-2030

Chart on UAE - Market size and forecast 2025-2030 ($ thousand)
Data Table on UAE - Market size and forecast 2025-2030 ($ thousand)
Chart on UAE - Year-over-year growth 2025-2030 (%)
Data Table on UAE - Year-over-year growth 2025-2030 (%)

12.8 Market opportunity by geography

Market opportunity by geography ($ thousand)
Data Tables on Market opportunity by geography ($ thousand)

13. Drivers, Challenges, and Opportunity

13.1 Market drivers

Proliferation of genetically modified herbicide-tolerant crops
Rising glyphosate resistance and requirement for alternative modes of action
Modernization of agricultural practices and expansion of conservation tillage

13.2 Market challenges

Regulatory hurdles and stringent legal oversight
Development of resistant weed biotypes
Off-target movement and volatility issues

13.3 Impact of drivers and challenges

Impact of drivers and challenges in 2025 and 2030

13.4 Market opportunities

Evolution of low-volatility chemical formulations
Convergence of herbicide application and precision digital technology
Strategic adoption of multi-mode-of-action premixes and tank-mix diversity

14. Competitive Landscape

14.1 Overview

14.2

Overview on criticality of inputs and factors of differentiation

14.3 Landscape disruption

Overview on factors of disruption

14.4 Industry risks

Impact of key risks on business

15. Competitive Analysis

15.1 Companies profiled

Companies covered

15.2 Company ranking index

15.3 Market positioning of companies

Matrix on companies position and classification

15.4 Aarti Industries Ltd.

Aarti Industries Ltd. - Overview
Aarti Industries Ltd. - Business segments
Aarti Industries Ltd. - Key offerings
Aarti Industries Ltd. - Segment focus
SWOT

15.5 ADAMA Ltd.

ADAMA Ltd. - Overview
ADAMA Ltd. - Product / Service
ADAMA Ltd. - Key offerings
SWOT

15.6 Albaugh LLC

Albaugh LLC - Overview
Albaugh LLC - Product / Service
Albaugh LLC - Key offerings
SWOT

15.7 BASF SE

BASF SE - Overview
BASF SE - Business segments
BASF SE - Key news
BASF SE - Key offerings
BASF SE - Segment focus
SWOT

15.8 Bayer AG

Bayer AG - Overview
Bayer AG - Business segments
Bayer AG - Key news
Bayer AG - Key offerings
Bayer AG - Segment focus
SWOT

15.9 Corteva Inc.

Corteva Inc. - Overview
Corteva Inc. - Business segments
Corteva Inc. - Key offerings
Corteva Inc. - Segment focus
SWOT

15.10 Dow Chemical Co.

Dow Chemical Co. - Overview
Dow Chemical Co. - Business segments
Dow Chemical Co. - Key news
Dow Chemical Co. - Key offerings
Dow Chemical Co. - Segment focus
SWOT

15.11 Drexel Chemical Co.

Drexel Chemical Co. - Overview
Drexel Chemical Co. - Product / Service
Drexel Chemical Co. - Key offerings
SWOT

15.12 FMC Corp.

FMC Corp. - Overview
FMC Corp. - Product / Service
FMC Corp. - Key offerings
SWOT

15.13 Meghmani Organics Ltd.

Meghmani Organics Ltd. - Overview
Meghmani Organics Ltd. - Product / Service
Meghmani Organics Ltd. - Key offerings
SWOT

15.14 Nufarm Ltd.

Nufarm Ltd. - Overview
Nufarm Ltd. - Business segments
Nufarm Ltd. - Key offerings
Nufarm Ltd. - Segment focus
SWOT

15.15 Rainbow Agro.

Rainbow Agro. - Overview
Rainbow Agro. - Product / Service
Rainbow Agro. - Key offerings
SWOT

15.16 Sumitomo Chemical Co. Ltd.

Sumitomo Chemical Co. Ltd. - Overview
Sumitomo Chemical Co. Ltd. - Business segments
Sumitomo Chemical Co. Ltd. - Key offerings
Sumitomo Chemical Co. Ltd. - Segment focus
SWOT

15.17 UPL Ltd.

UPL Ltd. - Overview
UPL Ltd. - Business segments
UPL Ltd. - Key offerings
UPL Ltd. - Segment focus
SWOT

15.18 Wynca Group

Wynca Group - Overview
Wynca Group - Product / Service
Wynca Group - Key offerings
SWOT

16. Appendix

16.1 Scope of the report

Market definition
Objectives
Notes and caveats

16.2 Inclusions and exclusions checklist

Inclusions checklist
Exclusions checklist

16.3 Currency conversion rates for US$

16.4 Research methodology

16.5 Data procurement

Information sources

16.6 Data validation

16.7 Validation techniques employed for market sizing

16.8 Data synthesis

16.9 360 degree market analysis

16.10 List of abbreviations

Research Methodology

Technavio presents a detailed picture of the market by way of study, synthesis, and summation of data from multiple sources. The analysts have presented the various facets of the market with a particular focus on identifying the key industry influencers. The data thus presented is comprehensive, reliable, and the result of extensive research, both primary and secondary.

INFORMATION SOURCES

Primary sources

  • Manufacturers and suppliers
  • Channel partners
  • Industry experts
  • Strategic decision makers

Secondary sources

  • Industry journals and periodicals
  • Government data
  • Financial reports of key industry players
  • Historical data
  • Press releases

DATA ANALYSIS

Data Synthesis

  • Collation of data
  • Estimation of key figures
  • Analysis of derived insights

Data Validation

  • Triangulation with data models
  • Reference against proprietary databases
  • Corroboration with industry experts

REPORT WRITING

Qualitative

  • Market drivers
  • Market challenges
  • Market trends
  • Five forces analysis

Quantitative

  • Market size and forecast
  • Market segmentation
  • Geographical insights
  • Competitive landscape

Interested in this report?

Get your sample now to see our research methodology and insights!

Download Now

Frequently Asked Questions

Dicamba Herbicide market growth will increase by USD 129630.1 thousand thousand during 2026-2030.

The Dicamba Herbicide market is expected to grow at a CAGR of 4.7% during 2026-2030.

Dicamba Herbicide market is segmented by Application (Agriculture, Lawn and turf, Others) Formulation (Salt, Acid) Form factor (Liquid, Granular, Wettable powder)

Aarti Industries Ltd., ADAMA Ltd., Albaugh LLC, BASF SE, Bayer AG, Corteva Inc., Dow Chemical Co., Drexel Chemical Co., FMC Corp., Gharda Chemicals Ltd., Helena Agri Enterprises LLC, Meghmani Organics Ltd., Nufarm Ltd., Rainbow Agro., Sumitomo Chemical Co. Ltd., Syngenta AG, Tagros Chemicals India Ltd., UPL Ltd., Wilbur Ellis Holdings Inc., Wynca Group are a few of the key vendors in the Dicamba Herbicide market.

Europe will register the highest growth rate of 31.3% among the other regions. Therefore, the Dicamba Herbicide market in Europe is expected to garner significant business opportunities for the vendors during the forecast period.

Germany, France, Russia, UK, Italy, Poland, China, India, Australia, Japan, South Korea, Thailand, US, Canada, Mexico, Brazil, Argentina, Chile, South Africa, Turkey, Egypt, Saudi Arabia, UAE

  • Proliferation of genetically modified herbicide-tolerant crops is the driving factor this market.

The Dicamba Herbicide market vendors should focus on grabbing business opportunities from the Application segment as it accounted for the largest market share in the base year.
RIA - Research AI Assistant
Ask RIA
