Dicing Equipment Market Analysis, Size, and Forecast 2026-2030: APAC (China, Japan, and India), North America (US, Canada, and Mexico), Europe (Germany, UK, and France), South America (Brazil and Argentina), Middle East and Africa (Saudi Arabia, UAE, and South Africa), and Rest of World (ROW)

Dicing Equipment Market Analysis, Size, and Forecast 2026-2030:
APAC (China, Japan, and India), North America (US, Canada, and Mexico), Europe (Germany, UK, and France), South America (Brazil and Argentina), Middle East and Africa (Saudi Arabia, UAE, and South Africa), and Rest of World (ROW)

Published: Jan 2026 278 Pages SKU: IRTNTR72240

Market Overview at a Glance

$269.1 Mn
Market Opportunity
4.7%
CAGR 2025 - 2030
86.1%
APAC Growth
$856.4 Mn
Pureplay foundries segment 2024

Dicing Equipment Market Size 2026-2030

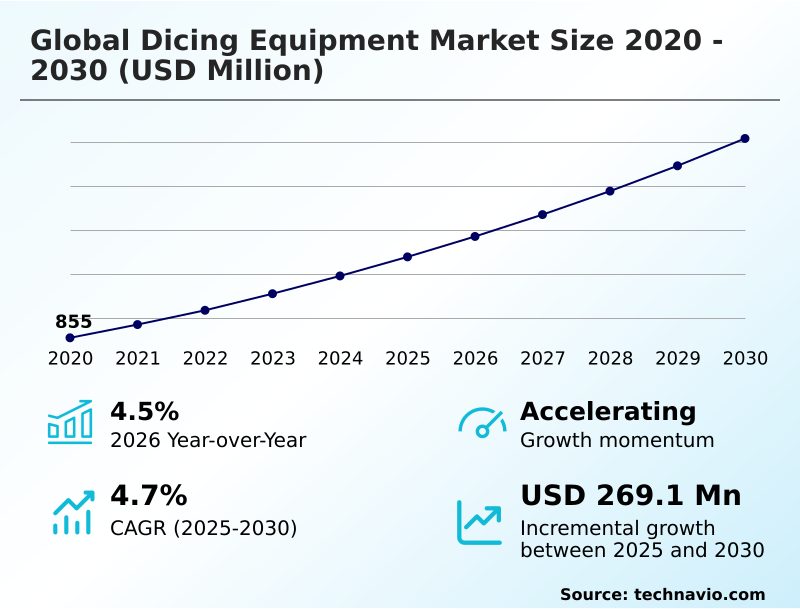
The dicing equipment market size is valued to increase by USD 269.1 million, at a CAGR of 4.7% from 2025 to 2030. Growing investment in fabrication facilities will drive the dicing equipment market.

Major Market Trends & Insights

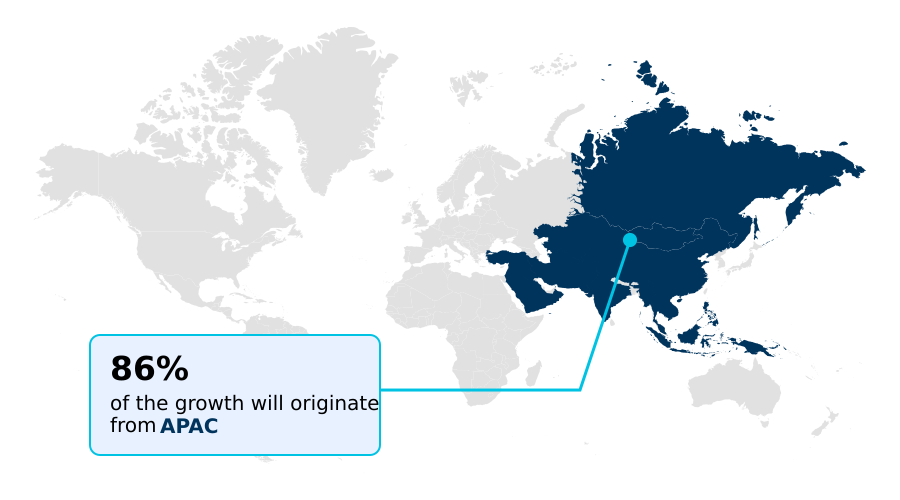
  • APAC dominated the market and accounted for a 86.1% growth during the forecast period.
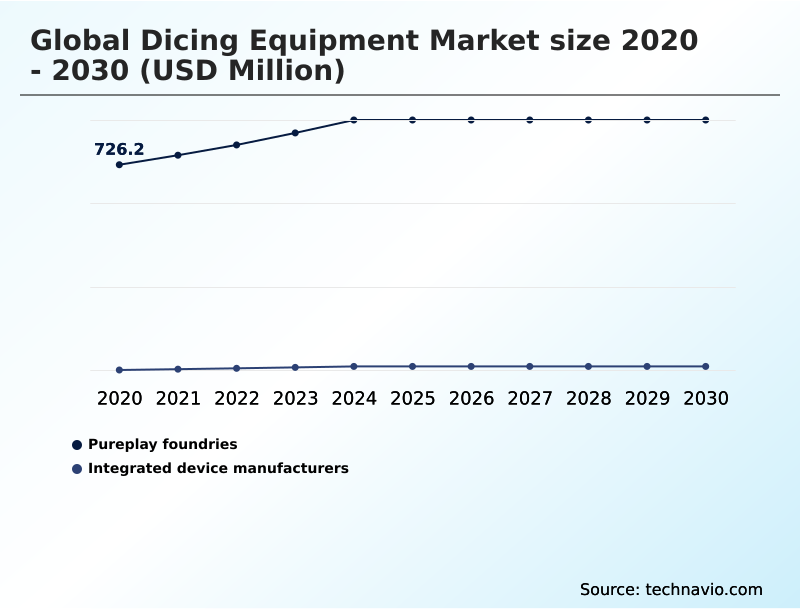
  • By End-user - Pureplay foundries segment was valued at USD 856.4 million in 2024
  • By Type - Blade dicing equipment segment accounted for the largest market revenue share in 2024

Market Size & Forecast

  • Market Opportunities: USD 453 million
  • Market Future Opportunities: USD 269.1 million
  • CAGR from 2025 to 2030 : 4.7%

Market Summary

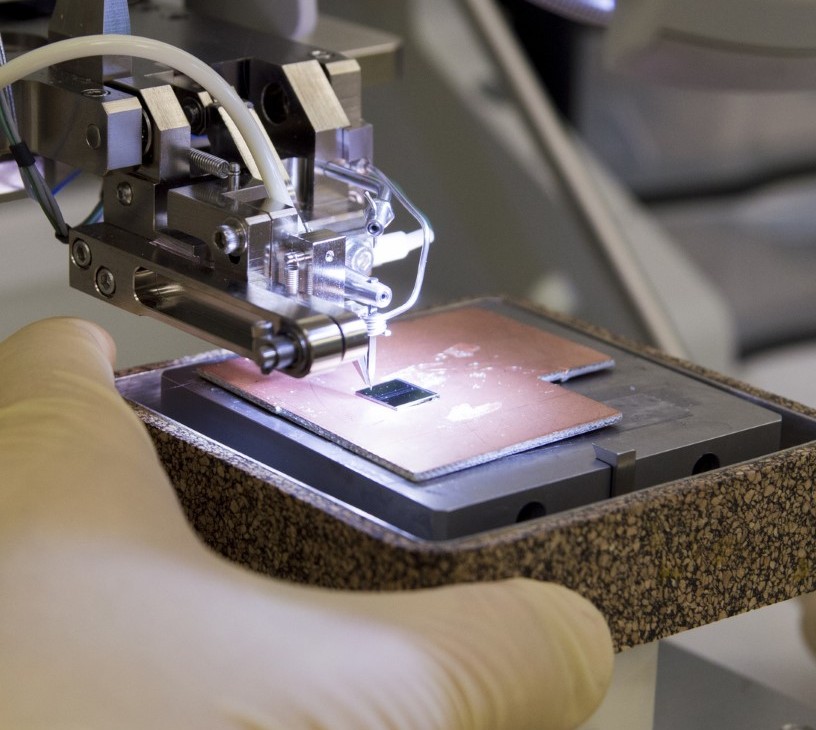
  • The dicing equipment market is integral to modern electronics production, enabling the critical step of wafer singulation in semiconductor manufacturing. This process is evolving rapidly, driven by the relentless pursuit of miniaturization and the adoption of new compound semiconductors like silicon carbide (SiC) and gallium nitride (GaN).
  • As devices shrink, the precision required from dicing technologies, whether blade dicing, laser dicing, or plasma dicing, intensifies. A primary focus is on minimizing kerf loss and the heat affected zone (HAZ) to maximize the number of functional dies per wafer while preventing chipping.
  • For instance, a fab producing components for electric vehicles must perfect its dicing before grind (DBG) process for ultra-thin wafers. This involves optimizing spindle speed and coolant flow to maintain die strength and avoid micro-cracks, ensuring the reliability needed for high-power applications.
  • This constant need for innovation in die separation and process control underscores the market's dynamic nature, with advancements directly impacting the feasibility of next-generation electronics.

What will be the Size of the Dicing Equipment Market during the forecast period?

Get Key Insights on Market Forecast (PDF) Request Free Sample

How is the Dicing Equipment Market Segmented?

The dicing equipment industry research report provides comprehensive data (region-wise segment analysis), with forecasts and estimates in "USD million" for the period 2026-2030, as well as historical data from 2020-2024 for the following segments.

  • End-user
    • Pureplay foundries
    • Integrated device manufacturers
  • Type
    • Blade dicing equipment
    • Laser dicing equipment
    • Plasma dicing equipment
  • Technology
    • Automated dicing systems
    • Manual dicing
  • Geography
    • APAC
      • China
      • Japan
      • India
    • North America
      • US
      • Canada
      • Mexico
    • Europe
      • Germany
      • UK
      • France
    • South America
      • Brazil
      • Argentina
    • Middle East and Africa
      • Saudi Arabia
      • UAE
      • South Africa
    • Rest of World (ROW)

By End-user Insights

The pureplay foundries segment is estimated to witness significant growth during the forecast period.

The pureplay foundries segment is pivotal to the semiconductor manufacturing ecosystem, operating high-volume production for third-party clients. Demand for precise and reliable equipment for die singulation is critical, as this process directly impacts yield and device integrity.

As designs advance toward heterogeneous integration and advanced packaging, foundries require high-performance solutions for wafer singulation that maintain tight tolerances, ensure high die strength, and reduce micro-cracks.

Innovations in plasma dicing and laser dicing are essential for handling diverse materials and achieving dicing process optimization.

Operational efficiency is paramount, driving adoption of automation to maximize throughput while maintaining consistent quality, with some foundries achieving a 3% improvement in overall yield by refining their scribing and dicing fluid management processes.

Request Free Sample

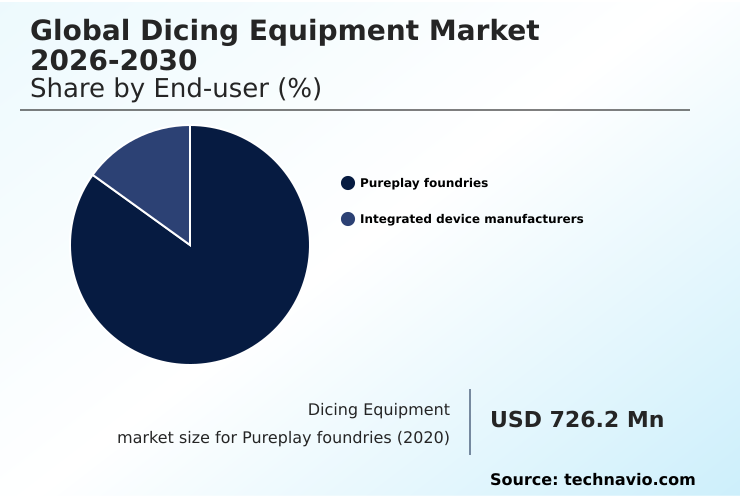
The Pureplay foundries segment was valued at USD 856.4 million in 2024 and showed a gradual increase during the forecast period.

Request Free Sample

Regional Analysis

APAC is estimated to contribute 86.1% to the growth of the global market during the forecast period.Technavio’s analysts have elaborately explained the regional trends and drivers that shape the market during the forecast period.

See How Dicing Equipment Market Demand is Rising in APAC Request Free Sample

The geographic landscape is dominated by the APAC region, which is set to account for over 86% of the market's incremental growth.

This concentration is due to the extensive network of semiconductor manufacturing facilities and a robust supply chain supporting advanced packaging and die separation activities.

Regional growth is fueled by significant investments in fabrication capacity to meet global demand for high-precision electronics. North America is the second-largest contributor, driven by strategic initiatives to bolster domestic production and R&D in singulation technologies.

The need for effective thermal management and wafer bonding techniques in this region reinforces demand for sophisticated equipment.

In contrast, Europe's market share is smaller but shows steady growth, particularly in specialized sectors requiring advanced MEMS dicing and 3D IC integration capabilities.
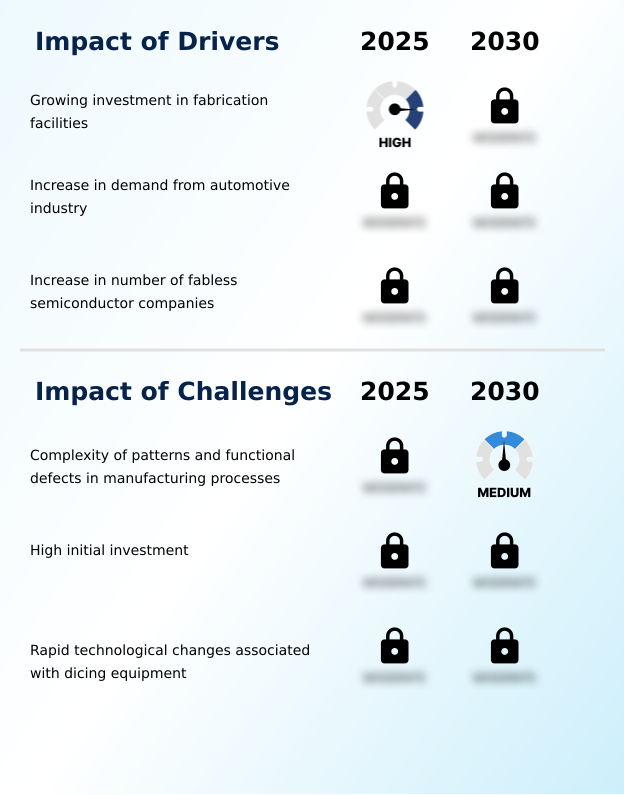
Market Dynamics

Our researchers analyzed the data with 2025 as the base year, along with the key drivers, trends, and challenges. A holistic analysis of drivers will help companies refine their marketing strategies to gain a competitive advantage.

  • Navigating the complexities of modern semiconductor production requires a deep understanding of advanced singulation methods. A blade dicing vs laser dicing comparison often reveals distinct advantages based on material and application, with laser ablation techniques for brittle materials gaining traction.
  • For manufacturers, reducing kerf loss in wafer dicing is a primary objective, leading many to adopt stealth dicing for thin silicon wafers to maximize die output. The dicing before grind process advantages include enhanced die strength, which is critical for advanced packaging dicing challenges. Concurrently, managing heat affected zone in laser dicing remains a key focus to prevent thermal damage.
  • For high-volume operations, dicing saw maintenance best practices and dicing tape selection for fragile substrates are essential for consistent performance. Process control for high yield singulation is achieved by integrating technologies like wafer mapping for dicing accuracy improvement and automating the die separation process flow.
  • As applications for compound semiconductors expand, dicing solutions for silicon carbide wafers are becoming standard, requiring strategies for preventing chipping during wafer singulation. Evaluating dicing equipment cost of ownership analysis is crucial for long-term investment planning, alongside optimizing coolant flow for dicing process and understanding the impact of spindle speed on dicing quality.
  • Furthermore, plasma dicing for MEMS device fabrication represents a specialized field with unique requirements. In this competitive environment, systems that offer a 2x improvement in defect detection speed over previous generations provide a significant operational edge.

What are the key market drivers leading to the rise in the adoption of Dicing Equipment Industry?

  • Growing investment in fabrication facilities is a key driver for the market, fueling demand for advanced semiconductor manufacturing equipment.

  • Substantial investments in new fabrication facilities are a primary driver, creating sustained demand for high-performance dicing equipment. As manufacturers scale up to meet the needs of the automotive and data center sectors, the focus is on maximizing throughput and yield.
  • This requires sophisticated die singulation systems capable of high-precision cutting with minimal downtime. New fabs are being designed to increase wafer starts by over 25%, compelling equipment suppliers to deliver solutions that enhance throughput enhancement by a comparable margin.
  • Furthermore, the adoption of automation and advanced process control has led to a 10% reduction in cycle times for some backgrinding and dicing sequences, demonstrating a clear return on investment for companies upgrading their production lines.

What are the market trends shaping the Dicing Equipment Industry?

  • The increasing demand for Internet of Things (IoT) connected devices is emerging as a significant trend, driving complexity in semiconductor design and production scale.

  • The market is experiencing a significant shift driven by the demand for miniaturization in connected devices, which necessitates higher precision in semiconductor manufacturing. This trend is accelerating the adoption of laser grooving and other advanced singulation technologies to handle increasingly complex and fragile materials. As a result, equipment that enhances yield and throughput is paramount.
  • For example, the integration of automated defect inspection systems has been shown to improve detection accuracy by over 20% compared to manual methods, while optimizing the wafer dicing process for specific substrates can reduce material waste by up to 15%.
  • This focus on efficiency and quality control is critical for supporting next-generation applications in wafer-level packaging (WLP) and system-in-package (SiP) designs.

What challenges does the Dicing Equipment Industry face during its growth?

  • The complexity of dicing patterns and the risk of functional defects during manufacturing processes present a key challenge to industry growth.

  • A significant challenge lies in managing the growing complexity of dicing patterns and minimizing functional defects, especially with the adoption of ultra-thin wafers and delicate compound semiconductors. The risk of chipping or inducing micro-cracks during die separation can reduce final yields by as much as 5% in sensitive applications.
  • Furthermore, the intricacies of thin wafer handling and dicing fluid management require advanced automation and process control to maintain stability. Equipment that offers real-time blade wear monitoring can extend consumable life by up to 30%, mitigating a key operational cost. Addressing these challenges is crucial for enabling high-volume manufacturing of next-generation devices for fan-out wafer-level packaging (FOWLP).

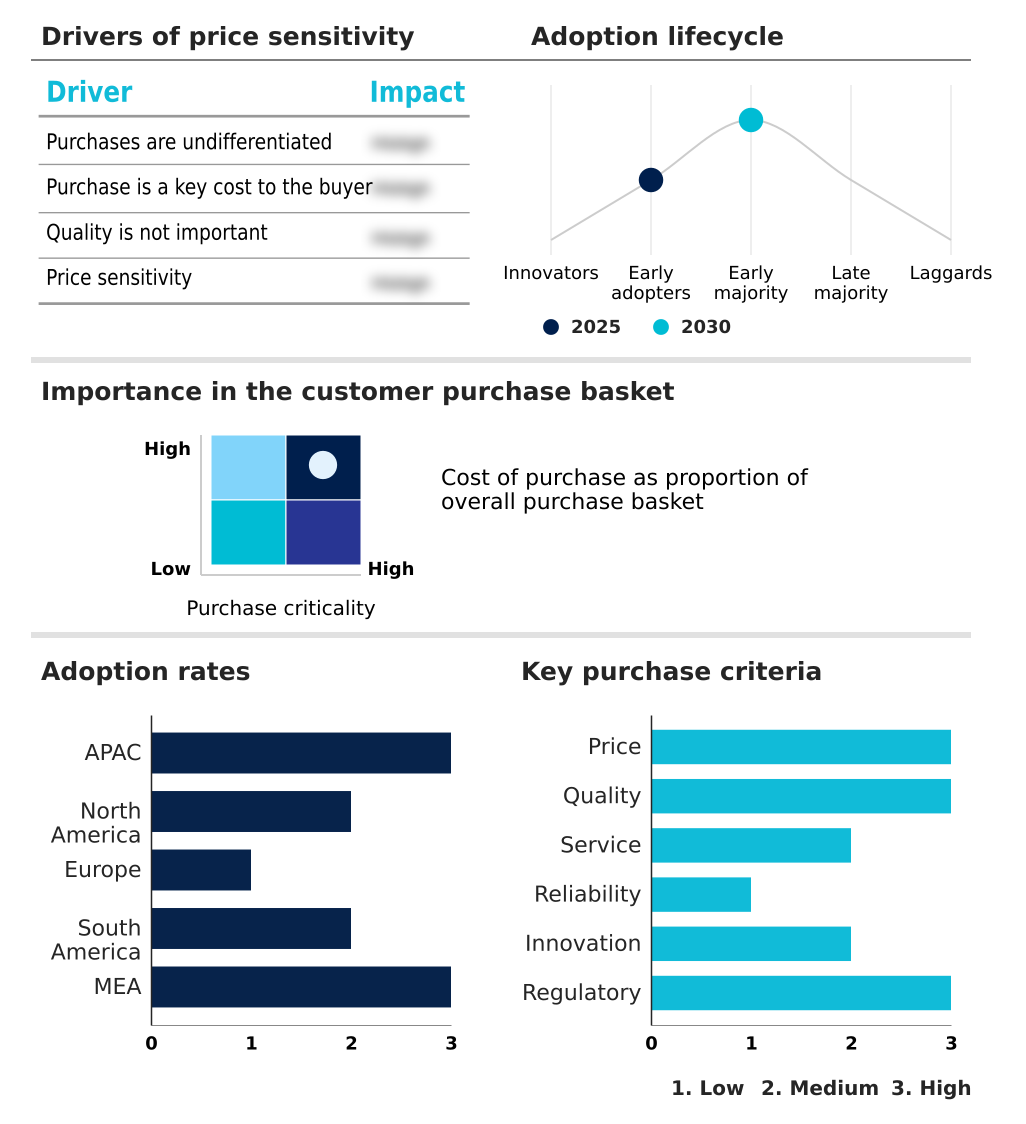
Exclusive Technavio Analysis on Customer Landscape

The dicing equipment market forecasting report includes the adoption lifecycle of the market, covering from the innovator’s stage to the laggard’s stage. It focuses on adoption rates in different regions based on penetration. Furthermore, the dicing equipment market report also includes key purchase criteria and drivers of price sensitivity to help companies evaluate and develop their market growth analysis strategies.

Customer Landscape of Dicing Equipment Industry

Competitive Landscape

Companies are implementing various strategies, such as strategic alliances, dicing equipment market forecast, partnerships, mergers and acquisitions, geographical expansion, and product/service launches, to enhance their presence in the industry.

3D Micromac AG - Specializes in laser-based micro-machining systems, delivering high-precision dicing and structuring solutions for the semiconductor and photovoltaic industries.

The industry research and growth report includes detailed analyses of the competitive landscape of the market and information about key companies, including:

  • 3D Micromac AG
  • Advanced Dicing Technologies
  • ASMPT ALSI
  • DISCO Corp.
  • Jiangsu Jing Chuang Co. Ltd.
  • KLA Corp.
  • Marposs Spa
  • MTINC Machines
  • Neon Tech Co. Ltd.
  • Panasonic Connect Co. Ltd.
  • PLASMA THERM
  • Shenyang Heyan Technology
  • SLTL Group
  • Suzhou Delphi Laser Co. Ltd.
  • Synova SA
  • TOKYO SEIMITSU CO. LTD.
  • Veeco Instruments Inc.
  • GL Tech Co. Ltd.

Qualitative and quantitative analysis of companies has been conducted to help clients understand the wider business environment as well as the strengths and weaknesses of key industry players. Data is qualitatively analyzed to categorize companies as pure play, category-focused, industry-focused, and diversified; it is quantitatively analyzed to categorize companies as dominant, leading, strong, tentative, and weak.

Recent Development and News in Dicing equipment market

  • In January 2025, Digi International announced new solutions at the Consumer Electronics Show and celebrated shipping over 25 million Digi XBee modules, highlighting the expansion of IoT connectivity.
  • In January 2025, Tokyo Seimitsu Co., Ltd. and Asahi Diamond Industrial Co., Ltd. announced a memorandum of understanding to form a joint venture focused on advanced dicing and cutting technologies.
  • In March 2025, Panasonic Connect announced its NPM-GW modular placement machine, showcasing a flexible platform designed to enhance precision, throughput, and scalability in electronics manufacturing.
  • In March 2025, TSMC announced a USD 100 billion investment for three new semiconductor fabs, advanced packaging facilities, and an R&D center in Arizona to reinforce US chip manufacturing.

Dive into Technavio’s robust research methodology, blending expert interviews, extensive data synthesis, and validated models for unparalleled Dicing Equipment Market insights. See full methodology.

Market Scope
Page number 278
Base year 2025
Historic period 2020-2024
Forecast period 2026-2030
Growth momentum & CAGR Accelerate at a CAGR of 4.7%
Market growth 2026-2030 USD 269.1 million
Market structure Fragmented
YoY growth 2025-2026(%) 4.5%
Key countries China, Japan, India, South Korea, Australia, Indonesia, US, Canada, Mexico, Germany, UK, France, Italy, Spain, The Netherlands, Brazil, Argentina, Chile, Saudi Arabia, UAE, South Africa, Israel and Turkey
Competitive landscape Leading Companies, Market Positioning of Companies, Competitive Strategies, and Industry Risks

Request Free Sample

Research Analyst Overview

  • The dicing equipment market is evolving from a focus on mechanical cutting to a sophisticated landscape of high-precision technologies essential for next-generation semiconductor manufacturing. Key advancements in laser dicing, plasma dicing, and stealth dicing are enabling the wafer singulation of complex devices that use compound semiconductors such as silicon carbide (SiC) and gallium nitride (GaN).
  • This shift requires meticulous process control to manage the heat affected zone (HAZ), minimize micro-cracks, and prevent chipping, thereby ensuring die strength. For boardroom consideration, investing in equipment capable of dicing before grind (DBG) is a strategic decision that directly supports the production of ultra-thin wafers for advanced packaging and heterogeneous integration.
  • Optimizing the entire workflow—from the wafer mounter and dicing tape to the final die separator—is critical for maximizing throughput and yield. Systems integrating technologies that reduce dicing-related defects by over 20% are becoming indispensable.
  • Success depends on mastering variables like spindle speed and coolant flow in blade dicing, as well as the intricate parameters of plasma etching and scribing for complete die separation and effective backgrinding, all guided by precise wafer mapping and automation.

What are the Key Data Covered in this Dicing Equipment Market Research and Growth Report?

  • What is the expected growth of the Dicing Equipment Market between 2026 and 2030?

    • USD 269.1 million, at a CAGR of 4.7%

  • What segmentation does the market report cover?

    • The report is segmented by End-user (Pureplay foundries, and Integrated device manufacturers), Type (Blade dicing equipment, Laser dicing equipment, and Plasma dicing equipment), Technology (Automated dicing systems, and Manual dicing) and Geography (APAC, North America, Europe, South America, Middle East and Africa)

  • Which regions are analyzed in the report?

    • APAC, North America, Europe, South America and Middle East and Africa

  • What are the key growth drivers and market challenges?

    • Growing investment in fabrication facilities, Complexity of patterns and functional defects in manufacturing processes

  • Who are the major players in the Dicing Equipment Market?

    • 3D Micromac AG, Advanced Dicing Technologies, ASMPT ALSI, DISCO Corp., Jiangsu Jing Chuang Co. Ltd., KLA Corp., Marposs Spa, MTINC Machines, Neon Tech Co. Ltd., Panasonic Connect Co. Ltd., PLASMA THERM, Shenyang Heyan Technology, SLTL Group, Suzhou Delphi Laser Co. Ltd., Synova SA, TOKYO SEIMITSU CO. LTD., Veeco Instruments Inc. and GL Tech Co. Ltd.

Market Research Insights

  • Market dynamics are increasingly shaped by the push for greater manufacturing efficiency and yield improvement. The adoption of advanced singulation technology and automated process control has demonstrated the ability to reduce defect rates by over 15%, directly enhancing profitability.
  • As manufacturers confront the challenges of brittle material cutting, particularly for glass wafer dicing and ceramic substrate dicing, a clear shift toward specialized solutions is evident. This transition is not merely about new hardware but involves a holistic dicing process optimization approach, which has been shown to improve throughput by up to 20% in high-volume settings.
  • The emphasis on thin wafer handling and blade wear monitoring further reflects a strategic focus on maximizing asset utilization and reducing the total cost of ownership across production lines.

We can help! Our analysts can customize this dicing equipment market research report to meet your requirements.

Get in touch

1. Executive Summary

1.1 Market overview

Executive Summary - Chart on Market Overview
Executive Summary - Data Table on Market Overview
Executive Summary - Chart on Global Market Characteristics
Executive Summary - Chart on Market by Geography
Executive Summary - Chart on Market Segmentation by End-user
Executive Summary - Chart on Market Segmentation by Type
Executive Summary - Chart on Market Segmentation by Technology
Executive Summary - Chart on Incremental Growth
Executive Summary - Data Table on Incremental Growth
Executive Summary - Chart on Company Market Positioning

2. Technavio Analysis

2.1 Analysis of price sensitivity, lifecycle, customer purchase basket, adoption rates, and purchase criteria

2.2 Criticality of inputs and Factors of differentiation

Chart on Overview on criticality of inputs and factors of differentiation

2.3 Factors of disruption

Chart on Overview on factors of disruption

2.4 Impact of drivers and challenges

Chart on Impact of drivers and challenges in 2025 and 2030

3. Market Landscape

3.1 Market ecosystem

Chart on Parent Market
Data Table on - Parent Market

3.2 Market characteristics

Chart on Market characteristics analysis

3.3 Value chain analysis

Chart on Value chain analysis

4. Market Sizing

4.1 Market definition

Data Table on Offerings of companies included in the market definition

4.2 Market segment analysis

Market segments

4.3 Market size 2025

4.4 Market outlook: Forecast for 2025-2030

Chart on Global - Market size and forecast 2025-2030 ($ million)
Data Table on Global - Market size and forecast 2025-2030 ($ million)
Chart on Global Market: Year-over-year growth 2025-2030 (%)
Data Table on Global Market: Year-over-year growth 2025-2030 (%)

5. Historic Market Size

5.1 Global Dicing Equipment Market 2020 - 2024

Historic Market Size - Data Table on Global Dicing Equipment Market 2020 - 2024 ($ million)

5.2 End-user segment analysis 2020 - 2024

Historic Market Size - End-user Segment 2020 - 2024 ($ million)

5.3 Type segment analysis 2020 - 2024

Historic Market Size - Type Segment 2020 - 2024 ($ million)

5.4 Technology segment analysis 2020 - 2024

Historic Market Size - Technology Segment 2020 - 2024 ($ million)

5.5 Geography segment analysis 2020 - 2024

Historic Market Size - Geography Segment 2020 - 2024 ($ million)

5.6 Country segment analysis 2020 - 2024

Historic Market Size - Country Segment 2020 - 2024 ($ million)

6. Qualitative Analysis

6.1 The AI impact on Global Dicing Equipment Market

7. Five Forces Analysis

7.1 Five forces summary

Five forces analysis - Comparison between 2025 and 2030

7.2 Bargaining power of buyers

Bargaining power of buyers - Impact of key factors 2025 and 2030

7.3 Bargaining power of suppliers

Bargaining power of suppliers - Impact of key factors in 2025 and 2030

7.4 Threat of new entrants

Threat of new entrants - Impact of key factors in 2025 and 2030

7.5 Threat of substitutes

Threat of substitutes - Impact of key factors in 2025 and 2030

7.6 Threat of rivalry

Threat of rivalry - Impact of key factors in 2025 and 2030

7.7 Market condition

Chart on Market condition - Five forces 2025 and 2030

8. Market Segmentation by End-user

8.1 Market segments

Chart on End-user - Market share 2025-2030 (%)
Data Table on End-user - Market share 2025-2030 (%)

8.2 Comparison by End-user

Chart on Comparison by End-user
Data Table on Comparison by End-user

8.3 Pureplay foundries - Market size and forecast 2025-2030

Chart on Pureplay foundries - Market size and forecast 2025-2030 ($ million)
Data Table on Pureplay foundries - Market size and forecast 2025-2030 ($ million)
Chart on Pureplay foundries - Year-over-year growth 2025-2030 (%)
Data Table on Pureplay foundries - Year-over-year growth 2025-2030 (%)

8.4 Integrated device manufacturers - Market size and forecast 2025-2030

Chart on Integrated device manufacturers - Market size and forecast 2025-2030 ($ million)
Data Table on Integrated device manufacturers - Market size and forecast 2025-2030 ($ million)
Chart on Integrated device manufacturers - Year-over-year growth 2025-2030 (%)
Data Table on Integrated device manufacturers - Year-over-year growth 2025-2030 (%)

8.5 Market opportunity by End-user

Market opportunity by End-user ($ million)
Data Table on Market opportunity by End-user ($ million)

9. Market Segmentation by Type

9.1 Market segments

Chart on Type - Market share 2025-2030 (%)
Data Table on Type - Market share 2025-2030 (%)

9.2 Comparison by Type

Chart on Comparison by Type
Data Table on Comparison by Type

9.3 Blade dicing equipment - Market size and forecast 2025-2030

Chart on Blade dicing equipment - Market size and forecast 2025-2030 ($ million)
Data Table on Blade dicing equipment - Market size and forecast 2025-2030 ($ million)
Chart on Blade dicing equipment - Year-over-year growth 2025-2030 (%)
Data Table on Blade dicing equipment - Year-over-year growth 2025-2030 (%)

9.4 Laser dicing equipment - Market size and forecast 2025-2030

Chart on Laser dicing equipment - Market size and forecast 2025-2030 ($ million)
Data Table on Laser dicing equipment - Market size and forecast 2025-2030 ($ million)
Chart on Laser dicing equipment - Year-over-year growth 2025-2030 (%)
Data Table on Laser dicing equipment - Year-over-year growth 2025-2030 (%)

9.5 Plasma dicing equipment - Market size and forecast 2025-2030

Chart on Plasma dicing equipment - Market size and forecast 2025-2030 ($ million)
Data Table on Plasma dicing equipment - Market size and forecast 2025-2030 ($ million)
Chart on Plasma dicing equipment - Year-over-year growth 2025-2030 (%)
Data Table on Plasma dicing equipment - Year-over-year growth 2025-2030 (%)

9.6 Market opportunity by Type

Market opportunity by Type ($ million)
Data Table on Market opportunity by Type ($ million)

10. Market Segmentation by Technology

10.1 Market segments

Chart on Technology - Market share 2025-2030 (%)
Data Table on Technology - Market share 2025-2030 (%)

10.2 Comparison by Technology

Chart on Comparison by Technology
Data Table on Comparison by Technology

10.3 Automated dicing systems - Market size and forecast 2025-2030

Chart on Automated dicing systems - Market size and forecast 2025-2030 ($ million)
Data Table on Automated dicing systems - Market size and forecast 2025-2030 ($ million)
Chart on Automated dicing systems - Year-over-year growth 2025-2030 (%)
Data Table on Automated dicing systems - Year-over-year growth 2025-2030 (%)

10.4 Manual dicing - Market size and forecast 2025-2030

Chart on Manual dicing - Market size and forecast 2025-2030 ($ million)
Data Table on Manual dicing - Market size and forecast 2025-2030 ($ million)
Chart on Manual dicing - Year-over-year growth 2025-2030 (%)
Data Table on Manual dicing - Year-over-year growth 2025-2030 (%)

10.5 Market opportunity by Technology

Market opportunity by Technology ($ million)
Data Table on Market opportunity by Technology ($ million)

11. Customer Landscape

11.1 Customer landscape overview

Analysis of price sensitivity, lifecycle, customer purchase basket, adoption rates, and purchase criteria

12. Geographic Landscape

12.1 Geographic segmentation

Chart on Market share by geography 2025-2030 (%)
Data Table on Market share by geography 2025-2030 (%)

12.2 Geographic comparison

Chart on Geographic comparison
Data Table on Geographic comparison

12.3 APAC - Market size and forecast 2025-2030

Chart on APAC - Market size and forecast 2025-2030 ($ million)
Data Table on APAC - Market size and forecast 2025-2030 ($ million)
Chart on APAC - Year-over-year growth 2025-2030 (%)
Data Table on APAC - Year-over-year growth 2025-2030 (%)
Chart on Regional Comparison - APAC
Data Table on Regional Comparison - APAC

12.3.1 China - Market size and forecast 2025-2030

Chart on China - Market size and forecast 2025-2030 ($ million)
Data Table on China - Market size and forecast 2025-2030 ($ million)
Chart on China - Year-over-year growth 2025-2030 (%)
Data Table on China - Year-over-year growth 2025-2030 (%)

12.3.2 Japan - Market size and forecast 2025-2030

Chart on Japan - Market size and forecast 2025-2030 ($ million)
Data Table on Japan - Market size and forecast 2025-2030 ($ million)
Chart on Japan - Year-over-year growth 2025-2030 (%)
Data Table on Japan - Year-over-year growth 2025-2030 (%)

12.3.3 India - Market size and forecast 2025-2030

Chart on India - Market size and forecast 2025-2030 ($ million)
Data Table on India - Market size and forecast 2025-2030 ($ million)
Chart on India - Year-over-year growth 2025-2030 (%)
Data Table on India - Year-over-year growth 2025-2030 (%)

12.3.4 South Korea - Market size and forecast 2025-2030

Chart on South Korea - Market size and forecast 2025-2030 ($ million)
Data Table on South Korea - Market size and forecast 2025-2030 ($ million)
Chart on South Korea - Year-over-year growth 2025-2030 (%)
Data Table on South Korea - Year-over-year growth 2025-2030 (%)

12.3.5 Australia - Market size and forecast 2025-2030

Chart on Australia - Market size and forecast 2025-2030 ($ million)
Data Table on Australia - Market size and forecast 2025-2030 ($ million)
Chart on Australia - Year-over-year growth 2025-2030 (%)
Data Table on Australia - Year-over-year growth 2025-2030 (%)

12.3.6 Indonesia - Market size and forecast 2025-2030

Chart on Indonesia - Market size and forecast 2025-2030 ($ million)
Data Table on Indonesia - Market size and forecast 2025-2030 ($ million)
Chart on Indonesia - Year-over-year growth 2025-2030 (%)
Data Table on Indonesia - Year-over-year growth 2025-2030 (%)

12.4 North America - Market size and forecast 2025-2030

Chart on North America - Market size and forecast 2025-2030 ($ million)
Data Table on North America - Market size and forecast 2025-2030 ($ million)
Chart on North America - Year-over-year growth 2025-2030 (%)
Data Table on North America - Year-over-year growth 2025-2030 (%)
Chart on Regional Comparison - North America
Data Table on Regional Comparison - North America

12.4.1 US - Market size and forecast 2025-2030

Chart on US - Market size and forecast 2025-2030 ($ million)
Data Table on US - Market size and forecast 2025-2030 ($ million)
Chart on US - Year-over-year growth 2025-2030 (%)
Data Table on US - Year-over-year growth 2025-2030 (%)

12.4.2 Canada - Market size and forecast 2025-2030

Chart on Canada - Market size and forecast 2025-2030 ($ million)
Data Table on Canada - Market size and forecast 2025-2030 ($ million)
Chart on Canada - Year-over-year growth 2025-2030 (%)
Data Table on Canada - Year-over-year growth 2025-2030 (%)

12.4.3 Mexico - Market size and forecast 2025-2030

Chart on Mexico - Market size and forecast 2025-2030 ($ million)
Data Table on Mexico - Market size and forecast 2025-2030 ($ million)
Chart on Mexico - Year-over-year growth 2025-2030 (%)
Data Table on Mexico - Year-over-year growth 2025-2030 (%)

12.5 Europe - Market size and forecast 2025-2030

Chart on Europe - Market size and forecast 2025-2030 ($ million)
Data Table on Europe - Market size and forecast 2025-2030 ($ million)
Chart on Europe - Year-over-year growth 2025-2030 (%)
Data Table on Europe - Year-over-year growth 2025-2030 (%)
Chart on Regional Comparison - Europe
Data Table on Regional Comparison - Europe

12.5.1 Germany - Market size and forecast 2025-2030

Chart on Germany - Market size and forecast 2025-2030 ($ million)
Data Table on Germany - Market size and forecast 2025-2030 ($ million)
Chart on Germany - Year-over-year growth 2025-2030 (%)
Data Table on Germany - Year-over-year growth 2025-2030 (%)

12.5.2 UK - Market size and forecast 2025-2030

Chart on UK - Market size and forecast 2025-2030 ($ million)
Data Table on UK - Market size and forecast 2025-2030 ($ million)
Chart on UK - Year-over-year growth 2025-2030 (%)
Data Table on UK - Year-over-year growth 2025-2030 (%)

12.5.3 France - Market size and forecast 2025-2030

Chart on France - Market size and forecast 2025-2030 ($ million)
Data Table on France - Market size and forecast 2025-2030 ($ million)
Chart on France - Year-over-year growth 2025-2030 (%)
Data Table on France - Year-over-year growth 2025-2030 (%)

12.5.4 Italy - Market size and forecast 2025-2030

Chart on Italy - Market size and forecast 2025-2030 ($ million)
Data Table on Italy - Market size and forecast 2025-2030 ($ million)
Chart on Italy - Year-over-year growth 2025-2030 (%)
Data Table on Italy - Year-over-year growth 2025-2030 (%)

12.5.5 Spain - Market size and forecast 2025-2030

Chart on Spain - Market size and forecast 2025-2030 ($ million)
Data Table on Spain - Market size and forecast 2025-2030 ($ million)
Chart on Spain - Year-over-year growth 2025-2030 (%)
Data Table on Spain - Year-over-year growth 2025-2030 (%)

12.5.6 The Netherlands - Market size and forecast 2025-2030

Chart on The Netherlands - Market size and forecast 2025-2030 ($ million)
Data Table on The Netherlands - Market size and forecast 2025-2030 ($ million)
Chart on The Netherlands - Year-over-year growth 2025-2030 (%)
Data Table on The Netherlands - Year-over-year growth 2025-2030 (%)

12.6 South America - Market size and forecast 2025-2030

Chart on South America - Market size and forecast 2025-2030 ($ million)
Data Table on South America - Market size and forecast 2025-2030 ($ million)
Chart on South America - Year-over-year growth 2025-2030 (%)
Data Table on South America - Year-over-year growth 2025-2030 (%)
Chart on Regional Comparison - South America
Data Table on Regional Comparison - South America

12.6.1 Brazil - Market size and forecast 2025-2030

Chart on Brazil - Market size and forecast 2025-2030 ($ million)
Data Table on Brazil - Market size and forecast 2025-2030 ($ million)
Chart on Brazil - Year-over-year growth 2025-2030 (%)
Data Table on Brazil - Year-over-year growth 2025-2030 (%)

12.6.2 Argentina - Market size and forecast 2025-2030

Chart on Argentina - Market size and forecast 2025-2030 ($ million)
Data Table on Argentina - Market size and forecast 2025-2030 ($ million)
Chart on Argentina - Year-over-year growth 2025-2030 (%)
Data Table on Argentina - Year-over-year growth 2025-2030 (%)

12.6.3 Chile - Market size and forecast 2025-2030

Chart on Chile - Market size and forecast 2025-2030 ($ million)
Data Table on Chile - Market size and forecast 2025-2030 ($ million)
Chart on Chile - Year-over-year growth 2025-2030 (%)
Data Table on Chile - Year-over-year growth 2025-2030 (%)

12.7 Middle East and Africa - Market size and forecast 2025-2030

Chart on Middle East and Africa - Market size and forecast 2025-2030 ($ million)
Data Table on Middle East and Africa - Market size and forecast 2025-2030 ($ million)
Chart on Middle East and Africa - Year-over-year growth 2025-2030 (%)
Data Table on Middle East and Africa - Year-over-year growth 2025-2030 (%)
Chart on Regional Comparison - Middle East and Africa
Data Table on Regional Comparison - Middle East and Africa

12.7.1 Saudi Arabia - Market size and forecast 2025-2030

Chart on Saudi Arabia - Market size and forecast 2025-2030 ($ million)
Data Table on Saudi Arabia - Market size and forecast 2025-2030 ($ million)
Chart on Saudi Arabia - Year-over-year growth 2025-2030 (%)
Data Table on Saudi Arabia - Year-over-year growth 2025-2030 (%)

12.7.2 UAE - Market size and forecast 2025-2030

Chart on UAE - Market size and forecast 2025-2030 ($ million)
Data Table on UAE - Market size and forecast 2025-2030 ($ million)
Chart on UAE - Year-over-year growth 2025-2030 (%)
Data Table on UAE - Year-over-year growth 2025-2030 (%)

12.7.3 South Africa - Market size and forecast 2025-2030

Chart on South Africa - Market size and forecast 2025-2030 ($ million)
Data Table on South Africa - Market size and forecast 2025-2030 ($ million)
Chart on South Africa - Year-over-year growth 2025-2030 (%)
Data Table on South Africa - Year-over-year growth 2025-2030 (%)

12.7.4 Israel - Market size and forecast 2025-2030

Chart on Israel - Market size and forecast 2025-2030 ($ million)
Data Table on Israel - Market size and forecast 2025-2030 ($ million)
Chart on Israel - Year-over-year growth 2025-2030 (%)
Data Table on Israel - Year-over-year growth 2025-2030 (%)

12.7.5 Turkey - Market size and forecast 2025-2030

Chart on Turkey - Market size and forecast 2025-2030 ($ million)
Data Table on Turkey - Market size and forecast 2025-2030 ($ million)
Chart on Turkey - Year-over-year growth 2025-2030 (%)
Data Table on Turkey - Year-over-year growth 2025-2030 (%)

12.8 Market opportunity by geography

Market opportunity by geography ($ million)
Data Tables on Market opportunity by geography ($ million)

13. Drivers, Challenges, and Opportunity

13.1 Market drivers

Growing investment in fabrication facilities
Increase in demand from automotive industry
Increase in number of fabless semiconductor companies

13.2 Market challenges

Complexity of patterns and functional defects in manufacturing processes
High initial investment
Rapid technological changes associated with dicing equipment

13.3 Impact of drivers and challenges

Impact of drivers and challenges in 2025 and 2030

13.4 Market opportunities

Growing demand for IoT-connected devices
Increasing number of strategic partnerships and acquisitions
Increasing focus on large diameter wafer size

14. Competitive Landscape

14.1 Overview

14.2

Overview on criticality of inputs and factors of differentiation

14.3 Landscape disruption

Overview on factors of disruption

14.4 Industry risks

Impact of key risks on business

15. Competitive Analysis

15.1 Companies profiled

Companies covered

15.2 Company ranking index

15.3 Market positioning of companies

Matrix on companies position and classification

15.4 3D Micromac AG

3D Micromac AG - Overview
3D Micromac AG - Product / Service
3D Micromac AG - Key offerings
SWOT

15.5 Advanced Dicing Technologies

Advanced Dicing Technologies - Overview
Advanced Dicing Technologies - Product / Service
Advanced Dicing Technologies - Key offerings
SWOT

15.6 ASMPT ALSI

ASMPT ALSI - Overview
ASMPT ALSI - Product / Service
ASMPT ALSI - Key offerings
SWOT

15.7 DISCO Corp.

DISCO Corp. - Overview
DISCO Corp. - Business segments
DISCO Corp. - Key offerings
DISCO Corp. - Segment focus
SWOT

15.8 Jiangsu Jing Chuang Co. Ltd.

Jiangsu Jing Chuang Co. Ltd. - Overview
Jiangsu Jing Chuang Co. Ltd. - Product / Service
Jiangsu Jing Chuang Co. Ltd. - Key offerings
SWOT

15.9 KLA Corp.

KLA Corp. - Overview
KLA Corp. - Business segments
KLA Corp. - Key offerings
KLA Corp. - Segment focus
SWOT

15.10 Marposs Spa

Marposs Spa - Overview
Marposs Spa - Product / Service
Marposs Spa - Key offerings
SWOT

15.11 Neon Tech Co. Ltd.

Neon Tech Co. Ltd. - Overview
Neon Tech Co. Ltd. - Product / Service
Neon Tech Co. Ltd. - Key offerings
SWOT

15.12 Panasonic Connect Co. Ltd.

Panasonic Connect Co. Ltd. - Overview
Panasonic Connect Co. Ltd. - Product / Service
Panasonic Connect Co. Ltd. - Key offerings
SWOT

15.13 PLASMA THERM

PLASMA THERM - Overview
PLASMA THERM - Product / Service
PLASMA THERM - Key offerings
SWOT

15.14 Shenyang Heyan Technology

Shenyang Heyan Technology - Overview
Shenyang Heyan Technology - Product / Service
Shenyang Heyan Technology - Key offerings
SWOT

15.15 Suzhou Delphi Laser Co. Ltd.

Suzhou Delphi Laser Co. Ltd. - Overview
Suzhou Delphi Laser Co. Ltd. - Product / Service
Suzhou Delphi Laser Co. Ltd. - Key offerings
SWOT

15.16 Synova SA

Synova SA - Overview
Synova SA - Product / Service
Synova SA - Key offerings
SWOT

15.17 Veeco Instruments Inc.

Veeco Instruments Inc. - Overview
Veeco Instruments Inc. - Product / Service
Veeco Instruments Inc. - Key offerings
SWOT

15.18 GL Tech Co. Ltd.

GL Tech Co. Ltd. - Overview
GL Tech Co. Ltd. - Product / Service
GL Tech Co. Ltd. - Key offerings
SWOT

16. Appendix

16.1 Scope of the report

Market definition
Objectives
Notes and caveats

16.2 Inclusions and exclusions checklist

Inclusions checklist
Exclusions checklist

16.3 Currency conversion rates for US$

16.4 Research methodology

16.5 Data procurement

Information sources

16.6 Data validation

16.7 Validation techniques employed for market sizing

16.8 Data synthesis

16.9 360 degree market analysis

16.10 List of abbreviations

Research Methodology

Technavio presents a detailed picture of the market by way of study, synthesis, and summation of data from multiple sources. The analysts have presented the various facets of the market with a particular focus on identifying the key industry influencers. The data thus presented is comprehensive, reliable, and the result of extensive research, both primary and secondary.

INFORMATION SOURCES

Primary sources

  • Manufacturers and suppliers
  • Channel partners
  • Industry experts
  • Strategic decision makers

Secondary sources

  • Industry journals and periodicals
  • Government data
  • Financial reports of key industry players
  • Historical data
  • Press releases

DATA ANALYSIS

Data Synthesis

  • Collation of data
  • Estimation of key figures
  • Analysis of derived insights

Data Validation

  • Triangulation with data models
  • Reference against proprietary databases
  • Corroboration with industry experts

REPORT WRITING

Qualitative

  • Market drivers
  • Market challenges
  • Market trends
  • Five forces analysis

Quantitative

  • Market size and forecast
  • Market segmentation
  • Geographical insights
  • Competitive landscape

Interested in this report?

Get your sample now to see our research methodology and insights!

Download Now

Frequently Asked Questions

Dicing Equipment market growth will increase by USD 269.1 million during 2026-2030.

The Dicing Equipment market is expected to grow at a CAGR of 4.7% during 2026-2030.

Dicing Equipment market is segmented by End-user (Pureplay foundries, Integrated device manufacturers) Type (Blade dicing equipment, Laser dicing equipment, Plasma dicing equipment) Technology (Automated dicing systems, Manual dicing)

3D Micromac AG, Advanced Dicing Technologies, ASMPT ALSI, DISCO Corp., Jiangsu Jing Chuang Co. Ltd., KLA Corp., Marposs Spa, MTINC Machines, Neon Tech Co. Ltd., Panasonic Connect Co. Ltd., PLASMA THERM, Shenyang Heyan Technology, SLTL Group, Suzhou Delphi Laser Co. Ltd., Synova SA, TOKYO SEIMITSU CO. LTD., Veeco Instruments Inc., GL Tech Co. Ltd. are a few of the key vendors in the Dicing Equipment market.

APAC will register the highest growth rate of 86.1% among the other regions. Therefore, the Dicing Equipment market in APAC is expected to garner significant business opportunities for the vendors during the forecast period.

China, Japan, India, South Korea, Australia, Indonesia, US, Canada, Mexico, Germany, UK, France, Italy, Spain, The Netherlands, Brazil, Argentina, Chile, Saudi Arabia, UAE, South Africa, Israel, Turkey

  • Growing investment in fabrication facilities is the driving factor this market.

The Dicing Equipment market vendors should focus on grabbing business opportunities from the End-user segment as it accounted for the largest market share in the base year.