Diet Food And Beverage Market Size 2024-2028
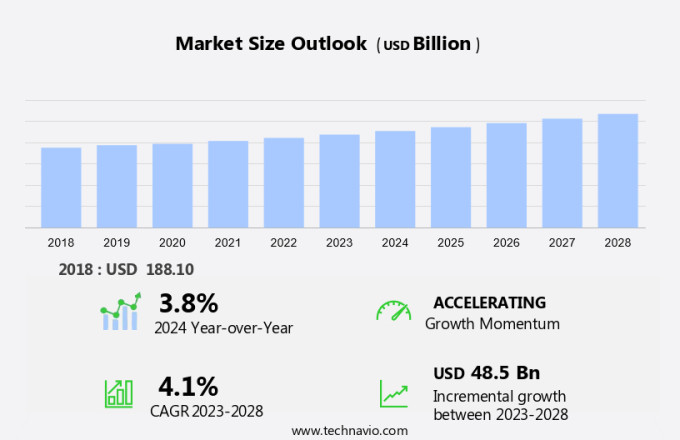
The diet food and beverage market size is forecast to increase by USD 48.5 billion at a CAGR of 4.1% between 2023 and 2028.
- The demand for diet foods and beverages continues to grow as consumers prioritize healthy lifestyles and weight loss programs. Key trends include the development of low-calorie and low-sodium options, as well as the increasing popularity of meal replacements and dietary supplements. The geriatric population, particularly those with high blood pressure, also represents a significant market opportunity.
- Large supermarkets dominate the retail landscape, offering a wide range of dietary solutions. The market growth is driven by the high prevalence of obesity and the increasing awareness of the health risks associated with unhealthy diets. Companies are responding with new product launches to meet the evolving needs of consumers. This market analysis report provides an in-depth examination of these trends and the challenges they present to market participants.
What will be the Size of the Market During the Forecast Period?
- The market is witnessing significant growth due to the increasing awareness of healthier consumption choices among consumers. With the prevalence of obesity, diabetes, high blood pressure, and other non-communicable diseases, there is a growing demand for nutritious and diet-friendly options. Teenagers and the elderly population are two significant demographics driving the demand for diet food and beverages. Teenagers are becoming more health-conscious and are looking for low-calorie and nutrient-rich foods to maintain an active lifestyle. The elderly population, on the other hand, requires dietary modifications due to age-related health issues and chronic conditions.
- The market for healthy diet food and beverages is expanding, with an emphasis on nutritionally balanced options. Low-calorie, low-sodium meal replacements, and dietary supplements are gaining popularity among consumers looking to manage their weight and maintain optimal health. Nutritional beverages, such as fruit juices, are also in high demand due to their convenience and nutritional benefits. Functional food and fortified products are becoming increasingly popular in the diet food and beverage market. These products offer additional health benefits beyond basic nutrition, making them an attractive option for consumers seeking to improve their overall wellness. Healthy snacks, such as low-calorie, non-GMO food options, are also gaining traction as consumers look for convenient and nutritious alternatives to traditional snack foods.
How is this market segmented and which is the largest segment?
The market research report provides comprehensive data (region-wise segment analysis), with forecasts and estimates in "USD billion" for the period 2024-2028, as well as historical data from 2018-2022 for the following segments.
- Product Type
- Diet food
- Diet beverage
- Distribution Channel
- Offline
- Online
- Geography
- North America
- Canada
- US
- APAC
- China
- India
- Japan
- South Korea
- Europe
- Germany
- UK
- France
- Spain
- South America
- Middle East and Africa
- North America
By Product Type Insights
- The diet food segment is estimated to witness significant growth during the forecast period.
The diet food sector within the market is experiencing significant growth due to increasing consumer preference for nutritiously balanced dietary choices that cater to active lifestyles and disease prevention. This trend is reflected in the latest innovation from Medifast, which launched new high-protein, low-calorie meal replacement bars in August 2023. These bars offer a convenient solution for individuals following weight loss programs, seamlessly integrating with Medifast's 5 & 1 Plan.
Further, Consumers can replace up to five meals per day with these bars, complemented by one Lean and Green meal consisting of lean protein and fruits and vegetables. This plan ensures a balanced diet while supporting weight loss goals. Grocery stores, specialty retailers, online sales, and direct sales channels continue to be key distribution channels for diet food and beverage products in the United States. The prevalence of non-communicable diseases such as obesity, diabetes, and cardiovascular diseases further fuels the demand for nutritiously balanced dietary options.
Get a glance at the market report of share of various segments Request Free Sample
The diet food segment was valued at USD 120.90 billion in 2018 and showed a gradual increase during the forecast period.
Regional Analysis
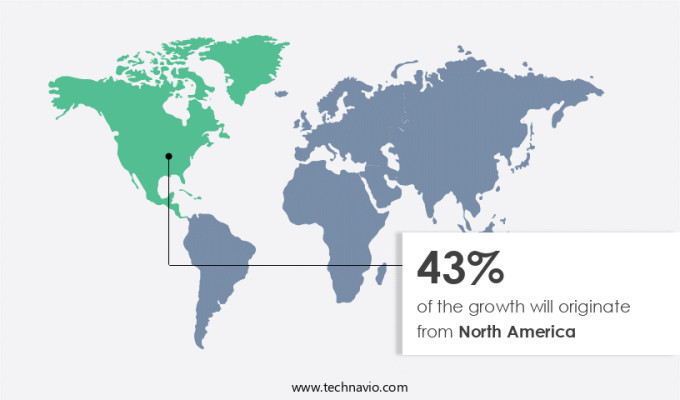
- North America is estimated to contribute 43% to the growth of the global market during the forecast period.
Technavio's analysts have elaborately explained the regional trends and drivers that shape the market during the forecast period.
For more insights on the market share of various regions Request Free Sample
The market in North America is driven by the growing concern for weight loss and maintaining a healthy diet among various demographics, including teenagers and the elderly population. Chronic conditions such as obesity, high blood pressure, and diabetes are prevalent issues in the US, leading to increased demand for nutritious food and beverage options. Public health initiatives are playing a significant role in shaping consumer preferences toward healthier choices. For instance, cities and states are imposing taxes on sugary drinks to curb their consumption and generate revenue for essential services, particularly in low-income communities disproportionately affected by these health issues.
This approach aims to improve overall health and well-being while reducing the burden on healthcare systems. The diet food and beverage industry is expected to continue growing as consumers prioritize their health and seek convenient, nutritious options.
Market Dynamics
Our researchers analyzed the data with 2023 as the base year, along with the key drivers, trends, and challenges. A holistic analysis of drivers will help companies refine their marketing strategies to gain a competitive advantage.
What are the key market drivers leading to the rise in adoption of Diet Food And Beverage Market?
The high prevalence of obesity is the key driver of the market.
- The market is significantly driven by the increasing prevalence of chronic illnesses such as heart disease, cancer, and stroke, which are linked to poor nutrition and sedentary lifestyles. According to the Centers for Disease Control and Prevention (CDC), more than 130 million adults in the US are overweight or obese, accounting for over 60% of the adult population. This trend is a major concern, as obesity increases the risk of developing these conditions. Nutritional beverages, including fruit juices, have gained popularity as convenient alternatives to unhealthy food choices.
- The American Heart Association and the American Cancer Society recommend limiting added sugars, saturated and trans fats, and sodium intake. As a result, consumers are turning to diet drinks and foods that cater to these dietary needs. The diet food and beverage market is expected to continue growing as more individuals prioritize their health and wellness. Thus, such factors are driving the growth of the market during the forecast period.
What are the market trends shaping the Diet Food And Beverage Market?
New product launches is the upcoming trend in the market.
- The market is witnessing notable growth due to the increasing emphasis on healthy lifestyles and weight loss programs. Companies are responding to this trend by introducing an array of low-calorie and low-sodium options, catering to the needs of health-conscious consumers. Meal replacements and dietary supplements are also gaining popularity, particularly among the geriatric population and those with conditions like high blood pressure. Large supermarkets are a significant distribution channel for these products, ensuring their accessibility to a broad consumer base. In recent years, there has been a focus on using advanced technologies and innovative approaches to create unique and engaging experiences for consumers. For instance,The sandwich market is witnessing notable growth due to the increasing emphasis on healthy lifestyles and weight loss programs. Companies are responding to this trend by introducing an array of low-calorie and low-sodium sandwich options, catering to the needs of health-conscious consumers.
- In addition, the market is undergoing significant transformation, driven by the demand for healthier options and advanced technologies. Companies are leveraging human creativity and artificial intelligence to create engaging experiences for consumers and meet their evolving needs. The trend is expected to continue, with a growing focus on personalization and customization to cater to diverse consumer preferences. Thus, such trends will shape the growth of the market during the forecast period.
What challenges does Diet Food And Beverage Market face during the growth?
The limited availability of diet foods is a key challenge affecting the market growth.
- The market faces challenges in reaching a wide consumer base, particularly in underprivileged communities and rural areas. These groups, which include racial and ethnic minorities, low-income populations, and older adults, often encounter social and environmental barriers that limit their access to healthy dietary options. Consequently, the availability of diet foods and nutritious meal choices, including healthier Sandwiches, is a significant obstacle to market expansion. Moreover, consumers in underserved regions may struggle to obtain specialized diet foods, which can dampen demand for these products. This issue can hinder the growth of the market, as these groups represent a substantial portion of the population
- To address these challenges, market players are focusing on increasing the availability of diet foods with natural ingredients and organic options. This approach aligns with the growing trend towards preventive healthcare and healthy food awareness. However, the higher cost of these products may deter some consumers, limiting their widespread adoption. To expand their reach, companies are exploring various distribution channels, including hospital applications and household delivery services. By making diet foods more accessible, they aim to cater to the needs of consumers who may not have easy access to health-conscious options in their local grocery stores.
Exclusive Customer Landscape
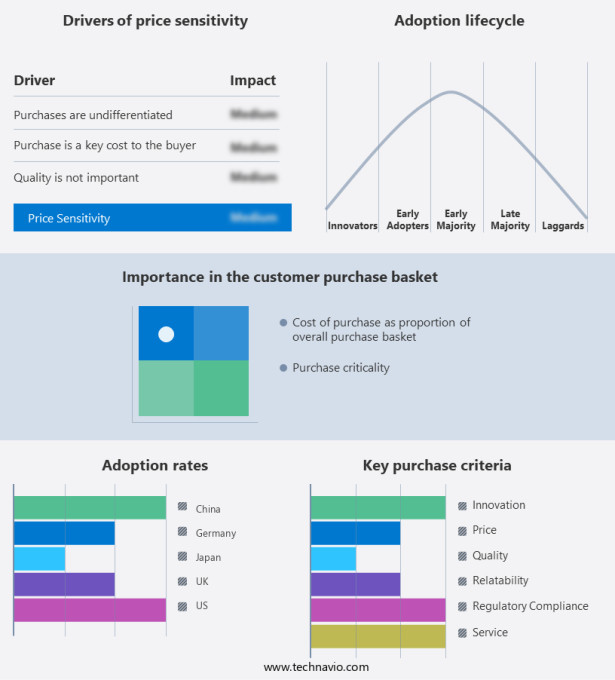
The market forecasting report includes the adoption lifecycle of the market, covering from the innovator's stage to the laggard's stage. It focuses on adoption rates in different regions based on penetration. Furthermore, the market report also includes key purchase criteria and drivers of price sensitivity to help companies evaluate and develop their market growth analysis strategies.
Customer Landscape
Key Companies & Market Insights
Companies are implementing various strategies, such as strategic alliances, market forecast, partnerships, mergers and acquisitions, geographical expansion, and product/service launches, to enhance their presence in the market. The market research and growth report includes detailed analyses of the competitive landscape of the market and information about key companies, including:
- Abbott Laboratories
- Anheuser Busch InBev SA NV
- Archer Daniels Midland Co.
- Cargill Inc.
- Dabur India Ltd.
- General Mills Inc.
- Gujarat Cooperative Milk Marketing Federation Ltd.
- Herbalife International of America Inc.
- JBS SA
- Kellogg Co.
- Mars Inc.
- Medifast Inc.
- Nestle SA
- The Coca Cola Co.
- Tyson Foods Inc.
Qualitative and quantitative analysis of companies has been conducted to help clients understand the wider business environment as well as the strengths and weaknesses of key market players. Data is qualitatively analyzed to categorize companies as pure play, category-focused, industry-focused, and diversified; it is quantitatively analyzed to categorize companies as dominant, leading, strong, tentative, and weak.
Research Analyst Overview
The market caters to individuals seeking nutritious options to maintain a healthy lifestyle or manage chronic illnesses such as obesity, diabetes, and high blood pressure. This market encompasses a wide range of products including meal replacements, diet drinks, nutritional beverages, and functional food. Fruit juices, while rich in vitamins and antioxidants, should be consumed in moderation due to their high sugar content. The elderly population and teenagers are significant consumer groups, with the former requiring nutrient-rich foods for preventive healthcare and the latter focusing on weight loss programs. The prevalence of non-communicable diseases like heart disease, cancer, and stroke fuels the demand for low-calorie, low-sodium, and nutrient-dense foods.
Natural ingredients and organic food are gaining popularity due to their perceived health benefits. High product cost, however, remains a challenge for market growth. Online advertising, sales, and direct selling channels are increasingly used to reach consumers. Large supermarkets, grocery stores, specialty retailers, and hospital applications are key sales channels. Health awareness and active lifestyles drive the market, with consumers seeking meal replacements, dietary supplements, and healthy snacks. Functional food and fortified products cater to specific health needs. Non-GMO, low-fat, and gluten-free options are popular choices. Store-based retailers and fitness institutions are significant market players.
|
Market Scope |
|
|
Report Coverage |
Details |
|
Page number |
203 |
|
Base year |
2023 |
|
Historic period |
2018-2022 |
|
Forecast period |
2024-2028 |
|
Growth momentum & CAGR |
Accelerate at a CAGR of 4.1% |
|
Market growth 2024-2028 |
USD 48.5 billion |
|
Market structure |
Fragmented |
|
YoY growth 2023-2024(%) |
3.8 |
|
Key countries |
US, China, Japan, Germany, UK, India, France, Canada, South Korea, and Spain |
|
Competitive landscape |
Leading Companies, Market Positioning of Companies, Competitive Strategies, and Industry Risks |
What are the Key Data Covered in this Market Research and Growth Report?
- CAGR of the market during the forecast period
- Detailed information on factors that will drive the market growth and forecasting between 2024 and 2028
- Precise estimation of the size of the market and its contribution of the market in focus to the parent market
- Accurate predictions about upcoming market growth and trends and changes in consumer behaviour
- Growth of the market across North America, APAC, Europe, South America, and Middle East and Africa
- Thorough analysis of the market's competitive landscape and detailed information about companies
- Comprehensive analysis of factors that will challenge the growth of market companies
We can help! Our analysts can customize this market research report to meet your requirements. Get in touch


