Digital Biology Market Analysis, Size, and Forecast 2026-2030: North America (US, Canada, and Mexico), Europe (Germany, UK, and France), APAC (China, Japan, and India), South America (Brazil), Middle East and Africa (Saudi Arabia, Turkey, and UAE), Asia, Rest of World (ROW)

Digital Biology Market Analysis, Size, and Forecast 2026-2030:
North America (US, Canada, and Mexico), Europe (Germany, UK, and France), APAC (China, Japan, and India), South America (Brazil), Middle East and Africa (Saudi Arabia, Turkey, and UAE), Asia, Rest of World (ROW)

Published: May 2026 307 Pages SKU: IRTNTR81486

Market Overview at a Glance

$29.88 B
Market Opportunity
20.1%
CAGR 2025 - 2030
35.2%
North America Growth
$6.23 B
Drug discovery segment 2024

Digital Biology Market Size 2026-2030

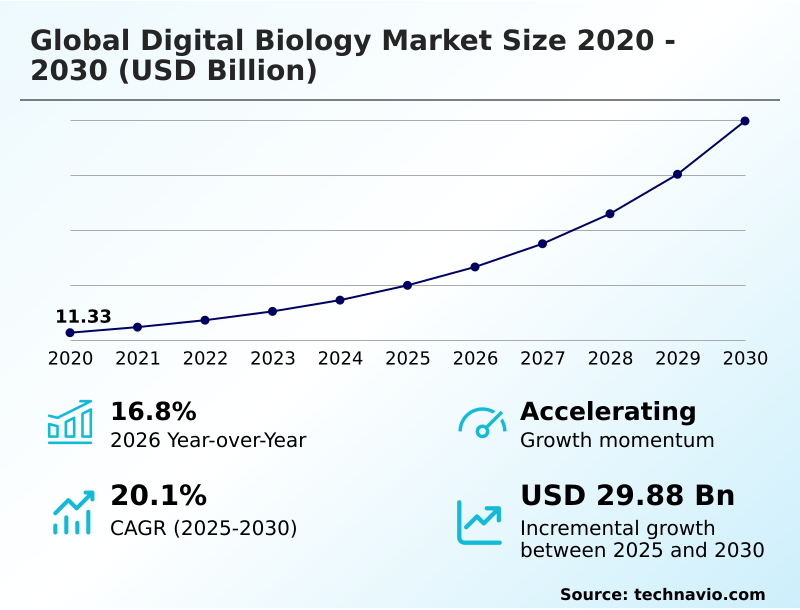
The digital biology market size is valued to increase by USD 29.88 billion, at a CAGR of 20.1% from 2025 to 2030. Integration of AI and ML in genomic sequencing will drive the digital biology market.

Major Market Trends & Insights

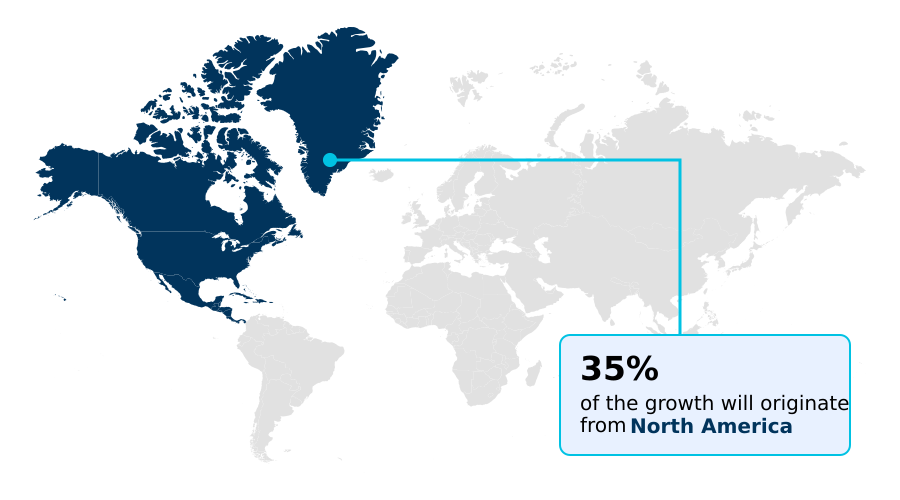
  • North America dominated the market and accounted for a 35.2% growth during the forecast period.
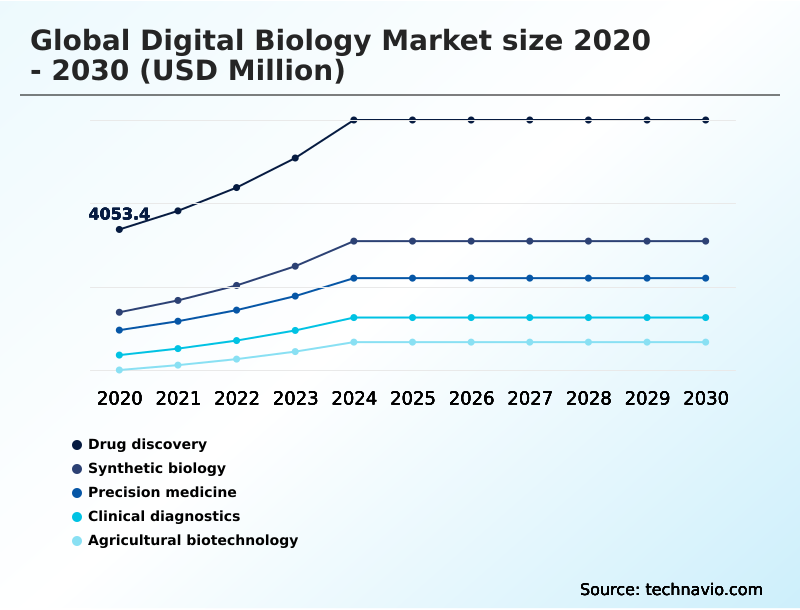
  • By Application - Drug discovery segment was valued at USD 6.23 billion in 2024
  • By End-user - Pharmaceutical companies segment accounted for the largest market revenue share in 2024

Market Size & Forecast

  • Market Opportunities: USD 38.49 billion
  • Market Future Opportunities: USD 29.88 billion
  • CAGR from 2025 to 2030 : 20.1%

Market Summary

  • The digital biology market represents the convergence of computational science and biological research, leveraging AI and machine learning to analyze complex systems. This discipline is driven by the integration of AI in genomic sequencing, which accelerates data processing and enhances predictive accuracy for therapeutic outcomes.
  • Key trends include the expansion of digital twin technology, allowing for in silico trials that de-risk development, and the use of decentralized platforms for enhanced data security.
  • For instance, a pharmaceutical firm can leverage an AI-enabled operating system to model a new compound's interaction with a specific protein structure, predicting its efficacy and potential side effects before committing to expensive lab experiments. This computational approach optimizes the R&D pipeline, reducing development timelines.
  • However, the market faces challenges such as data interoperability limitations between proprietary systems and a significant shortage of multidisciplinary talent. Addressing these issues is crucial for harnessing the full potential of digital biology to innovate in precision medicine and synthetic biology, ultimately transforming healthcare and other life science-dependent industries.

What will be the Size of the Digital Biology Market during the forecast period?

Get Key Insights on Market Forecast (PDF) Get Free Sample

How is the Digital Biology Market Segmented?

The digital biology industry research report provides comprehensive data (region-wise segment analysis), with forecasts and estimates in "USD million" for the period 2026-2030, as well as historical data from 2020-2024 for the following segments.

  • Application
    • Drug discovery
    • Synthetic biology
    • Precision medicine
    • Clinical diagnostics
    • Agricultural biotechnology
  • End-user
    • Pharmaceutical companies
    • Biotechnology companies
    • Research institutes
    • Healthcare providers
    • Agricultural companies
  • Component
    • Solutions
    • Services
  • Geography
    • North America
      • US
      • Canada
      • Mexico
    • Europe
      • Germany
      • UK
      • France
    • Asia
    • Rest of World (ROW)

By Application Insights

The drug discovery segment is estimated to witness significant growth during the forecast period.

The global digital biology market 2026-2030 is revolutionizing drug discovery by integrating advanced computational tools and AI. This shift from traditional lab work to in silico screening of vast chemical libraries against biological targets optimizes resource allocation.

Utilizing high-performance computing and sophisticated bioinformatics pipelines, researchers can now simulate molecular interactions, predicting binding affinity and potential toxicity before physical testing.

This computational approach, incorporating AI-driven drug discovery, significantly narrows the pool of compounds for physical trials, reducing late-stage failures by over 20%.

Digital models also facilitate a deeper understanding of complex biological pathways, empowering scientists to identify novel targets for diseases lacking effective treatments.

These advancements in computational chemistry and molecular dynamics simulations accelerate the entire therapeutic development lifecycle, making it a critical growth segment.

Get Free Sample

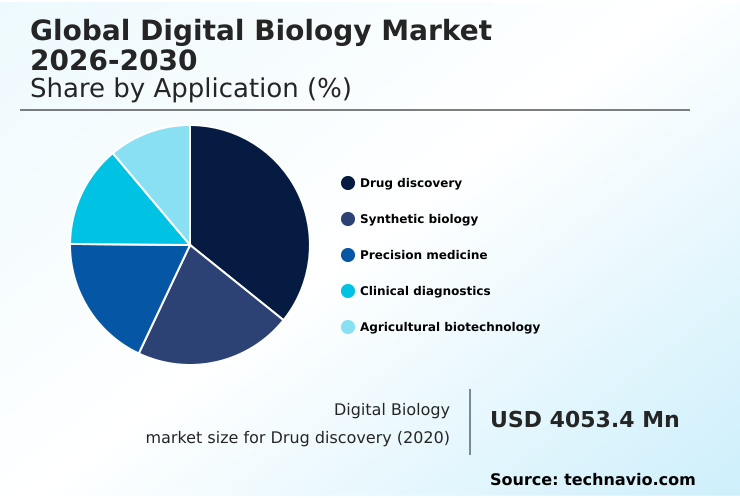
The Drug discovery segment was valued at USD 6.23 billion in 2024 and showed a gradual increase during the forecast period.

Get Free Sample

Regional Analysis

North America is estimated to contribute 35.2% to the growth of the global market during the forecast period.Technavio’s analysts have elaborately explained the regional trends and drivers that shape the market during the forecast period.

See How Digital Biology Market Demand is Rising in North America Get Free Sample

The global digital biology market 2026-2030's geographic landscape is led by North America, which accounts for over 35% of incremental growth, driven by robust funding and advanced research infrastructure. The region excels in applying pharmacogenomics and molecular dynamics simulations.

Meanwhile, Asia is the fastest-growing region, with expansion outpacing others by nearly 3 percentage points, fueled by large-scale genomic initiatives and government investment in high-performance computing.

European markets are characterized by strong regulatory frameworks that foster trust in decentralized science and federated learning models, with applications in in silico screening showing potential to reduce preclinical costs by up to 25%.

This regional diversification, supported by advancements in synthetic gene circuits and AI-driven drug discovery, creates a competitive global ecosystem.

Market Dynamics

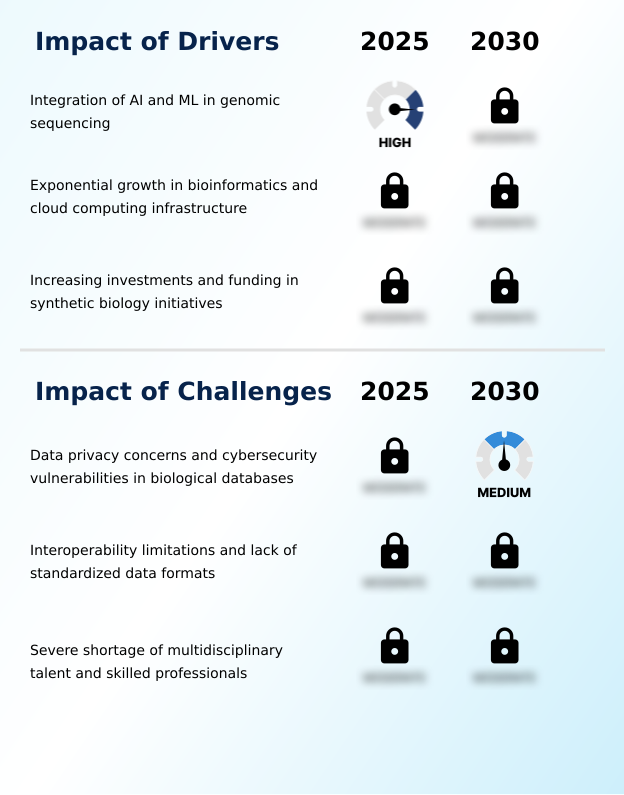
Our researchers analyzed the data with 2025 as the base year, along with the key drivers, trends, and challenges. A holistic analysis of drivers will help companies refine their marketing strategies to gain a competitive advantage.

  • The strategic implementation of digital biology is reshaping life sciences, with AI for drug discovery platforms becoming central to R&D. Companies are increasingly using quantum computing for biology to tackle complex molecular simulations that were previously unsolvable, accelerating the design of novel therapeutics.
  • The emphasis on data integrity is driving the adoption of methods for securing genomic data with blockchain, which provides an immutable and transparent ledger for patient consent and data access. In parallel, the use of digital twins in clinical trials allows for predictive modeling of patient responses, significantly de-risking development and reducing costs.
  • Automating lab workflows with AI is no longer a futuristic concept; it is a practical approach to increasing throughput and reducing human error. This automation allows researchers to focus on higher-value tasks, supported by machine learning in genomic analysis for identifying subtle biomarkers.
  • Furthermore, AI models for drug repurposing are gaining traction, enabling firms to find new applications for existing compounds at a fraction of the cost of de novo discovery. Firms leveraging generative AI for protein design report a two-fold increase in identifying viable candidates compared to traditional methods.
  • These advanced predictive toxicology screening methods and cloud platforms for life sciences are creating a more efficient, precise, and cost-effective paradigm for therapeutic innovation.

What are the key market drivers leading to the rise in the adoption of Digital Biology Industry?

  • The integration of artificial intelligence and machine learning into genomic sequencing workflows is a key driver for market growth.

  • Market growth is primarily driven by the integration of AI and machine learning with next-generation sequencing, a synergy that has accelerated genomic data analysis speeds by over 50%.
  • The exponential growth in bioinformatics and the scalability of cloud-based bioinformatics platforms are also critical drivers, making high-performance computing accessible to startups at a 90% lower upfront cost compared to on-premise infrastructure.
  • This democratization of technology, combined with increasing investments in synthetic biology, fuels innovation in areas like pharmacokinetics and pharmacodynamics modeling.
  • The ability to perform rapid in silico screening and analyze population-level genomic data propels the entire digital biology ecosystem forward, enabling faster and more accurate scientific discoveries.

What are the market trends shaping the Digital Biology Industry?

  • The expansion of digital twin technology within pharmaceutical drug discovery pipelines is emerging as a significant market trend, enabling the virtual simulation of complex biological systems.

  • Key trends in the global digital biology market 2026-2030 are redefining research paradigms. The expansion of digital twin technology is a primary factor, allowing for sophisticated in silico trials that improve predictive accuracy in pharmaceutical R&D by over 25%. This innovation is coupled with the rise of decentralized science, which leverages blockchain to enhance security and patient data sovereignty.
  • Another significant trend is the application of quantum computing to simulate complex biological systems, which reduces molecular simulation times by a factor of 10 compared to classical methods. These advancements, supported by federated learning models and the use of multi-modal clinical data, are transforming how therapeutics are designed and validated, fostering a more efficient and precise development ecosystem.

What challenges does the Digital Biology Industry face during its growth?

  • Data privacy concerns and cybersecurity vulnerabilities associated with biological databases represent a key challenge affecting industry growth.

  • The global digital biology market 2026-2030 faces significant hurdles, primarily data privacy concerns and cybersecurity vulnerabilities in biological databases. The lack of standardized data formats creates interoperability limitations, with internal studies showing these issues can increase project timelines by 15% due to manual data conversion.
  • This fragmentation restricts the seamless analysis of information from automated wet labs and liquid biopsy analysis. Furthermore, a severe shortage of multidisciplinary talent skilled in both biology and computational science creates a critical bottleneck. This talent deficit can inflate data integration costs by up to 40% and hinders the effective use of advanced platforms, constraining overall market expansion and innovation.

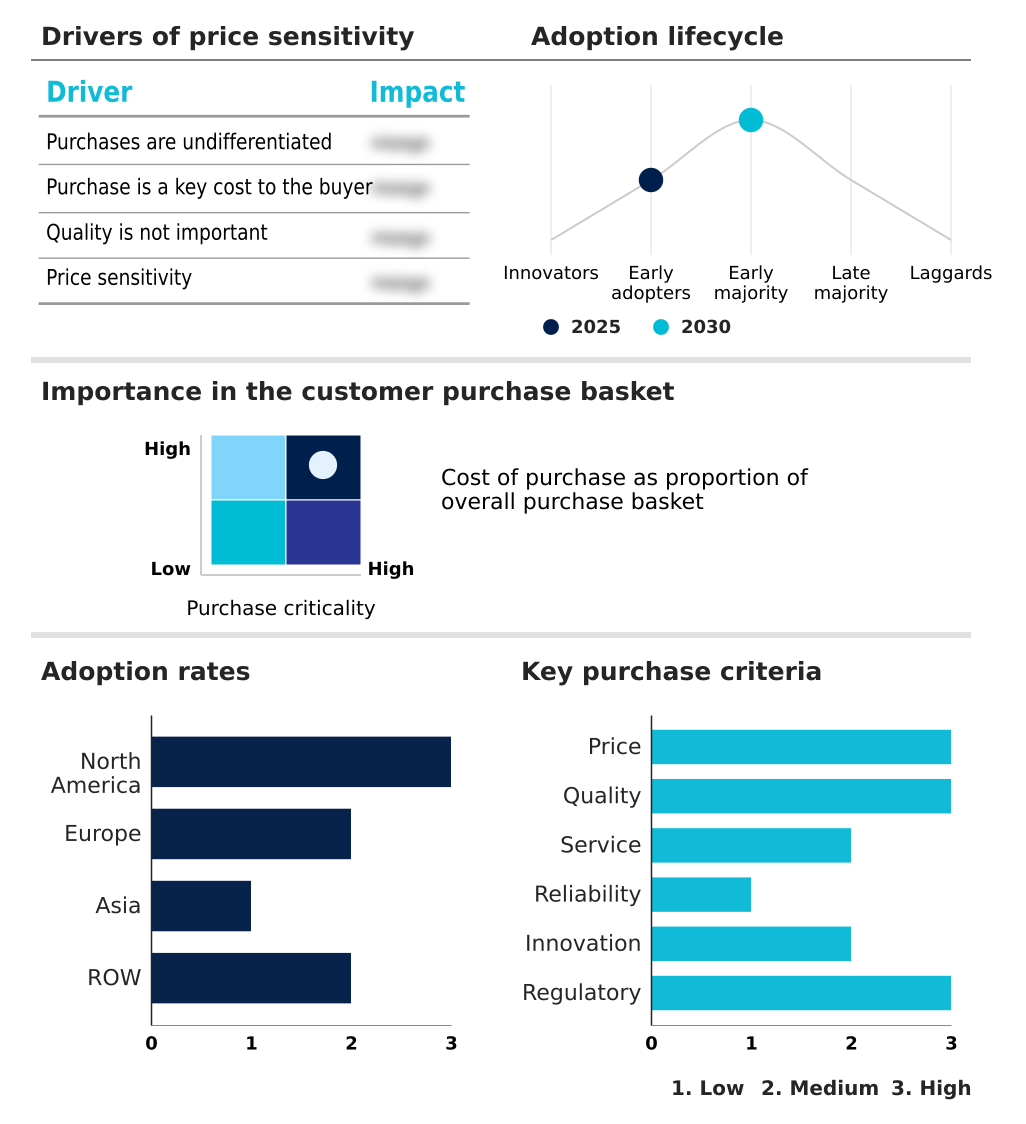
Exclusive Technavio Analysis on Customer Landscape

The digital biology market forecasting report includes the adoption lifecycle of the market, covering from the innovator’s stage to the laggard’s stage. It focuses on adoption rates in different regions based on penetration. Furthermore, the digital biology market report also includes key purchase criteria and drivers of price sensitivity to help companies evaluate and develop their market growth analysis strategies.

Customer Landscape of Digital Biology Industry

Competitive Landscape

Companies are implementing various strategies, such as strategic alliances, digital biology market forecast, partnerships, mergers and acquisitions, geographical expansion, and product/service launches, to enhance their presence in the industry.

10X Genomics Inc. - Offers integrated digital biology solutions combining instruments with bioinformatics software to enable high-resolution mapping and analysis of complex biological systems.

The industry research and growth report includes detailed analyses of the competitive landscape of the market and information about key companies, including:

  • 10X Genomics Inc.
  • AbCellera Biologics Inc.
  • Asimov Inc
  • Benchling Inc.
  • BenevolentAI
  • Cradle
  • DNAnexus Inc.
  • Generate Biomedicines
  • Ginkgo Bioworks Holdings Inc.
  • Illumina Inc.
  • Insilico Medicine
  • Isomorphic Labs
  • Microsoft Corp.
  • NVIDIA Corp.
  • Recursion Pharmaceuticals Inc.
  • Relay Therapeutics Inc.
  • Schrodinger Inc.
  • Tempus AI Inc.
  • Twist Bioscience Corp.
  • Valo Health

Qualitative and quantitative analysis of companies has been conducted to help clients understand the wider business environment as well as the strengths and weaknesses of key industry players. Data is qualitatively analyzed to categorize companies as pure play, category-focused, industry-focused, and diversified; it is quantitatively analyzed to categorize companies as dominant, leading, strong, tentative, and weak.

Recent Development and News in Digital biology market

  • In January 2025, Johnson and Johnson announced the acquisition of Intra-Cellular Therapies in a deal valued at approximately $14.6 billion, strengthening its neuroscience portfolio and highlighting interest in digitally enabled therapeutic development.
  • In February 2025, GeneDx completed its acquisition of Fabric Genomics for up to $51 million, enhancing its AI-driven genomic interpretation and clinical sequencing capabilities for rare disease diagnostics.
  • In April 2025, investment firms including Breyer Capital increased their investments in computational biology and AI-driven life sciences companies, signaling renewed market confidence in AI-native biotech infrastructure.
  • In April 2025, Recursion Pharmaceuticals and Exscientia announced a merger to build an integrated, AI-driven drug discovery platform, unifying phenomics and biological imaging with AI-powered chemistry and precision medicine technologies.

Dive into Technavio’s robust research methodology, blending expert interviews, extensive data synthesis, and validated models for unparalleled Digital Biology Market insights. See full methodology.

Market Scope
Page number 307
Base year 2025
Historic period 2020-2024
Forecast period 2026-2030
Growth momentum & CAGR Accelerate at a CAGR of 20.1%
Market growth 2026-2030 USD 29883.8 million
Market structure Fragmented
YoY growth 2025-2026(%) 16.8%
Key countries US, Canada, Mexico, Germany, UK, France, Italy, Spain, The Netherlands, Russia, China, Japan, India, South Korea, Singapore, Indonesia, Thailand, Australia, Brazil, Saudi Arabia, Turkey, UAE and South Africa
Competitive landscape Leading Companies, Market Positioning of Companies, Competitive Strategies, and Industry Risks

Request Free Sample

Research Analyst Overview

  • The digital biology market is defined by the deep integration of computational power into life sciences, transforming research from a manual, experimental process into a data-driven, predictive discipline. The adoption of digital twin technology is now a critical boardroom decision, directly influencing R&D budgets and strategic portfolio management by enabling in silico trials.
  • This shift is powered by technologies like AI-driven drug discovery, generative biology, and high-performance computing. An AI-enabled operating system allows for the seamless orchestration of automated wet labs and bioinformatics pipelines, while computational chemistry and molecular dynamics simulations provide deep insights into molecular behavior.
  • Firms implementing such integrated systems, which leverage pharmacogenomics and protein structure prediction based on multi-omics research, report a 30% reduction in experimental validation cycles. This efficiency gain underscores the tangible business impact of embracing synthetic gene circuits and advanced computational models in modern therapeutic development.

What are the Key Data Covered in this Digital Biology Market Research and Growth Report?

  • What is the expected growth of the Digital Biology Market between 2026 and 2030?

    • USD 29.88 billion, at a CAGR of 20.1%

  • What segmentation does the market report cover?

    • The report is segmented by Application (Drug discovery, Synthetic biology, Precision medicine, Clinical diagnostics, and Agricultural biotechnology), End-user (Pharmaceutical companies, Biotechnology companies, Research institutes, Healthcare providers, and Agricultural companies), Component (Solutions, and Services) and Geography (North America, Europe, Asia, Rest of World (ROW))

  • Which regions are analyzed in the report?

    • North America, Europe, Asia and Rest of World (ROW)

  • What are the key growth drivers and market challenges?

    • Integration of AI and ML in genomic sequencing , Data privacy concerns and cybersecurity vulnerabilities in biological databases

  • Who are the major players in the Digital Biology Market?

    • 10X Genomics Inc., AbCellera Biologics Inc., Asimov Inc, Benchling Inc., BenevolentAI, Cradle, DNAnexus Inc., Generate Biomedicines, Ginkgo Bioworks Holdings Inc., Illumina Inc., Insilico Medicine, Isomorphic Labs, Microsoft Corp., NVIDIA Corp., Recursion Pharmaceuticals Inc., Relay Therapeutics Inc., Schrodinger Inc., Tempus AI Inc., Twist Bioscience Corp. and Valo Health

Market Research Insights

  • The digital biology market is defined by a rapid shift from traditional lab work to computationally intensive methodologies, fueled by innovations in multi-modal clinical data analysis and cloud-based bioinformatics. This transition is delivering measurable business outcomes, with organizations adopting automated wet labs reporting up to a 40% reduction in manual errors and a 30% increase in experimental throughput.
  • The application of sophisticated algorithms to population-level genomic data allows for more targeted therapeutic development, improving clinical trial success rates by over 15%. This dynamic landscape, where next-generation sequencing meets advanced predictive modeling, fosters an ecosystem where data-driven insights directly inform strategic R&D and commercialization decisions across the life sciences sector.

We can help! Our analysts can customize this digital biology market research report to meet your requirements.

Get in touch

1. Executive Summary

1.1 Market overview

Executive Summary - Chart on Market Overview
Executive Summary - Data Table on Market Overview
Executive Summary - Chart on Global Market Characteristics
Executive Summary - Chart on Market by Geography
Executive Summary - Chart on Market Segmentation by Application
Executive Summary - Chart on Market Segmentation by End-user
Executive Summary - Chart on Market Segmentation by Component
Executive Summary - Chart on Incremental Growth
Executive Summary - Data Table on Incremental Growth
Executive Summary - Chart on Company Market Positioning

2. Technavio Analysis

2.1 Analysis of price sensitivity, lifecycle, customer purchase basket, adoption rates, and purchase criteria

2.2 Criticality of inputs and Factors of differentiation

Chart on Overview on criticality of inputs and factors of differentiation

2.3 Factors of disruption

Chart on Overview on factors of disruption

2.4 Impact of drivers and challenges

Chart on Impact of drivers and challenges in 2025 and 2030

3. Market Landscape

3.1 Market ecosystem

Chart on Parent Market
Data Table on - Parent Market

3.2 Market characteristics

Chart on Market characteristics analysis

3.3 Value chain analysis

Chart on Value chain analysis

4. Market Sizing

4.1 Market definition

Data Table on Offerings of companies included in the market definition

4.2 Market segment analysis

Market segments

4.3 Market size 2025

4.4 Market outlook: Forecast for 2025-2030

Chart on Global - Market size and forecast 2025-2030 ($ million)
Data Table on Global - Market size and forecast 2025-2030 ($ million)
Chart on Global Market: Year-over-year growth 2025-2030 (%)
Data Table on Global Market: Year-over-year growth 2025-2030 (%)

5. Historic Market Size

5.1 Global Digital Biology Market 2020 - 2024

Historic Market Size - Data Table on Global Digital Biology Market 2020 - 2024 ($ million)

5.2 Application segment analysis 2020 - 2024

Historic Market Size - Application Segment 2020 - 2024 ($ million)

5.3 End-user segment analysis 2020 - 2024

Historic Market Size - End-user Segment 2020 - 2024 ($ million)

5.4 Component segment analysis 2020 - 2024

Historic Market Size - Component Segment 2020 - 2024 ($ million)

5.5 Geography segment analysis 2020 - 2024

Historic Market Size - Geography Segment 2020 - 2024 ($ million)

5.6 Country segment analysis 2020 - 2024

Historic Market Size - Country Segment 2020 - 2024 ($ million)

6. Qualitative Analysis

6.1 Impact of AI on Global Digital Biology Market

6.2 Impact of geopolitical Conflicts on Global Digital Biology Market

7. Five Forces Analysis

7.1 Five forces summary

Five forces analysis - Comparison between 2025 and 2030

7.2 Bargaining power of buyers

Bargaining power of buyers - Impact of key factors 2025 and 2030

7.3 Bargaining power of suppliers

Bargaining power of suppliers - Impact of key factors in 2025 and 2030

7.4 Threat of new entrants

Threat of new entrants - Impact of key factors in 2025 and 2030

7.5 Threat of substitutes

Threat of substitutes - Impact of key factors in 2025 and 2030

7.6 Threat of rivalry

Threat of rivalry - Impact of key factors in 2025 and 2030

7.7 Market condition

Chart on Market condition - Five forces 2025 and 2030

8. Market Segmentation by Application

8.1 Market segments

Chart on Application - Market share 2025-2030 (%)
Data Table on Application - Market share 2025-2030 (%)

8.2 Comparison by Application

Chart on Comparison by Application
Data Table on Comparison by Application

8.3 Drug discovery - Market size and forecast 2025-2030

Chart on Drug discovery - Market size and forecast 2025-2030 ($ million)
Data Table on Drug discovery - Market size and forecast 2025-2030 ($ million)
Chart on Drug discovery - Year-over-year growth 2025-2030 (%)
Data Table on Drug discovery - Year-over-year growth 2025-2030 (%)

8.4 Synthetic biology - Market size and forecast 2025-2030

Chart on Synthetic biology - Market size and forecast 2025-2030 ($ million)
Data Table on Synthetic biology - Market size and forecast 2025-2030 ($ million)
Chart on Synthetic biology - Year-over-year growth 2025-2030 (%)
Data Table on Synthetic biology - Year-over-year growth 2025-2030 (%)

8.5 Precision medicine - Market size and forecast 2025-2030

Chart on Precision medicine - Market size and forecast 2025-2030 ($ million)
Data Table on Precision medicine - Market size and forecast 2025-2030 ($ million)
Chart on Precision medicine - Year-over-year growth 2025-2030 (%)
Data Table on Precision medicine - Year-over-year growth 2025-2030 (%)

8.6 Clinical diagnostics - Market size and forecast 2025-2030

Chart on Clinical diagnostics - Market size and forecast 2025-2030 ($ million)
Data Table on Clinical diagnostics - Market size and forecast 2025-2030 ($ million)
Chart on Clinical diagnostics - Year-over-year growth 2025-2030 (%)
Data Table on Clinical diagnostics - Year-over-year growth 2025-2030 (%)

8.7 Agricultural biotechnology - Market size and forecast 2025-2030

Chart on Agricultural biotechnology - Market size and forecast 2025-2030 ($ million)
Data Table on Agricultural biotechnology - Market size and forecast 2025-2030 ($ million)
Chart on Agricultural biotechnology - Year-over-year growth 2025-2030 (%)
Data Table on Agricultural biotechnology - Year-over-year growth 2025-2030 (%)

8.8 Market opportunity by Application

Market opportunity by Application ($ million)
Data Table on Market opportunity by Application ($ million)

9. Market Segmentation by End-user

9.1 Market segments

Chart on End-user - Market share 2025-2030 (%)
Data Table on End-user - Market share 2025-2030 (%)

9.2 Comparison by End-user

Chart on Comparison by End-user
Data Table on Comparison by End-user

9.3 Pharmaceutical companies - Market size and forecast 2025-2030

Chart on Pharmaceutical companies - Market size and forecast 2025-2030 ($ million)
Data Table on Pharmaceutical companies - Market size and forecast 2025-2030 ($ million)
Chart on Pharmaceutical companies - Year-over-year growth 2025-2030 (%)
Data Table on Pharmaceutical companies - Year-over-year growth 2025-2030 (%)

9.4 Biotechnology companies - Market size and forecast 2025-2030

Chart on Biotechnology companies - Market size and forecast 2025-2030 ($ million)
Data Table on Biotechnology companies - Market size and forecast 2025-2030 ($ million)
Chart on Biotechnology companies - Year-over-year growth 2025-2030 (%)
Data Table on Biotechnology companies - Year-over-year growth 2025-2030 (%)

9.5 Research institutes - Market size and forecast 2025-2030

Chart on Research institutes - Market size and forecast 2025-2030 ($ million)
Data Table on Research institutes - Market size and forecast 2025-2030 ($ million)
Chart on Research institutes - Year-over-year growth 2025-2030 (%)
Data Table on Research institutes - Year-over-year growth 2025-2030 (%)

9.6 Healthcare providers - Market size and forecast 2025-2030

Chart on Healthcare providers - Market size and forecast 2025-2030 ($ million)
Data Table on Healthcare providers - Market size and forecast 2025-2030 ($ million)
Chart on Healthcare providers - Year-over-year growth 2025-2030 (%)
Data Table on Healthcare providers - Year-over-year growth 2025-2030 (%)

9.7 Agricultural companies - Market size and forecast 2025-2030

Chart on Agricultural companies - Market size and forecast 2025-2030 ($ million)
Data Table on Agricultural companies - Market size and forecast 2025-2030 ($ million)
Chart on Agricultural companies - Year-over-year growth 2025-2030 (%)
Data Table on Agricultural companies - Year-over-year growth 2025-2030 (%)

9.8 Market opportunity by End-user

Market opportunity by End-user ($ million)
Data Table on Market opportunity by End-user ($ million)

10. Market Segmentation by Component

10.1 Market segments

Chart on Component - Market share 2025-2030 (%)
Data Table on Component - Market share 2025-2030 (%)

10.2 Comparison by Component

Chart on Comparison by Component
Data Table on Comparison by Component

10.3 Solutions - Market size and forecast 2025-2030

Chart on Solutions - Market size and forecast 2025-2030 ($ million)
Data Table on Solutions - Market size and forecast 2025-2030 ($ million)
Chart on Solutions - Year-over-year growth 2025-2030 (%)
Data Table on Solutions - Year-over-year growth 2025-2030 (%)

10.4 Services - Market size and forecast 2025-2030

Chart on Services - Market size and forecast 2025-2030 ($ million)
Data Table on Services - Market size and forecast 2025-2030 ($ million)
Chart on Services - Year-over-year growth 2025-2030 (%)
Data Table on Services - Year-over-year growth 2025-2030 (%)

10.5 Market opportunity by Component

Market opportunity by Component ($ million)
Data Table on Market opportunity by Component ($ million)

11. Customer Landscape

11.1 Customer landscape overview

Analysis of price sensitivity, lifecycle, customer purchase basket, adoption rates, and purchase criteria

12. Geographic Landscape

12.1 Geographic segmentation

Chart on Market share by geography 2025-2030 (%)
Data Table on Market share by geography 2025-2030 (%)

12.2 Geographic comparison

Chart on Geographic comparison
Data Table on Geographic comparison

12.3 North America - Market size and forecast 2025-2030

Chart on North America - Market size and forecast 2025-2030 ($ million)
Data Table on North America - Market size and forecast 2025-2030 ($ million)
Chart on North America - Year-over-year growth 2025-2030 (%)
Data Table on North America - Year-over-year growth 2025-2030 (%)
Chart on Regional Comparison - North America
Data Table on Regional Comparison - North America

12.3.1 US - Market size and forecast 2025-2030

Chart on US - Market size and forecast 2025-2030 ($ million)
Data Table on US - Market size and forecast 2025-2030 ($ million)
Chart on US - Year-over-year growth 2025-2030 (%)
Data Table on US - Year-over-year growth 2025-2030 (%)

12.3.2 Canada - Market size and forecast 2025-2030

Chart on Canada - Market size and forecast 2025-2030 ($ million)
Data Table on Canada - Market size and forecast 2025-2030 ($ million)
Chart on Canada - Year-over-year growth 2025-2030 (%)
Data Table on Canada - Year-over-year growth 2025-2030 (%)

12.3.3 Mexico - Market size and forecast 2025-2030

Chart on Mexico - Market size and forecast 2025-2030 ($ million)
Data Table on Mexico - Market size and forecast 2025-2030 ($ million)
Chart on Mexico - Year-over-year growth 2025-2030 (%)
Data Table on Mexico - Year-over-year growth 2025-2030 (%)

12.4 Europe - Market size and forecast 2025-2030

Chart on Europe - Market size and forecast 2025-2030 ($ million)
Data Table on Europe - Market size and forecast 2025-2030 ($ million)
Chart on Europe - Year-over-year growth 2025-2030 (%)
Data Table on Europe - Year-over-year growth 2025-2030 (%)
Chart on Regional Comparison - Europe
Data Table on Regional Comparison - Europe

12.4.1 Germany - Market size and forecast 2025-2030

Chart on Germany - Market size and forecast 2025-2030 ($ million)
Data Table on Germany - Market size and forecast 2025-2030 ($ million)
Chart on Germany - Year-over-year growth 2025-2030 (%)
Data Table on Germany - Year-over-year growth 2025-2030 (%)

12.4.2 UK - Market size and forecast 2025-2030

Chart on UK - Market size and forecast 2025-2030 ($ million)
Data Table on UK - Market size and forecast 2025-2030 ($ million)
Chart on UK - Year-over-year growth 2025-2030 (%)
Data Table on UK - Year-over-year growth 2025-2030 (%)

12.4.3 France - Market size and forecast 2025-2030

Chart on France - Market size and forecast 2025-2030 ($ million)
Data Table on France - Market size and forecast 2025-2030 ($ million)
Chart on France - Year-over-year growth 2025-2030 (%)
Data Table on France - Year-over-year growth 2025-2030 (%)

12.4.4 Italy - Market size and forecast 2025-2030

Chart on Italy - Market size and forecast 2025-2030 ($ million)
Data Table on Italy - Market size and forecast 2025-2030 ($ million)
Chart on Italy - Year-over-year growth 2025-2030 (%)
Data Table on Italy - Year-over-year growth 2025-2030 (%)

12.4.5 Spain - Market size and forecast 2025-2030

Chart on Spain - Market size and forecast 2025-2030 ($ million)
Data Table on Spain - Market size and forecast 2025-2030 ($ million)
Chart on Spain - Year-over-year growth 2025-2030 (%)
Data Table on Spain - Year-over-year growth 2025-2030 (%)

12.4.6 The Netherlands - Market size and forecast 2025-2030

Chart on The Netherlands - Market size and forecast 2025-2030 ($ million)
Data Table on The Netherlands - Market size and forecast 2025-2030 ($ million)
Chart on The Netherlands - Year-over-year growth 2025-2030 (%)
Data Table on The Netherlands - Year-over-year growth 2025-2030 (%)

12.4.7 Russia - Market size and forecast 2025-2030

Chart on Russia - Market size and forecast 2025-2030 ($ million)
Data Table on Russia - Market size and forecast 2025-2030 ($ million)
Chart on Russia - Year-over-year growth 2025-2030 (%)
Data Table on Russia - Year-over-year growth 2025-2030 (%)

12.5 Asia - Market size and forecast 2025-2030

Chart on Asia - Market size and forecast 2025-2030 ($ million)
Data Table on Asia - Market size and forecast 2025-2030 ($ million)
Chart on Asia - Year-over-year growth 2025-2030 (%)
Data Table on Asia - Year-over-year growth 2025-2030 (%)
Chart on Regional Comparison - Asia
Data Table on Regional Comparison - Asia

12.5.1 China - Market size and forecast 2025-2030

Chart on China - Market size and forecast 2025-2030 ($ million)
Data Table on China - Market size and forecast 2025-2030 ($ million)
Chart on China - Year-over-year growth 2025-2030 (%)
Data Table on China - Year-over-year growth 2025-2030 (%)

12.5.2 Japan - Market size and forecast 2025-2030

Chart on Japan - Market size and forecast 2025-2030 ($ million)
Data Table on Japan - Market size and forecast 2025-2030 ($ million)
Chart on Japan - Year-over-year growth 2025-2030 (%)
Data Table on Japan - Year-over-year growth 2025-2030 (%)

12.5.3 India - Market size and forecast 2025-2030

Chart on India - Market size and forecast 2025-2030 ($ million)
Data Table on India - Market size and forecast 2025-2030 ($ million)
Chart on India - Year-over-year growth 2025-2030 (%)
Data Table on India - Year-over-year growth 2025-2030 (%)

12.5.4 South Korea - Market size and forecast 2025-2030

Chart on South Korea - Market size and forecast 2025-2030 ($ million)
Data Table on South Korea - Market size and forecast 2025-2030 ($ million)
Chart on South Korea - Year-over-year growth 2025-2030 (%)
Data Table on South Korea - Year-over-year growth 2025-2030 (%)

12.5.5 Singapore - Market size and forecast 2025-2030

Chart on Singapore - Market size and forecast 2025-2030 ($ million)
Data Table on Singapore - Market size and forecast 2025-2030 ($ million)
Chart on Singapore - Year-over-year growth 2025-2030 (%)
Data Table on Singapore - Year-over-year growth 2025-2030 (%)

12.5.6 Indonesia - Market size and forecast 2025-2030

Chart on Indonesia - Market size and forecast 2025-2030 ($ million)
Data Table on Indonesia - Market size and forecast 2025-2030 ($ million)
Chart on Indonesia - Year-over-year growth 2025-2030 (%)
Data Table on Indonesia - Year-over-year growth 2025-2030 (%)

12.5.7 Thailand - Market size and forecast 2025-2030

Chart on Thailand - Market size and forecast 2025-2030 ($ million)
Data Table on Thailand - Market size and forecast 2025-2030 ($ million)
Chart on Thailand - Year-over-year growth 2025-2030 (%)
Data Table on Thailand - Year-over-year growth 2025-2030 (%)

12.6 Rest of World (ROW) - Market size and forecast 2025-2030

Chart on Rest of World (ROW) - Market size and forecast 2025-2030 ($ million)
Data Table on Rest of World (ROW) - Market size and forecast 2025-2030 ($ million)
Chart on Rest of World (ROW) - Year-over-year growth 2025-2030 (%)
Data Table on Rest of World (ROW) - Year-over-year growth 2025-2030 (%)
Chart on Regional Comparison - Rest of World (ROW)
Data Table on Regional Comparison - Rest of World (ROW)

12.6.1 Australia - Market size and forecast 2025-2030

Chart on Australia - Market size and forecast 2025-2030 ($ million)
Data Table on Australia - Market size and forecast 2025-2030 ($ million)
Chart on Australia - Year-over-year growth 2025-2030 (%)
Data Table on Australia - Year-over-year growth 2025-2030 (%)

12.6.2 Brazil - Market size and forecast 2025-2030

Chart on Brazil - Market size and forecast 2025-2030 ($ million)
Data Table on Brazil - Market size and forecast 2025-2030 ($ million)
Chart on Brazil - Year-over-year growth 2025-2030 (%)
Data Table on Brazil - Year-over-year growth 2025-2030 (%)

12.6.3 Saudi Arabia - Market size and forecast 2025-2030

Chart on Saudi Arabia - Market size and forecast 2025-2030 ($ million)
Data Table on Saudi Arabia - Market size and forecast 2025-2030 ($ million)
Chart on Saudi Arabia - Year-over-year growth 2025-2030 (%)
Data Table on Saudi Arabia - Year-over-year growth 2025-2030 (%)

12.6.4 Turkey - Market size and forecast 2025-2030

Chart on Turkey - Market size and forecast 2025-2030 ($ million)
Data Table on Turkey - Market size and forecast 2025-2030 ($ million)
Chart on Turkey - Year-over-year growth 2025-2030 (%)
Data Table on Turkey - Year-over-year growth 2025-2030 (%)

12.6.5 UAE - Market size and forecast 2025-2030

Chart on UAE - Market size and forecast 2025-2030 ($ million)
Data Table on UAE - Market size and forecast 2025-2030 ($ million)
Chart on UAE - Year-over-year growth 2025-2030 (%)
Data Table on UAE - Year-over-year growth 2025-2030 (%)

12.6.6 South Africa - Market size and forecast 2025-2030

Chart on South Africa - Market size and forecast 2025-2030 ($ million)
Data Table on South Africa - Market size and forecast 2025-2030 ($ million)
Chart on South Africa - Year-over-year growth 2025-2030 (%)
Data Table on South Africa - Year-over-year growth 2025-2030 (%)

12.7 Market opportunity by geography

Market opportunity by geography ($ million)
Data Tables on Market opportunity by geography ($ million)

13. Drivers, Challenges, and Opportunity

13.1 Market drivers

Integration of AI and ML in genomic sequencing
Exponential growth in bioinformatics and cloud computing infrastructure
Increasing investments and funding in synthetic biology initiatives

13.2 Market challenges

Data privacy concerns and cybersecurity vulnerabilities in biological databases
Interoperability limitations and lack of standardized data formats
Severe shortage of multidisciplinary talent and skilled professionals

13.3 Impact of drivers and challenges

Impact of drivers and challenges in 2025 and 2030

13.4 Market opportunities

Expansion of digital twin technology in pharmaceutical drug discovery
Rise of decentralized and blockchain enabled platforms for genomic data security
Integration of quantum computing for simulating complex biological molecular systems

14. Competitive Landscape

14.1 Overview

14.2

Overview on criticality of inputs and factors of differentiation

14.3 Landscape disruption

Overview on factors of disruption

14.4 Industry risks

Impact of key risks on business

15. Competitive Analysis

15.1 Companies profiled

Companies covered

15.2 Company ranking index

15.3 Market positioning of companies

Matrix on companies position and classification

15.4 10X Genomics Inc.

10X Genomics Inc. - Overview
10X Genomics Inc. - Product / Service
10X Genomics Inc. - Key offerings
SWOT

15.5 Benchling Inc.

Benchling Inc. - Overview
Benchling Inc. - Product / Service
Benchling Inc. - Key offerings
SWOT

15.6 BenevolentAI

BenevolentAI - Overview
BenevolentAI - Product / Service
BenevolentAI - Key offerings
SWOT

15.7 DNAnexus Inc.

DNAnexus Inc. - Overview
DNAnexus Inc. - Product / Service
DNAnexus Inc. - Key offerings
SWOT

15.8 Generate Biomedicines

Generate Biomedicines - Overview
Generate Biomedicines - Product / Service
Generate Biomedicines - Key offerings
SWOT

15.9 Ginkgo Bioworks Holdings Inc.

Ginkgo Bioworks Holdings Inc. - Overview
Ginkgo Bioworks Holdings Inc. - Business segments
Ginkgo Bioworks Holdings Inc. - Key offerings
Ginkgo Bioworks Holdings Inc. - Segment focus
SWOT

15.10 Illumina Inc.

Illumina Inc. - Overview
Illumina Inc. - Business segments
Illumina Inc. - Key news
Illumina Inc. - Key offerings
Illumina Inc. - Segment focus
SWOT

15.11 Insilico Medicine

Insilico Medicine - Overview
Insilico Medicine - Product / Service
Insilico Medicine - Key offerings
SWOT

15.12 Isomorphic Labs

Isomorphic Labs - Overview
Isomorphic Labs - Product / Service
Isomorphic Labs - Key offerings
SWOT

15.13 Microsoft Corp.

Microsoft Corp. - Overview
Microsoft Corp. - Business segments
Microsoft Corp. - Key news
Microsoft Corp. - Key offerings
Microsoft Corp. - Segment focus
SWOT

15.14 NVIDIA Corp.

NVIDIA Corp. - Overview
NVIDIA Corp. - Business segments
NVIDIA Corp. - Key news
NVIDIA Corp. - Key offerings
NVIDIA Corp. - Segment focus
SWOT

15.15 Recursion Pharmaceuticals Inc.

Recursion Pharmaceuticals Inc. - Overview
Recursion Pharmaceuticals Inc. - Product / Service
Recursion Pharmaceuticals Inc. - Key offerings
SWOT

15.16 Schrodinger Inc.

Schrodinger Inc. - Overview
Schrodinger Inc. - Business segments
Schrodinger Inc. - Key news
Schrodinger Inc. - Key offerings
Schrodinger Inc. - Segment focus
SWOT

15.17 Tempus AI Inc.

Tempus AI Inc. - Overview
Tempus AI Inc. - Product / Service
Tempus AI Inc. - Key offerings
SWOT

15.18 Twist Bioscience Corp.

Twist Bioscience Corp. - Overview
Twist Bioscience Corp. - Product / Service
Twist Bioscience Corp. - Key offerings
SWOT

16. Appendix

16.1 Scope of the report

Market definition
Objectives
Notes and caveats

16.2 Inclusions and exclusions checklist

Inclusions checklist
Exclusions checklist

16.3 Currency conversion rates for US$

16.4 Research methodology

16.5 Data procurement

Information sources

16.6 Data validation

16.7 Validation techniques employed for market sizing

16.8 Data synthesis

16.9 360 degree market analysis

16.10 List of abbreviations

Research Methodology

Technavio presents a detailed picture of the market by way of study, synthesis, and summation of data from multiple sources. The analysts have presented the various facets of the market with a particular focus on identifying the key industry influencers. The data thus presented is comprehensive, reliable, and the result of extensive research, both primary and secondary.

INFORMATION SOURCES

Primary sources

  • Manufacturers and suppliers
  • Channel partners
  • Industry experts
  • Strategic decision makers

Secondary sources

  • Industry journals and periodicals
  • Government data
  • Financial reports of key industry players
  • Historical data
  • Press releases

DATA ANALYSIS

Data Synthesis

  • Collation of data
  • Estimation of key figures
  • Analysis of derived insights

Data Validation

  • Triangulation with data models
  • Reference against proprietary databases
  • Corroboration with industry experts

REPORT WRITING

Qualitative

  • Market drivers
  • Market challenges
  • Market trends
  • Five forces analysis

Quantitative

  • Market size and forecast
  • Market segmentation
  • Geographical insights
  • Competitive landscape

Interested in this report?

Get your sample now to see our research methodology and insights!

Download Now

Frequently Asked Questions

Digital Biology market growth will increase by USD 29883.8 million during 2026-2030.

The Digital Biology market is expected to grow at a CAGR of 20.1% during 2026-2030.

Digital Biology market is segmented by Application (Drug discovery, Synthetic biology, Precision medicine, Clinical diagnostics, Agricultural biotechnology) End-user (Pharmaceutical companies, Biotechnology companies, Research institutes, Healthcare providers, Agricultural companies) Component (Solutions, Services)

10X Genomics Inc., AbCellera Biologics Inc., Asimov Inc, Benchling Inc., BenevolentAI, Cradle, DNAnexus Inc., Generate Biomedicines, Ginkgo Bioworks Holdings Inc., Illumina Inc., Insilico Medicine, Isomorphic Labs, Microsoft Corp., NVIDIA Corp., Recursion Pharmaceuticals Inc., Relay Therapeutics Inc., Schrodinger Inc., Tempus AI Inc., Twist Bioscience Corp., Valo Health are a few of the key vendors in the Digital Biology market.

North America will register the highest growth rate of 35.2% among the other regions. Therefore, the Digital Biology market in North America is expected to garner significant business opportunities for the vendors during the forecast period.

US, Canada, Mexico, Germany, UK, France, Italy, Spain, The Netherlands, Russia, China, Japan, India, South Korea, Singapore, Indonesia, Thailand, Australia, Brazil, Saudi Arabia, Turkey, UAE, South Africa

  • Integration of AI and ML in genomic sequencing is the driving factor this market.

The Digital Biology market vendors should focus on grabbing business opportunities from the Application segment as it accounted for the largest market share in the base year.
RIA - Research AI Assistant
Ask RIA