
Digital Identity And Security Market Size 2025-2029
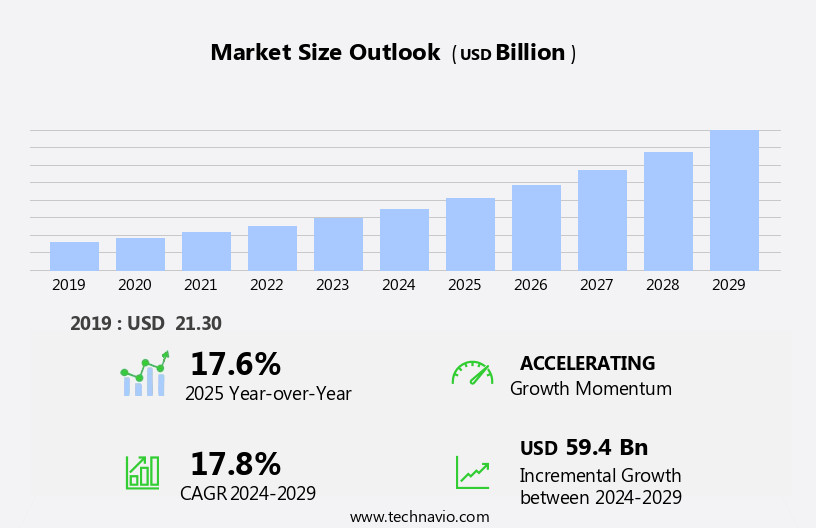
The digital identity and security market size is forecast to increase by USD 59.4 billion, at a CAGR of 17.8% between 2024 and 2029.
- The market is experiencing significant growth, driven by the increasing adoption of electronic ID cards (eID) and smart infrastructure initiatives. These advancements are transforming the way identities are managed and secured in both public and private sectors. Furthermore, the integration of artificial intelligence (AI), machine learning (ML), and blockchain technologies is enhancing digital identities, offering improved security and convenience. However, the market faces challenges as well. High costs associated with deploying digital identity and security solutions remain a significant barrier for many organizations, necessitating careful planning and strategic investment.
- Companies seeking to capitalize on market opportunities and navigate challenges effectively must stay informed of these trends and obstacles, ensuring they are well-positioned to meet the evolving needs of their customers and stakeholders.
What will be the Size of the Digital Identity And Security Market during the forecast period?
Explore in-depth regional segment analysis with market size data - historical 2019-2023 and forecasts 2025-2029 - in the full report.
Request Free Sample
The market continues to evolve, with dynamic market activities unfolding across various sectors. Privacy protection remains a top priority as entities navigate the complex digital landscape. Data breaches and threat intelligence are ongoing concerns, necessitating robust security measures. Social engineering and endpoint security are critical components of a comprehensive defense strategy. Intrusion prevention systems employ advanced technologies, such as anomaly detection and machine learning, to identify and mitigate threats. Network security is strengthened through the use of digital certificates and multi-factor authentication. Cloud security and zero trust security models are gaining traction, as organizations seek to mitigate risks associated with remote work and digital transformation.
IoT security is a growing area of focus, with biometric authentication and behavioral analytics used to enhance security. Password management and single sign-on solutions streamline access control, while incident response plans ensure swift and effective response to security incidents. Threat detection and security monitoring are essential for maintaining a strong security posture. Risk assessment and penetration testing are crucial for identifying vulnerabilities and addressing weaknesses. Mobile security and identity verification are essential for securing data on the go. Emerging technologies, such as blockchain technology, decentralized identity, and AI-powered security, offer promising solutions to the ever-evolving digital security landscape.
How is this Digital Identity And Security Industry segmented?
The digital identity and security industry research report provides comprehensive data (region-wise segment analysis), with forecasts and estimates in "USD billion" for the period 2025-2029, as well as historical data from 2019-2023 for the following segments.
- Component
- Solutions
- Services
- Deployment
- Cloud-Based
- On-Premise
- Hybrid
- Hybrid
- Solution Type
- Authentication
- Identity Governance
- Biometrics
- Fraud Detection
- End-User
- BFSI
- Government
- Healthcare
- Retail
- Technology
- Blockchain
- AI-Based Security
- Multi-Factor Authentication
- Geography
- North America
- US
- Canada
- Mexico
- Europe
- France
- Germany
- Italy
- Spain
- UK
- Middle East and Africa
- UAE
- APAC
- China
- India
- Japan
- South Korea
- South America
- Brazil
- Rest of World (ROW)
- North America
By Component Insights
The solutions segment is estimated to witness significant growth during the forecast period.
The market encompasses software solutions that utilize biometric data for authentication and other essential functions, such as data encryption and vulnerability management. Biometric software supports both identification and verification processes, with the former involving the creation of a digital identity, and the latter, the verification of that identity. Biometric data is securely processed and stored through software, which employs data mining techniques for efficient analysis. Biometric authentication methods, including iris scanning, facial recognition, and fingerprint scanning, are integral to this market. Additionally, multi-factor authentication, security awareness training, and machine learning security enhance the overall security landscape. Cloud security, zero trust security, and network security are crucial components, safeguarding data against breaches and threats.
Anomaly detection, threat intelligence, and incident response ensure continuous monitoring and quick response to potential threats. Password management, single sign-on, and digital certificates streamline access control. Endpoint security, intrusion prevention, and antimalware software protect against external threats. Emerging technologies like behavioral analytics, mobile security, voice recognition, blockchain technology, self-sovereign identity, and decentralized identity further enrich the market. Companies like IDEMIA France SAS, Tessi, GB Group plc, and NEC Corp. Are at the forefront of these advancements. Software tools play a pivotal role in securing digital identities and maintaining data privacy.
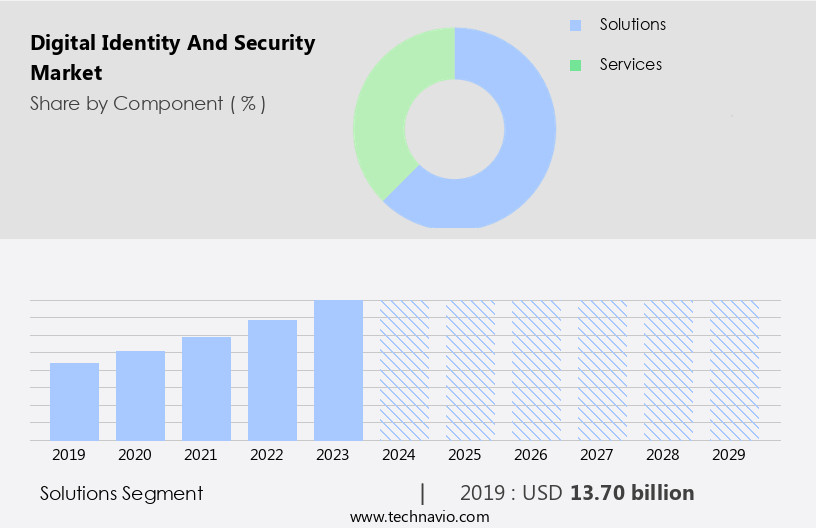
The Solutions segment was valued at USD 13.70 billion in 2019 and showed a gradual increase during the forecast period.
Regional Analysis
North America is estimated to contribute 34% to the growth of the global market during the forecast period.Technavio’s analysts have elaborately explained the regional trends and drivers that shape the market during the forecast period.
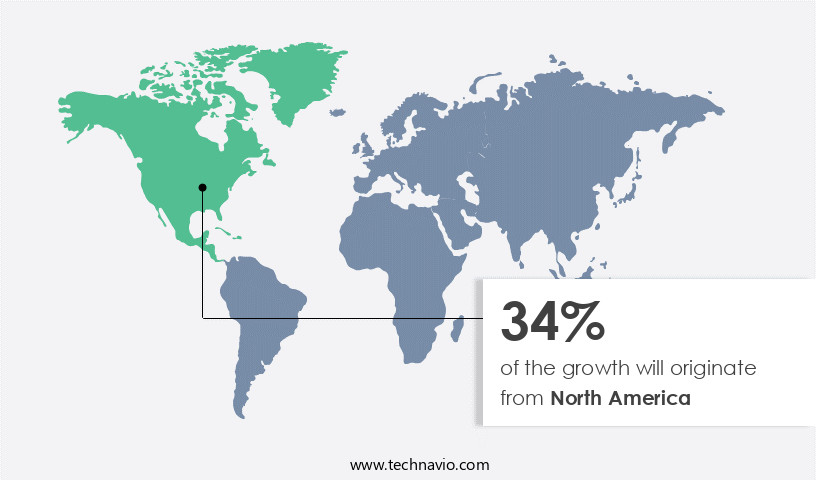
In North America, advanced technologies and infrastructure characterize the developed economies of the US and Canada. These nations lead the digital identity solutions market in the region due to their substantial investments in securing consumer identities. Real-time identity verification, end-to-end security, and seamless activation capabilities are essential for both public and private organizations in the US and Canada. Vulnerability management, access control, and vulnerability scanning are integrated into identity solutions to prevent data breaches and protect against threats such as social engineering and phishing attacks. Multi-factor authentication, biometric authentication, and behavioral analytics add an extra layer of security.
Cloud security, zero trust security, and network security ensure data privacy protection. Machine learning security, threat intelligence, and incident response systems enable quick identification and mitigation of threats. Digital wallets, mobile security, and blockchain technology offer secure transactions and self-sovereign identity solutions. The integration of these technologies into digital identity solutions prioritizes the seamless and secure customer experience while safeguarding consumer identities. The expanding economies of the US and Canada allow for significant investments in these advanced technologies, making them key players in the evolving digital identity market.
Market Dynamics
Our researchers analyzed the data with 2024 as the base year, along with the key drivers, trends, and challenges. A holistic analysis of drivers will help companies refine their marketing strategies to gain a competitive advantage.
In the dynamic and evolving digital landscape, the market plays a pivotal role in safeguarding user privacy and protecting against cyber threats. This market encompasses solutions for multi-factor authentication, biometric verification, data encryption, and identity theft prevention. It caters to various sectors, including finance, healthcare, and e-commerce, ensuring secure access to digital platforms. With the rise of IoT devices and remote work, there's an increasing demand for robust identity and security solutions. Advanced technologies like AI, machine learning, and blockchain are integrated to provide real-time threat detection and proactive security measures. This market is continually innovating to address emerging challenges, offering comprehensive solutions for secure digital transactions, data privacy, and user authentication.
What are the key market drivers leading to the rise in the adoption of Digital Identity And Security Industry?
- The integration of electronic ID cards (eID) and smart infrastructure initiatives, such as the implementation of digitalization, serves as the primary catalyst for market growth.
- Digital identity verification plays a crucial role in ensuring secure access to banking, government benefits, education, and other services in the increasingly digital world. With the global digitalization trend, identity-related frauds have become rampant, necessitating stringent security measures. Secure identity verification is essential for border controls and access to digital services, as governments and corporate sectors worldwide embrace digital transformation. Advanced technologies such as facial recognition, iris scanning, fingerprint scanning, and multi-factor authentication are used for identity verification and authentication. These technologies enhance security by adding an extra layer of protection, making it difficult for unauthorized users to gain access.
- Moreover, vulnerability management, access control, anomaly detection, and security awareness training are critical components of digital identity security. Cloud security and zero trust security models are also gaining popularity due to the increasing number of cyber threats. Regular security audits help organizations identify vulnerabilities and address them proactively, ensuring the integrity and confidentiality of digital identities. In conclusion, digital identity verification is an essential aspect of online security, especially in areas where verified identity is required. Advanced technologies and security measures such as facial recognition, multi-factor authentication, vulnerability management, and security awareness training help ensure secure and authentic digital identities.
- Regular security audits and proactive vulnerability management are also crucial for maintaining the security and integrity of digital identities.
What are the market trends shaping the Digital Identity And Security Industry?
- The integration of artificial intelligence (AI), machine learning (ML), and blockchain technologies is a significant market trend, enhancing the capabilities of digital identities. These advanced technologies bolster security, ensure data privacy, and offer personalized user experiences.
- Digital identity and security solutions are advancing through the integration of blockchain, machine learning (ML), and Artificial Intelligence (AI) technologies. These innovations enable computers to uncover hidden insights without explicit programming and automate the creation of analytical models. This automation reduces potential risks by replacing human labor. The analysis of large volumes of identity-related data and access activities by digital identity and security companies using ML-based analytics creates new market opportunities. Precisely measuring and reporting user, account, application, department, and organizational risk posture aids in minimizing the identity attack surface. Threats such as data breaches, privacy protection concerns, social engineering, endpoint security, intrusion prevention, data encryption, password management, single sign-on (SSO), network security, digital certificates, and IoT security continue to pose challenges.
- Digital identity and security companies employ various strategies to mitigate these risks. Threat intelligence is used to identify and respond to cyber threats in real-time. Password management systems ensure secure storage and sharing of passwords. SSO simplifies the login process while maintaining security. Endpoint security protects devices from malware and unauthorized access. Network security safeguards the perimeter against external attacks. Digital certificates authenticate digital entities, and IoT security ensures the protection of connected devices. In conclusion, digital identity and security solutions continue to evolve, offering advanced features to address the growing threat landscape. The integration of ML and AI technologies enables automated risk analysis and insights, reducing potential risks and creating new market opportunities.
- Companies must stay updated on the latest trends and technologies to ensure effective digital identity and security management.
What challenges does the Digital Identity And Security Industry face during its growth?
- The expansion of the digital identity and security solutions industry is hindered by the substantial costs associated with implementing these technologies.
- Digital identity and security is a critical concern for organizations across industries, as the threat of cyberattacks and identity-related fraud and theft continues to grow. Implementing digital identity solutions is essential for effective identification and authentication, yet the high implementation costs remain a significant barrier. Small and medium-sized enterprises (SMEs) often prioritize server security over database protection due to budget constraints, leaving them vulnerable to cyber threats. To mitigate these risks, businesses are investing in advanced security measures such as penetration testing, data security, machine learning security, incident response, antimalware software, biometric authentication, behavioral analytics, mobile security, identity verification, and AI-powered security.
- These solutions offer enhanced protection against cyber threats and provide a more robust and harmonious security environment. Red teaming, a practice where ethical hackers test an organization's security defenses, is also gaining popularity as a proactive measure to identify vulnerabilities. Decentralized identity, which allows individuals to control their digital identities, is an emerging trend that offers increased security and privacy. Despite the benefits, the implementation of digital identity solutions requires a significant upfront investment. However, the potential cost savings from avoiding cyberattacks and the protection of sensitive data make the investment worthwhile. Organizations must prioritize digital identity and security to safeguard their business and maintain customer trust.
Exclusive Customer Landscape
The digital identity and security market forecasting report includes the adoption lifecycle of the market, covering from the innovator’s stage to the laggard’s stage. It focuses on adoption rates in different regions based on penetration. Furthermore, the digital identity and security market report also includes key purchase criteria and drivers of price sensitivity to help companies evaluate and develop their market growth analysis strategies.
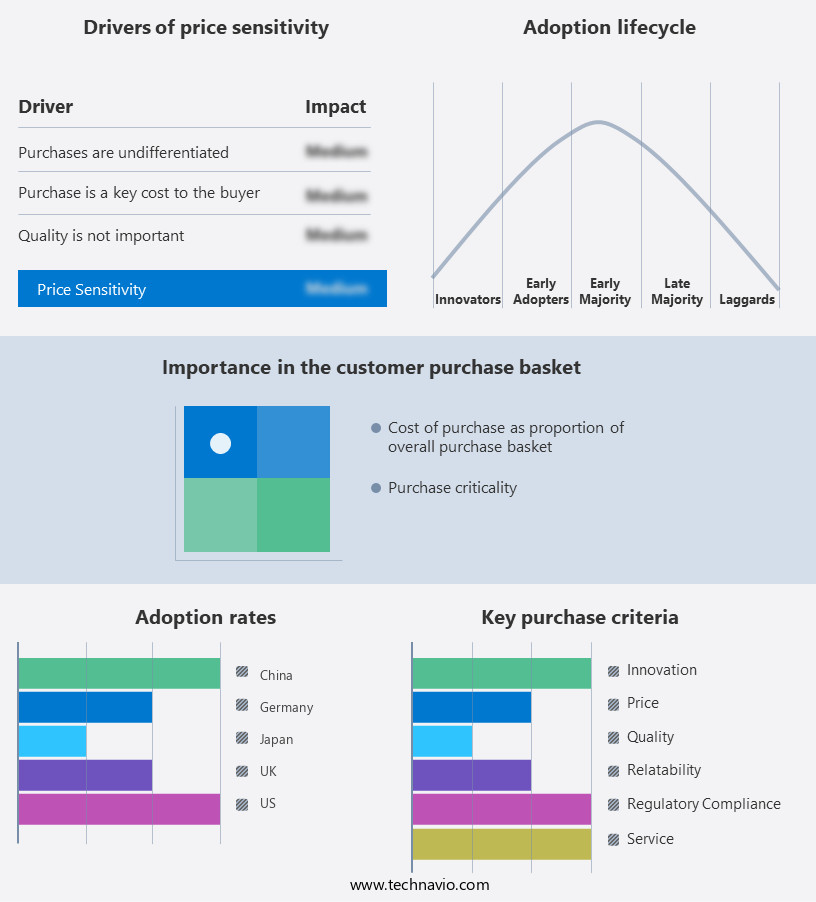
Customer Landscape
Key Companies & Market Insights
Companies are implementing various strategies, such as strategic alliances, digital identity and security market forecast, partnerships, mergers and acquisitions, geographical expansion, and product/service launches, to enhance their presence in the industry.
Okta Inc. - The company specializes in digital identity and security solutions, including AU10TIX Instinct. Our offerings leverage advanced technology to verify and secure identities, ensuring the highest level of protection against fraud and identity theft. By utilizing AI and machine learning algorithms, we provide accurate and efficient identity verification services, enabling businesses to onboard customers quickly and confidently. Our commitment to innovation and data privacy ensures that we stay at the forefront of the industry, providing our clients with the most effective and reliable solutions to manage their digital identities.
The industry research and growth report includes detailed analyses of the competitive landscape of the market and information about key companies, including:
- Okta Inc.
- Ping Identity Corporation
- ForgeRock Inc.
- Centrify Corporation
- OneLogin Inc.
- RSA Security LLC
- SAP SE
- Atos SE
- SailPoint Technologies Holdings Inc.
- Fujitsu Limited
- NEC Corporation
- Hitachi ID Systems Inc.
- Ant Group
- Tencent Holdings Ltd.
- Baidu Inc.
- SenseTime Group Ltd.
- Thales Group
- Gemalto
- Idemia
- Entrust Corporation
Qualitative and quantitative analysis of companies has been conducted to help clients understand the wider business environment as well as the strengths and weaknesses of key industry players. Data is qualitatively analyzed to categorize companies as pure play, category-focused, industry-focused, and diversified; it is quantitatively analyzed to categorize companies as dominant, leading, strong, tentative, and weak.
Recent Development and News in Digital Identity And Security Market
- In January 2024, Microsoft Corporation announced the global availability of its new multi-factor authentication solution, Microsoft Identity Platform Authenticator, aimed at enhancing digital identity security for businesses and individuals (Microsoft Press Release, 2024).
- In March 2024, IBM Security and Okta, Inc. Entered into a strategic partnership to integrate IBM's security solutions with Okta's Identity Cloud, offering customers a more robust identity and access management solution (Okta Press Release, 2024).
- In April 2025, Mastercard and Microsoft announced a collaboration to develop a decentralized identity platform using blockchain technology, aiming to provide individuals with more control over their personal data and digital identity (Mastercard Newsroom, 2025).
- In May 2025, Google Cloud secured a significant contract with the European Commission to provide its Cloud Identity platform, strengthening the European Union's digital identity infrastructure and enhancing data security for public sector services (Google Cloud Blog, 2025).
Research Analyst Overview
- In the dynamic the market, biometric sensors and homomorphic encryption are driving innovation in identity proofing, ensuring secure authentication and data privacy. Compliance frameworks, such as GDPR and HIPAA, mandate robust incident management and user provisioning processes. Fraud detection and access management are critical components of security architecture, leveraging encryption algorithms and authorization policies. Zero-knowledge proofs and identity federation enable seamless user experience while maintaining security. Passwordless authentication and federated learning enhance convenience and data protection. Forensic analysis and cyber insurance offer risk mitigation and identity theft protection.
- Identity lifecycle management and data governance ensure compliance with privacy regulations. Differential privacy and blockchain-based identity solutions provide enhanced security and data masking. Authentication protocols continue to evolve, integrating advanced technologies like homomorphic encryption and zero-knowledge proofs.
Dive into Technavio’s robust research methodology, blending expert interviews, extensive data synthesis, and validated models for unparalleled Digital Identity And Security Market insights. See full methodology.
|
Market Scope |
|
|
Report Coverage |
Details |
|
Page number |
197 |
|
Base year |
2024 |
|
Historic period |
2019-2023 |
|
Forecast period |
2025-2029 |
|
Growth momentum & CAGR |
Accelerate at a CAGR of 17.8% |
|
Market growth 2025-2029 |
USD 59.4 billion |
|
Market structure |
Fragmented |
|
YoY growth 2024-2025(%) |
17.6 |
|
Key countries |
US, China, Germany, Canada, India, South Korea, France, Japan, Italy, Brazil, UAE, UK, Spain, and Mexico |
|
Competitive landscape |
Leading Companies, Market Positioning of Companies, Competitive Strategies, and Industry Risks |
What are the Key Data Covered in this Digital Identity And Security Market Research and Growth Report?
- CAGR of the Digital Identity And Security industry during the forecast period
- Detailed information on factors that will drive the growth and forecasting between 2025 and 2029
- Precise estimation of the size of the market and its contribution of the industry in focus to the parent market
- Accurate predictions about upcoming growth and trends and changes in consumer behaviour
- Growth of the market across North America, APAC, Europe, South America, and Middle East and Africa
- Thorough analysis of the market’s competitive landscape and detailed information about companies
- Comprehensive analysis of factors that will challenge the digital identity and security market growth of industry companies
We can help! Our analysts can customize this digital identity and security market research report to meet your requirements.