Digital Thread Market Analysis, Size, and Forecast 2026-2030: North America (US, Canada, and Mexico), APAC (China, Japan, and India), Europe (Germany, UK, and France), Middle East and Africa (Saudi Arabia, UAE, and South Africa), South America (Brazil and Argentina), and Rest of World (ROW)

Digital Thread Market Analysis, Size, and Forecast 2026-2030:
North America (US, Canada, and Mexico), APAC (China, Japan, and India), Europe (Germany, UK, and France), Middle East and Africa (Saudi Arabia, UAE, and South Africa), South America (Brazil and Argentina), and Rest of World (ROW)

Published: May 2026 320 Pages SKU: IRTNTR81484

Market Overview at a Glance

$20.39 B
Market Opportunity
20.3%
CAGR 2025 - 2030
39.2%
North America Growth
$6.79 B
Cloud-based segment 2024

Digital Thread Market Size 2026-2030

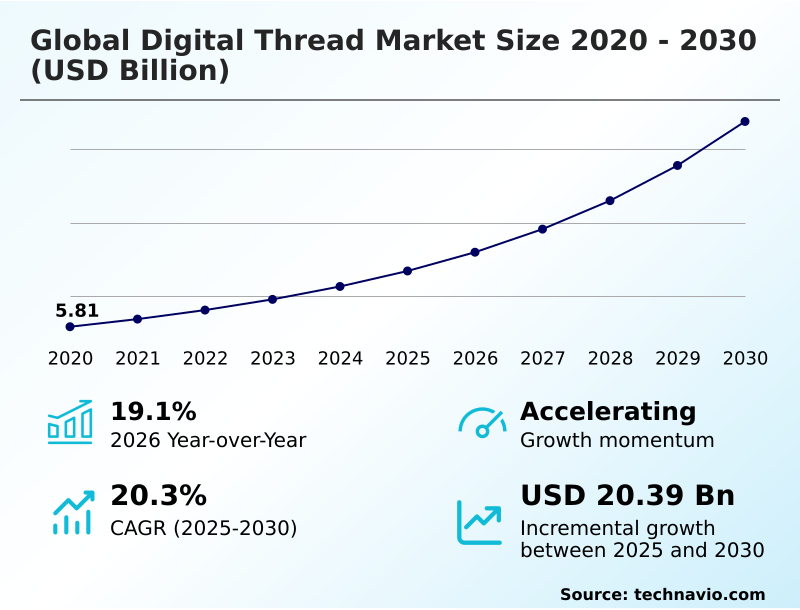
The digital thread market size is valued to increase by USD 20.39 billion, at a CAGR of 20.3% from 2025 to 2030. Accelerating industrial digitalization and adoption of industry 4.0 standards will drive the digital thread market.

Major Market Trends & Insights

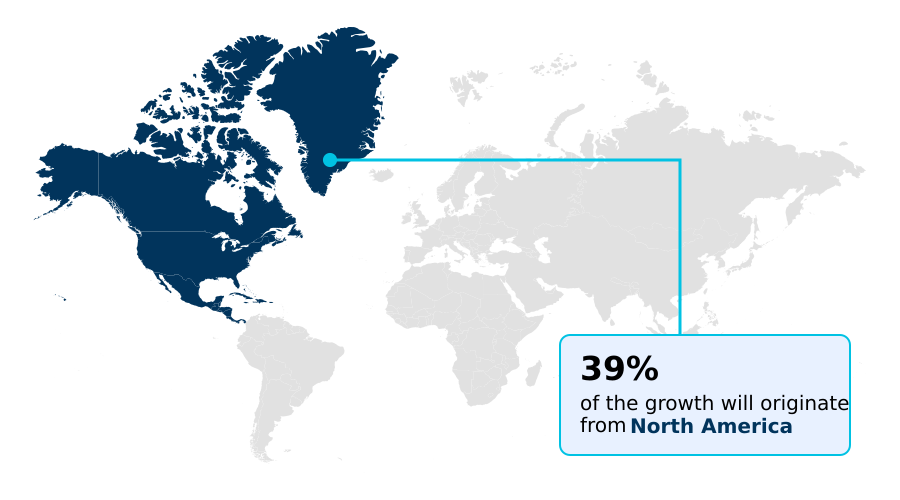
  • North America dominated the market and accounted for a 39.2% growth during the forecast period.
  • By Deployment - Cloud-based segment was valued at USD 6.79 billion in 2024
  • By Technology - Product lifecycle management segment accounted for the largest market revenue share in 2024

Market Size & Forecast

  • Market Opportunities: USD 27.98 billion
  • Market Future Opportunities: USD 20.39 billion
  • CAGR from 2025 to 2030 : 20.3%

Market Summary

  • The digital thread market establishes an authoritative, integrated communication framework for the entire product lifecycle, from design to service. This digital backbone is crucial for industrial digitalization, connecting disparate systems like product lifecycle management (PLM), enterprise resource planning (ERP), and manufacturing execution systems (MES) to create a single source of truth.
  • Key drivers include the need for end-to-end traceability in complex industries and the push for sustainability reporting through digital product passports. A dominant trend is the integration of industrial AI and generative models for automated lifecycle data intelligence.
  • For instance, an aerospace manufacturer can use the digital thread to link a component's material history tracking from its supplier with its in-service performance data, enabling predictive maintenance that reduces downtime and improves fleet reliability. However, challenges such as high initial capital expenditure, data governance complexities, and the need for robust industrial cybersecurity for cyber-physical systems persist.
  • Addressing systemic interoperability hurdles is essential for realizing the full potential of a connected enterprise and achieving significant operational efficiency improvements.

What will be the Size of the Digital Thread Market during the forecast period?

Get Key Insights on Market Forecast (PDF) Get Free Sample

How is the Digital Thread Market Segmented?

The digital thread industry research report provides comprehensive data (region-wise segment analysis), with forecasts and estimates in "USD million" for the period 2026-2030, as well as historical data from 2020-2024 for the following segments.

  • Deployment
    • Cloud-based
    • On-premises
  • Technology
    • Product lifecycle management
    • Computer-aided design
    • Digital twin and simulation
    • Manufacturing execution systems
    • Others
  • End-user
    • Automotive
    • Industrial manufacturing
    • Aerospace and defense
    • Energy and utilities
    • Others
  • Geography
    • North America
      • US
      • Canada
      • Mexico
    • APAC
      • China
      • Japan
      • India
    • Europe
      • Germany
      • UK
      • France
    • Middle East and Africa
      • Saudi Arabia
      • UAE
      • South Africa
    • South America
      • Brazil
      • Argentina
    • Rest of World (ROW)

By Deployment Insights

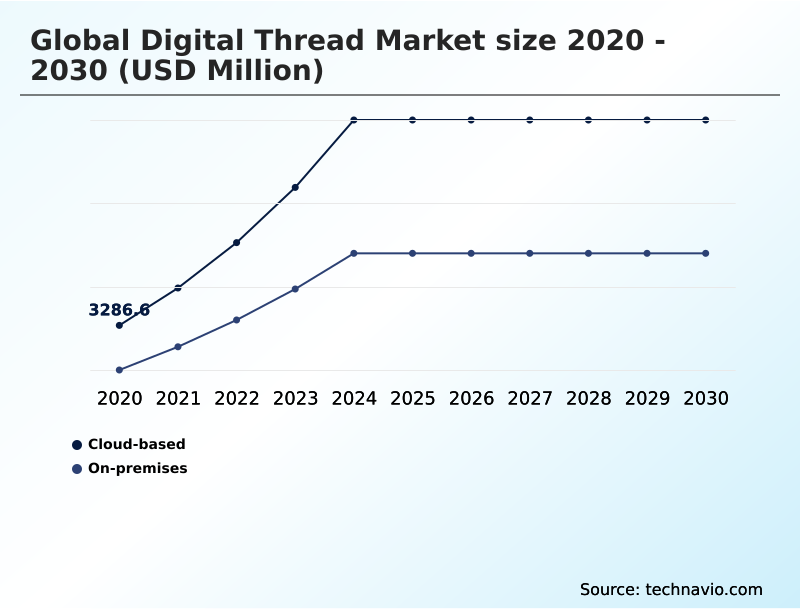
The cloud-based segment is estimated to witness significant growth during the forecast period.

The cloud-based segment is defined by its use of cloud-native architecture to deliver a scalable industrial data platform. This model enables enterprise data integration and real-time collaboration, fostering a connected worker environment that dissolves geographical barriers.

Organizations are adopting this approach to achieve a single source of truth for asset performance management and industrial automation, leading to significant operational efficiency improvement.

By leveraging the cloud, firms facilitate remote diagnostics and provide augmented reality (AR) tools to field technicians, improving first-time fix rates by over 15%.

This deployment ensures data continuity, creating a dynamic and accessible foundation for virtual reality (VR) training and simulations.

Get Free Sample

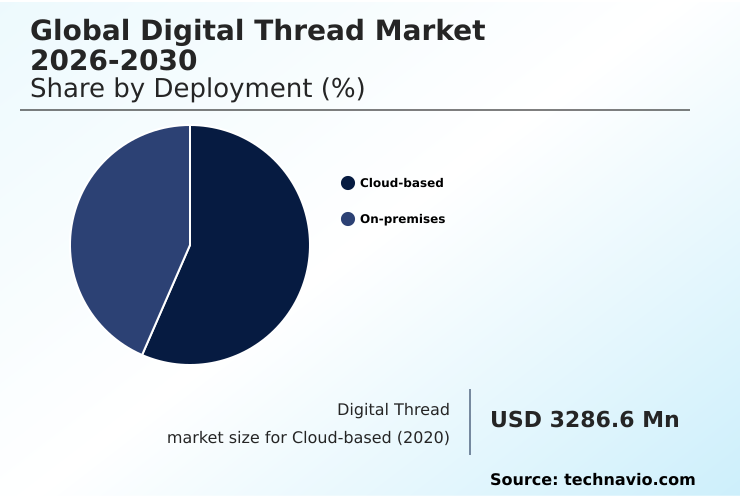
The Cloud-based segment was valued at USD 6.79 billion in 2024 and showed a gradual increase during the forecast period.

Get Free Sample

Regional Analysis

North America is estimated to contribute 39.2% to the growth of the global market during the forecast period.Technavio’s analysts have elaborately explained the regional trends and drivers that shape the market during the forecast period.

See How Digital Thread Market Demand is Rising in North America Get Free Sample

The geographic landscape is shaped by regional manufacturing priorities, with a focus on achieving a connected enterprise. In developed economies, predictive maintenance initiatives leveraging a closed-loop feedback system have reduced equipment downtime by over 25%.

These regions utilize model-based definition and semantic search capabilities for multi-disciplinary data management, enhancing quality assurance. The adoption of a compliance audit trail, supported by material history tracking, is critical for regulatory adherence.

Real-time data streaming enables agile manufacturing process optimization and asset lifecycle management.

Emerging markets are also adopting these frameworks, with a focus on creating a decentralized autonomous organization (DAO) structure to improve supply chain transparency, leading to a 15% decrease in logistical errors.

Market Dynamics

Our researchers analyzed the data with 2025 as the base year, along with the key drivers, trends, and challenges. A holistic analysis of drivers will help companies refine their marketing strategies to gain a competitive advantage.

  • Strategic inquiries into the digital thread market often focus on specific applications and comparative analyses. Key topics include the implementation of digital thread for additive manufacturing and its role in the digital thread in aerospace and defense, where precision is paramount.
  • The concept of the digital product passport for circular economy frameworks is gaining significant traction, forcing companies to address the challenge of integrating PLM MES and ERP systems. A common point of confusion is the digital twin and digital thread difference, where the former is a model and the latter is the data connection.
  • Businesses must evaluate the cost of implementing digital thread and its corresponding ROI of digital thread implementation, which can be significant. Security is another major concern, centering on securing the industrial digital thread and establishing robust data governance for digital thread.
  • Practical use cases like digital thread for predictive maintenance and digital thread for supply chain visibility offer clear value propositions, with organizations that implement a model-based enterprise reporting efficiency gains that are double those with siloed systems. The debate over cloud vs on-premise digital thread deployment continues, while the digital thread impact on quality control is universally acknowledged.
  • Future-looking discussions involve generative AI in digital thread, the digital thread for regulated industries, and the development of open standards for digital thread. Ultimately, the digital thread role in smart factory environments, its connection to the digital thread and industrial metaverse, and its application in the digital thread for automotive industry define its transformative potential.

What are the key market drivers leading to the rise in the adoption of Digital Thread Industry?

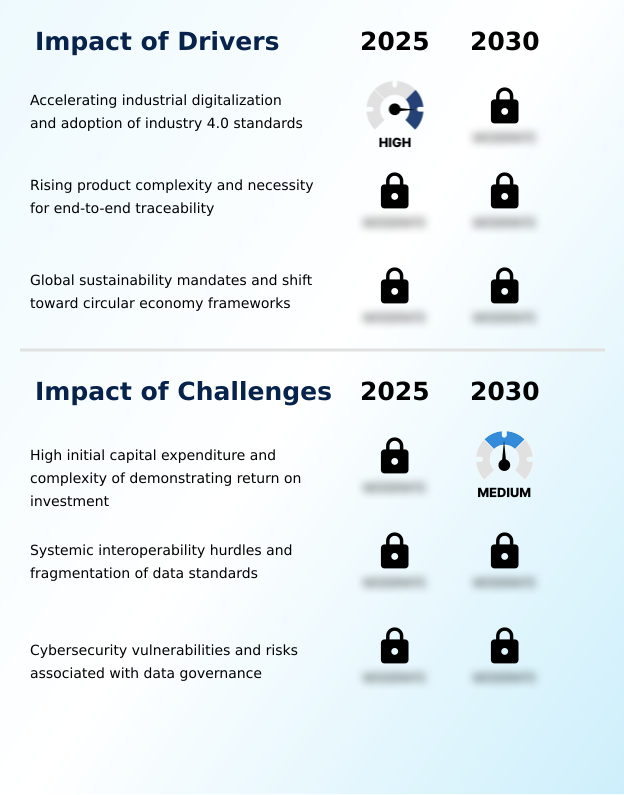
  • Accelerating industrial digitalization and the widespread adoption of Industry 4.0 standards are primary drivers for the market.

  • Market expansion is driven by the mandate for end-to-end traceability and sustainability reporting, compelling the adoption of the digital product passport.
  • This requires a robust digital backbone that ensures product data interoperability across product lifecycle management (PLM), enterprise resource planning (ERP), and manufacturing execution system (MES) platforms.
  • The integration of computer-aided design (CAD) files with operational technology (OT) data streamlines production, leading to a time-to-market reduction of over 20% in complex industries.
  • This level of connectivity is essential for regulatory compliance automation and enhances supply chain visibility, allowing organizations to meet consumer and investor demands for transparency. Enterprises that successfully link these systems report a 15% decrease in compliance-related penalties.

What are the market trends shaping the Digital Thread Industry?

  • The strategic integration of industrial AI and generative models is emerging as a significant trend, enabling automated lifecycle intelligence across enterprise systems.

  • A dominant trend is the strategic digital transformation through generative AI integration, which automates lifecycle data intelligence and supports digital twin synchronization. This shift toward smart manufacturing is enabling a more collaborative engineering environment, where data-driven decision-making is standard.
  • The convergence with the industrial metaverse, powered by physics-based simulation, allows for immersive design and testing, reducing physical prototyping costs by up to 40%. The focus on lifecycle data management within a smart factory context is enhancing service lifecycle management, with some firms seeing a 25% improvement in maintenance scheduling accuracy.
  • This evolution underscores the move toward an intelligent, responsive digital backbone that enhances supply chain transparency and operational agility across the entire product lifecycle.

What challenges does the Digital Thread Industry face during its growth?

  • The high initial capital expenditure and the complexity of demonstrating a clear return on investment present a key challenge to market growth.

  • A primary challenge is ensuring industrial cybersecurity across interconnected cyber-physical systems, especially as the industrial internet of things (IIoT) expands the attack surface. Establishing effective data governance for a decentralized digital thread that spans both information technology (IT) and operational technology presents significant complexity, with data breaches costing firms 4% of their annual revenue on average.
  • The lack of interoperability and the difficulty in reconciling as-built vs as-designed data hinder the creation of a self-healing data architecture. This forces a reliance on complex system of systems engineering and application lifecycle management.
  • Furthermore, the high computational demands often require edge computing solutions to process data locally, adding another layer of management and increasing the risk of information silo elimination failure.

Exclusive Technavio Analysis on Customer Landscape

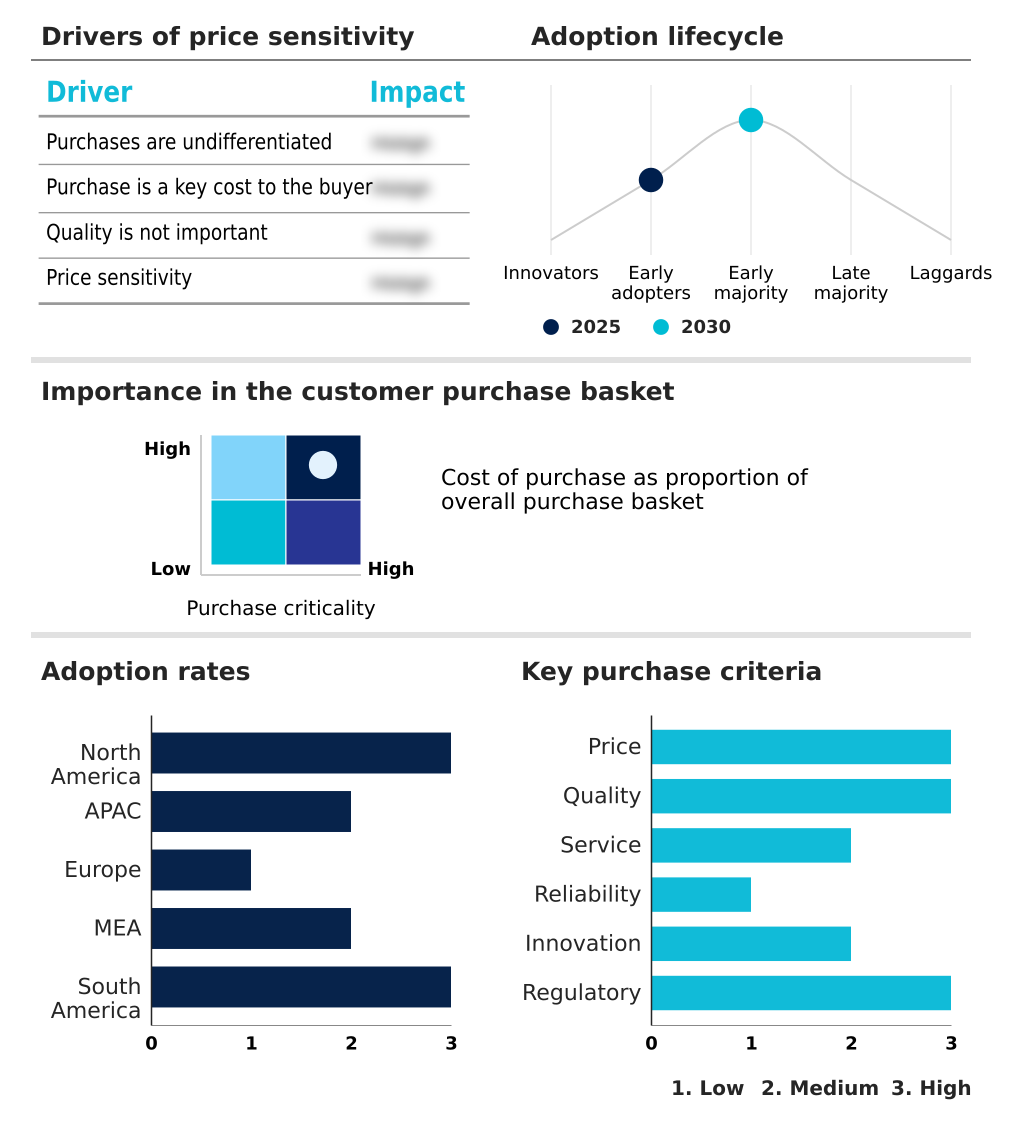
The digital thread market forecasting report includes the adoption lifecycle of the market, covering from the innovator’s stage to the laggard’s stage. It focuses on adoption rates in different regions based on penetration. Furthermore, the digital thread market report also includes key purchase criteria and drivers of price sensitivity to help companies evaluate and develop their market growth analysis strategies.

Customer Landscape of Digital Thread Industry

Competitive Landscape

Companies are implementing various strategies, such as strategic alliances, digital thread market forecast, partnerships, mergers and acquisitions, geographical expansion, and product/service launches, to enhance their presence in the industry.

Altair Engineering Inc. - Offerings provide an integrated communication framework, enabling a seamless data flow and a unified data record across the entire product lifecycle for enhanced industrial productivity.

The industry research and growth report includes detailed analyses of the competitive landscape of the market and information about key companies, including:

  • Altair Engineering Inc.
  • Amazon Web Services Inc.
  • ANSYS Inc.
  • Aras Corp.
  • Autodesk Inc.
  • AVEVA Group Ltd.
  • Bentley Systems Inc.
  • Dassault Systemes SE
  • Epicor Software Corp.
  • General Electric Co.
  • Hexagon AB
  • Honeywell International Inc.
  • IBM Corp.
  • IFS
  • Microsoft Corp.
  • Oracle Corp.
  • PTC Inc.
  • Rockwell Automation Inc.
  • SAP SE
  • Schneider Electric SE
  • Siemens AG

Qualitative and quantitative analysis of companies has been conducted to help clients understand the wider business environment as well as the strengths and weaknesses of key industry players. Data is qualitatively analyzed to categorize companies as pure play, category-focused, industry-focused, and diversified; it is quantitatively analyzed to categorize companies as dominant, leading, strong, tentative, and weak.

Recent Development and News in Digital thread market

  • In October 2025, Toyota Motor Corporation initiated a major overhaul of its digital architecture, integrating a decentralized digital thread model to accelerate its solid-state battery development programs and enhance real-time data accessibility for global research teams.
  • In October 2025, the US Department of Defense established more stringent encryption and data governance requirements for defense contractors using digital thread frameworks to counter rising cyber espionage threats against interconnected design and manufacturing data.
  • In January 2025, Siemens launched the Teamcenter Digital Reality Viewer, leveraging the NVIDIA Omniverse platform to enable immersive, real-time collaboration on large-scale digital twins within its product lifecycle management ecosystem.
  • In April 2025, the European Commission adopted the first official working plan for Digital Product Passports under the Ecodesign for Sustainable Products Regulation, setting clear timelines for mandatory sustainability data reporting across various product categories.

Dive into Technavio’s robust research methodology, blending expert interviews, extensive data synthesis, and validated models for unparalleled Digital Thread Market insights. See full methodology.

Market Scope
Page number 320
Base year 2025
Historic period 2020-2024
Forecast period 2026-2030
Growth momentum & CAGR Accelerate at a CAGR of 20.3%
Market growth 2026-2030 USD 20389.9 million
Market structure Fragmented
YoY growth 2025-2026(%) 19.1%
Key countries US, Canada, Mexico, China, Japan, India, South Korea, Australia, Singapore, Germany, UK, France, Italy, Spain, The Netherlands, Saudi Arabia, UAE, South Africa, Israel, Turkey, Brazil, Argentina and Chile
Competitive landscape Leading Companies, Market Positioning of Companies, Competitive Strategies, and Industry Risks

Request Free Sample

Research Analyst Overview

  • The digital thread market is foundational to the modern smart factory, providing a cloud-native architecture for complete enterprise data integration. It establishes a digital product passport through model-based definition and enables physics-based simulation within the industrial metaverse. The framework supports generative AI integration for advanced lifecycle data intelligence and features a self-healing data architecture.
  • By creating a closed-loop feedback system, often through a decentralized digital thread, it revolutionizes configuration management and ensures end-to-end traceability for a clear compliance audit trail. This facilitates predictive maintenance based on material history tracking and digital twin synchronization across all cyber-physical systems.
  • The technology enables real-time collaboration and leverages the industrial internet of things (IIoT) with semantic search capabilities for multi-disciplinary data management. It allows for virtual commissioning of industrial automation, improving asset performance management. Integrating operational technology (OT) and information technology (IT) with product lifecycle management (PLM), computer-aided design (CAD), and manufacturing execution system (MES) platforms is crucial.
  • This approach has proven to increase supply chain transparency, with early adopters reporting a 40% reduction in data reconciliation errors, and supports augmented reality (AR) and virtual reality (VR) applications with robust data governance.

What are the Key Data Covered in this Digital Thread Market Research and Growth Report?

  • What is the expected growth of the Digital Thread Market between 2026 and 2030?

    • USD 20.39 billion, at a CAGR of 20.3%

  • What segmentation does the market report cover?

    • The report is segmented by Deployment (Cloud-based, and On-premises), Technology (Product lifecycle management, Computer-aided design, Digital twin and simulation, Manufacturing execution systems, and Others), End-user (Automotive, Industrial manufacturing, Aerospace and defense, Energy and utilities, and Others) and Geography (North America, APAC, Europe, Middle East and Africa, South America)

  • Which regions are analyzed in the report?

    • North America, APAC, Europe, Middle East and Africa and South America

  • What are the key growth drivers and market challenges?

    • Accelerating industrial digitalization and adoption of industry 4.0 standards, High initial capital expenditure and complexity of demonstrating return on investment

  • Who are the major players in the Digital Thread Market?

    • Altair Engineering Inc., Amazon Web Services Inc., ANSYS Inc., Aras Corp., Autodesk Inc., AVEVA Group Ltd., Bentley Systems Inc., Dassault Systemes SE, Epicor Software Corp., General Electric Co., Hexagon AB, Honeywell International Inc., IBM Corp., IFS, Microsoft Corp., Oracle Corp., PTC Inc., Rockwell Automation Inc., SAP SE, Schneider Electric SE and Siemens AG

Market Research Insights

  • Market dynamics are shaped by the pursuit of a connected enterprise, where data continuity and information silo elimination are paramount. Organizations leveraging a digital backbone report up to a 30% improvement in time-to-market reduction. The emphasis on lifecycle data management and real-time data streaming supports data-driven decision-making, which has been shown to enhance quality assurance by over 20%.
  • Furthermore, establishing a collaborative engineering environment through industrial data platforms improves manufacturing process optimization and boosts operational efficiency. Firms adopting these strategies see a tangible ROI, with some achieving a 15% reduction in compliance-related costs through regulatory compliance automation.

We can help! Our analysts can customize this digital thread market research report to meet your requirements.

Get in touch

1. Executive Summary

1.1 Market overview

Executive Summary - Chart on Market Overview
Executive Summary - Data Table on Market Overview
Executive Summary - Chart on Global Market Characteristics
Executive Summary - Chart on Market by Geography
Executive Summary - Chart on Market Segmentation by Deployment
Executive Summary - Chart on Market Segmentation by Technology
Executive Summary - Chart on Market Segmentation by End-user
Executive Summary - Chart on Incremental Growth
Executive Summary - Data Table on Incremental Growth
Executive Summary - Chart on Company Market Positioning

2. Technavio Analysis

2.1 Analysis of price sensitivity, lifecycle, customer purchase basket, adoption rates, and purchase criteria

2.2 Criticality of inputs and Factors of differentiation

Chart on Overview on criticality of inputs and factors of differentiation

2.3 Factors of disruption

Chart on Overview on factors of disruption

2.4 Impact of drivers and challenges

Chart on Impact of drivers and challenges in 2025 and 2030

3. Market Landscape

3.1 Market ecosystem

Chart on Parent Market
Data Table on - Parent Market

3.2 Market characteristics

Chart on Market characteristics analysis

3.3 Value chain analysis

Chart on Value chain analysis

4. Market Sizing

4.1 Market definition

Data Table on Offerings of companies included in the market definition

4.2 Market segment analysis

Market segments

4.3 Market size 2025

4.4 Market outlook: Forecast for 2025-2030

Chart on Global - Market size and forecast 2025-2030 ($ million)
Data Table on Global - Market size and forecast 2025-2030 ($ million)
Chart on Global Market: Year-over-year growth 2025-2030 (%)
Data Table on Global Market: Year-over-year growth 2025-2030 (%)

5. Historic Market Size

5.1 Global Digital Thread Market 2020 - 2024

Historic Market Size - Data Table on Global Digital Thread Market 2020 - 2024 ($ million)

5.2 Deployment segment analysis 2020 - 2024

Historic Market Size - Deployment Segment 2020 - 2024 ($ million)

5.3 Technology segment analysis 2020 - 2024

Historic Market Size - Technology Segment 2020 - 2024 ($ million)

5.4 End-user segment analysis 2020 - 2024

Historic Market Size - End-user Segment 2020 - 2024 ($ million)

5.5 Geography segment analysis 2020 - 2024

Historic Market Size - Geography Segment 2020 - 2024 ($ million)

5.6 Country segment analysis 2020 - 2024

Historic Market Size - Country Segment 2020 - 2024 ($ million)

6. Qualitative Analysis

6.1 Impact of AI on Global Digital Thread Market

6.2 Impact of geopolitical conflicts on Global Digital Thread Market

7. Five Forces Analysis

7.1 Five forces summary

Five forces analysis - Comparison between 2025 and 2030

7.2 Bargaining power of buyers

Bargaining power of buyers - Impact of key factors 2025 and 2030

7.3 Bargaining power of suppliers

Bargaining power of suppliers - Impact of key factors in 2025 and 2030

7.4 Threat of new entrants

Threat of new entrants - Impact of key factors in 2025 and 2030

7.5 Threat of substitutes

Threat of substitutes - Impact of key factors in 2025 and 2030

7.6 Threat of rivalry

Threat of rivalry - Impact of key factors in 2025 and 2030

7.7 Market condition

Chart on Market condition - Five forces 2025 and 2030

8. Market Segmentation by Deployment

8.1 Market segments

Chart on Deployment - Market share 2025-2030 (%)
Data Table on Deployment - Market share 2025-2030 (%)

8.2 Comparison by Deployment

Chart on Comparison by Deployment
Data Table on Comparison by Deployment

8.3 Cloud-based - Market size and forecast 2025-2030

Chart on Cloud-based - Market size and forecast 2025-2030 ($ million)
Data Table on Cloud-based - Market size and forecast 2025-2030 ($ million)
Chart on Cloud-based - Year-over-year growth 2025-2030 (%)
Data Table on Cloud-based - Year-over-year growth 2025-2030 (%)

8.4 On-premises - Market size and forecast 2025-2030

Chart on On-premises - Market size and forecast 2025-2030 ($ million)
Data Table on On-premises - Market size and forecast 2025-2030 ($ million)
Chart on On-premises - Year-over-year growth 2025-2030 (%)
Data Table on On-premises - Year-over-year growth 2025-2030 (%)

8.5 Market opportunity by Deployment

Market opportunity by Deployment ($ million)
Data Table on Market opportunity by Deployment ($ million)

9. Market Segmentation by Technology

9.1 Market segments

Chart on Technology - Market share 2025-2030 (%)
Data Table on Technology - Market share 2025-2030 (%)

9.2 Comparison by Technology

Chart on Comparison by Technology
Data Table on Comparison by Technology

9.3 Product lifecycle management - Market size and forecast 2025-2030

Chart on Product lifecycle management - Market size and forecast 2025-2030 ($ million)
Data Table on Product lifecycle management - Market size and forecast 2025-2030 ($ million)
Chart on Product lifecycle management - Year-over-year growth 2025-2030 (%)
Data Table on Product lifecycle management - Year-over-year growth 2025-2030 (%)

9.4 Computer-aided design - Market size and forecast 2025-2030

Chart on Computer-aided design - Market size and forecast 2025-2030 ($ million)
Data Table on Computer-aided design - Market size and forecast 2025-2030 ($ million)
Chart on Computer-aided design - Year-over-year growth 2025-2030 (%)
Data Table on Computer-aided design - Year-over-year growth 2025-2030 (%)

9.5 Digital twin and simulation - Market size and forecast 2025-2030

Chart on Digital twin and simulation - Market size and forecast 2025-2030 ($ million)
Data Table on Digital twin and simulation - Market size and forecast 2025-2030 ($ million)
Chart on Digital twin and simulation - Year-over-year growth 2025-2030 (%)
Data Table on Digital twin and simulation - Year-over-year growth 2025-2030 (%)

9.6 Manufacturing execution systems - Market size and forecast 2025-2030

Chart on Manufacturing execution systems - Market size and forecast 2025-2030 ($ million)
Data Table on Manufacturing execution systems - Market size and forecast 2025-2030 ($ million)
Chart on Manufacturing execution systems - Year-over-year growth 2025-2030 (%)
Data Table on Manufacturing execution systems - Year-over-year growth 2025-2030 (%)

9.7 Others - Market size and forecast 2025-2030

Chart on Others - Market size and forecast 2025-2030 ($ million)
Data Table on Others - Market size and forecast 2025-2030 ($ million)
Chart on Others - Year-over-year growth 2025-2030 (%)
Data Table on Others - Year-over-year growth 2025-2030 (%)

9.8 Market opportunity by Technology

Market opportunity by Technology ($ million)
Data Table on Market opportunity by Technology ($ million)

10. Market Segmentation by End-user

10.1 Market segments

Chart on End-user - Market share 2025-2030 (%)
Data Table on End-user - Market share 2025-2030 (%)

10.2 Comparison by End-user

Chart on Comparison by End-user
Data Table on Comparison by End-user

10.3 Automotive - Market size and forecast 2025-2030

Chart on Automotive - Market size and forecast 2025-2030 ($ million)
Data Table on Automotive - Market size and forecast 2025-2030 ($ million)
Chart on Automotive - Year-over-year growth 2025-2030 (%)
Data Table on Automotive - Year-over-year growth 2025-2030 (%)

10.4 Industrial manufacturing - Market size and forecast 2025-2030

Chart on Industrial manufacturing - Market size and forecast 2025-2030 ($ million)
Data Table on Industrial manufacturing - Market size and forecast 2025-2030 ($ million)
Chart on Industrial manufacturing - Year-over-year growth 2025-2030 (%)
Data Table on Industrial manufacturing - Year-over-year growth 2025-2030 (%)

10.5 Aerospace and defense - Market size and forecast 2025-2030

Chart on Aerospace and defense - Market size and forecast 2025-2030 ($ million)
Data Table on Aerospace and defense - Market size and forecast 2025-2030 ($ million)
Chart on Aerospace and defense - Year-over-year growth 2025-2030 (%)
Data Table on Aerospace and defense - Year-over-year growth 2025-2030 (%)

10.6 Energy and utilities - Market size and forecast 2025-2030

Chart on Energy and utilities - Market size and forecast 2025-2030 ($ million)
Data Table on Energy and utilities - Market size and forecast 2025-2030 ($ million)
Chart on Energy and utilities - Year-over-year growth 2025-2030 (%)
Data Table on Energy and utilities - Year-over-year growth 2025-2030 (%)

10.7 Others - Market size and forecast 2025-2030

Chart on Others - Market size and forecast 2025-2030 ($ million)
Data Table on Others - Market size and forecast 2025-2030 ($ million)
Chart on Others - Year-over-year growth 2025-2030 (%)
Data Table on Others - Year-over-year growth 2025-2030 (%)

10.8 Market opportunity by End-user

Market opportunity by End-user ($ million)
Data Table on Market opportunity by End-user ($ million)

11. Customer Landscape

11.1 Customer landscape overview

Analysis of price sensitivity, lifecycle, customer purchase basket, adoption rates, and purchase criteria

12. Geographic Landscape

12.1 Geographic segmentation

Chart on Market share by geography 2025-2030 (%)
Data Table on Market share by geography 2025-2030 (%)

12.2 Geographic comparison

Chart on Geographic comparison
Data Table on Geographic comparison

12.3 North America - Market size and forecast 2025-2030

Chart on North America - Market size and forecast 2025-2030 ($ million)
Data Table on North America - Market size and forecast 2025-2030 ($ million)
Chart on North America - Year-over-year growth 2025-2030 (%)
Data Table on North America - Year-over-year growth 2025-2030 (%)
Chart on Regional Comparison - North America
Data Table on Regional Comparison - North America

12.3.1 US - Market size and forecast 2025-2030

Chart on US - Market size and forecast 2025-2030 ($ million)
Data Table on US - Market size and forecast 2025-2030 ($ million)
Chart on US - Year-over-year growth 2025-2030 (%)
Data Table on US - Year-over-year growth 2025-2030 (%)

12.3.2 Canada - Market size and forecast 2025-2030

Chart on Canada - Market size and forecast 2025-2030 ($ million)
Data Table on Canada - Market size and forecast 2025-2030 ($ million)
Chart on Canada - Year-over-year growth 2025-2030 (%)
Data Table on Canada - Year-over-year growth 2025-2030 (%)

12.3.3 Mexico - Market size and forecast 2025-2030

Chart on Mexico - Market size and forecast 2025-2030 ($ million)
Data Table on Mexico - Market size and forecast 2025-2030 ($ million)
Chart on Mexico - Year-over-year growth 2025-2030 (%)
Data Table on Mexico - Year-over-year growth 2025-2030 (%)

12.4 APAC - Market size and forecast 2025-2030

Chart on APAC - Market size and forecast 2025-2030 ($ million)
Data Table on APAC - Market size and forecast 2025-2030 ($ million)
Chart on APAC - Year-over-year growth 2025-2030 (%)
Data Table on APAC - Year-over-year growth 2025-2030 (%)
Chart on Regional Comparison - APAC
Data Table on Regional Comparison - APAC

12.4.1 China - Market size and forecast 2025-2030

Chart on China - Market size and forecast 2025-2030 ($ million)
Data Table on China - Market size and forecast 2025-2030 ($ million)
Chart on China - Year-over-year growth 2025-2030 (%)
Data Table on China - Year-over-year growth 2025-2030 (%)

12.4.2 Japan - Market size and forecast 2025-2030

Chart on Japan - Market size and forecast 2025-2030 ($ million)
Data Table on Japan - Market size and forecast 2025-2030 ($ million)
Chart on Japan - Year-over-year growth 2025-2030 (%)
Data Table on Japan - Year-over-year growth 2025-2030 (%)

12.4.3 India - Market size and forecast 2025-2030

Chart on India - Market size and forecast 2025-2030 ($ million)
Data Table on India - Market size and forecast 2025-2030 ($ million)
Chart on India - Year-over-year growth 2025-2030 (%)
Data Table on India - Year-over-year growth 2025-2030 (%)

12.4.4 South Korea - Market size and forecast 2025-2030

Chart on South Korea - Market size and forecast 2025-2030 ($ million)
Data Table on South Korea - Market size and forecast 2025-2030 ($ million)
Chart on South Korea - Year-over-year growth 2025-2030 (%)
Data Table on South Korea - Year-over-year growth 2025-2030 (%)

12.4.5 Australia - Market size and forecast 2025-2030

Chart on Australia - Market size and forecast 2025-2030 ($ million)
Data Table on Australia - Market size and forecast 2025-2030 ($ million)
Chart on Australia - Year-over-year growth 2025-2030 (%)
Data Table on Australia - Year-over-year growth 2025-2030 (%)

12.4.6 Singapore - Market size and forecast 2025-2030

Chart on Singapore - Market size and forecast 2025-2030 ($ million)
Data Table on Singapore - Market size and forecast 2025-2030 ($ million)
Chart on Singapore - Year-over-year growth 2025-2030 (%)
Data Table on Singapore - Year-over-year growth 2025-2030 (%)

12.5 Europe - Market size and forecast 2025-2030

Chart on Europe - Market size and forecast 2025-2030 ($ million)
Data Table on Europe - Market size and forecast 2025-2030 ($ million)
Chart on Europe - Year-over-year growth 2025-2030 (%)
Data Table on Europe - Year-over-year growth 2025-2030 (%)
Chart on Regional Comparison - Europe
Data Table on Regional Comparison - Europe

12.5.1 Germany - Market size and forecast 2025-2030

Chart on Germany - Market size and forecast 2025-2030 ($ million)
Data Table on Germany - Market size and forecast 2025-2030 ($ million)
Chart on Germany - Year-over-year growth 2025-2030 (%)
Data Table on Germany - Year-over-year growth 2025-2030 (%)

12.5.2 UK - Market size and forecast 2025-2030

Chart on UK - Market size and forecast 2025-2030 ($ million)
Data Table on UK - Market size and forecast 2025-2030 ($ million)
Chart on UK - Year-over-year growth 2025-2030 (%)
Data Table on UK - Year-over-year growth 2025-2030 (%)

12.5.3 France - Market size and forecast 2025-2030

Chart on France - Market size and forecast 2025-2030 ($ million)
Data Table on France - Market size and forecast 2025-2030 ($ million)
Chart on France - Year-over-year growth 2025-2030 (%)
Data Table on France - Year-over-year growth 2025-2030 (%)

12.5.4 Italy - Market size and forecast 2025-2030

Chart on Italy - Market size and forecast 2025-2030 ($ million)
Data Table on Italy - Market size and forecast 2025-2030 ($ million)
Chart on Italy - Year-over-year growth 2025-2030 (%)
Data Table on Italy - Year-over-year growth 2025-2030 (%)

12.5.5 Spain - Market size and forecast 2025-2030

Chart on Spain - Market size and forecast 2025-2030 ($ million)
Data Table on Spain - Market size and forecast 2025-2030 ($ million)
Chart on Spain - Year-over-year growth 2025-2030 (%)
Data Table on Spain - Year-over-year growth 2025-2030 (%)

12.5.6 The Netherlands - Market size and forecast 2025-2030

Chart on The Netherlands - Market size and forecast 2025-2030 ($ million)
Data Table on The Netherlands - Market size and forecast 2025-2030 ($ million)
Chart on The Netherlands - Year-over-year growth 2025-2030 (%)
Data Table on The Netherlands - Year-over-year growth 2025-2030 (%)

12.6 Middle East and Africa - Market size and forecast 2025-2030

Chart on Middle East and Africa - Market size and forecast 2025-2030 ($ million)
Data Table on Middle East and Africa - Market size and forecast 2025-2030 ($ million)
Chart on Middle East and Africa - Year-over-year growth 2025-2030 (%)
Data Table on Middle East and Africa - Year-over-year growth 2025-2030 (%)
Chart on Regional Comparison - Middle East and Africa
Data Table on Regional Comparison - Middle East and Africa

12.6.1 Saudi Arabia - Market size and forecast 2025-2030

Chart on Saudi Arabia - Market size and forecast 2025-2030 ($ million)
Data Table on Saudi Arabia - Market size and forecast 2025-2030 ($ million)
Chart on Saudi Arabia - Year-over-year growth 2025-2030 (%)
Data Table on Saudi Arabia - Year-over-year growth 2025-2030 (%)

12.6.2 UAE - Market size and forecast 2025-2030

Chart on UAE - Market size and forecast 2025-2030 ($ million)
Data Table on UAE - Market size and forecast 2025-2030 ($ million)
Chart on UAE - Year-over-year growth 2025-2030 (%)
Data Table on UAE - Year-over-year growth 2025-2030 (%)

12.6.3 South Africa - Market size and forecast 2025-2030

Chart on South Africa - Market size and forecast 2025-2030 ($ million)
Data Table on South Africa - Market size and forecast 2025-2030 ($ million)
Chart on South Africa - Year-over-year growth 2025-2030 (%)
Data Table on South Africa - Year-over-year growth 2025-2030 (%)

12.6.4 Israel - Market size and forecast 2025-2030

Chart on Israel - Market size and forecast 2025-2030 ($ million)
Data Table on Israel - Market size and forecast 2025-2030 ($ million)
Chart on Israel - Year-over-year growth 2025-2030 (%)
Data Table on Israel - Year-over-year growth 2025-2030 (%)

12.6.5 Turkey - Market size and forecast 2025-2030

Chart on Turkey - Market size and forecast 2025-2030 ($ million)
Data Table on Turkey - Market size and forecast 2025-2030 ($ million)
Chart on Turkey - Year-over-year growth 2025-2030 (%)
Data Table on Turkey - Year-over-year growth 2025-2030 (%)

12.7 South America - Market size and forecast 2025-2030

Chart on South America - Market size and forecast 2025-2030 ($ million)
Data Table on South America - Market size and forecast 2025-2030 ($ million)
Chart on South America - Year-over-year growth 2025-2030 (%)
Data Table on South America - Year-over-year growth 2025-2030 (%)
Chart on Regional Comparison - South America
Data Table on Regional Comparison - South America

12.7.1 Brazil - Market size and forecast 2025-2030

Chart on Brazil - Market size and forecast 2025-2030 ($ million)
Data Table on Brazil - Market size and forecast 2025-2030 ($ million)
Chart on Brazil - Year-over-year growth 2025-2030 (%)
Data Table on Brazil - Year-over-year growth 2025-2030 (%)

12.7.2 Argentina - Market size and forecast 2025-2030

Chart on Argentina - Market size and forecast 2025-2030 ($ million)
Data Table on Argentina - Market size and forecast 2025-2030 ($ million)
Chart on Argentina - Year-over-year growth 2025-2030 (%)
Data Table on Argentina - Year-over-year growth 2025-2030 (%)

12.7.3 Chile - Market size and forecast 2025-2030

Chart on Chile - Market size and forecast 2025-2030 ($ million)
Data Table on Chile - Market size and forecast 2025-2030 ($ million)
Chart on Chile - Year-over-year growth 2025-2030 (%)
Data Table on Chile - Year-over-year growth 2025-2030 (%)

12.8 Market opportunity by geography

Market opportunity by geography ($ million)
Data Tables on Market opportunity by geography ($ million)

13. Drivers, Challenges, and Opportunity

13.1 Market drivers

Accelerating industrial digitalization and adoption of industry 4.0 standards
Rising product complexity and necessity for end-to-end traceability
Global sustainability mandates and shift toward circular economy frameworks

13.2 Market challenges

High initial capital expenditure and complexity of demonstrating return on investment
Systemic interoperability hurdles and fragmentation of data standards
Cybersecurity vulnerabilities and risks associated with data governance

13.3 Impact of drivers and challenges

Impact of drivers and challenges in 2025 and 2030

13.4 Market opportunities

Strategic integration of industrial AI and generative models for automated lifecycle intelligence
Convergence of digital thread architectures and industrial metaverse for real-time immersive collaboration
Escalating regulatory demands for product traceability and deployment of digital product passports

14. Competitive Landscape

14.1 Overview

14.2

Overview on criticality of inputs and factors of differentiation

14.3 Landscape disruption

Overview on factors of disruption

14.4 Industry risks

Impact of key risks on business

15. Competitive Analysis

15.1 Companies profiled

Companies covered

15.2 Company ranking index

15.3 Market positioning of companies

Matrix on companies position and classification

15.4 Altair Engineering Inc.

Altair Engineering Inc. - Overview
Altair Engineering Inc. - Product / Service
Altair Engineering Inc. - Key offerings
SWOT

15.5 ANSYS Inc.

ANSYS Inc. - Overview
ANSYS Inc. - Business segments
ANSYS Inc. - Key offerings
ANSYS Inc. - Segment focus
SWOT

15.6 Aras Corp.

Aras Corp. - Overview
Aras Corp. - Product / Service
Aras Corp. - Key offerings
SWOT

15.7 Autodesk Inc.

Autodesk Inc. - Overview
Autodesk Inc. - Business segments
Autodesk Inc. - Key offerings
Autodesk Inc. - Segment focus
SWOT

15.8 AVEVA Group Ltd.

AVEVA Group Ltd. - Overview
AVEVA Group Ltd. - Product / Service
AVEVA Group Ltd. - Key offerings
SWOT

15.9 Bentley Systems Inc.

Bentley Systems Inc. - Overview
Bentley Systems Inc. - Business segments
Bentley Systems Inc. - Key offerings
Bentley Systems Inc. - Segment focus
SWOT

15.10 Dassault Systemes SE

Dassault Systemes SE - Overview
Dassault Systemes SE - Business segments
Dassault Systemes SE - Key offerings
Dassault Systemes SE - Segment focus
SWOT

15.11 Hexagon AB

Hexagon AB - Overview
Hexagon AB - Business segments
Hexagon AB - Key news
Hexagon AB - Key offerings
Hexagon AB - Segment focus
SWOT

15.12 IBM Corp.

IBM Corp. - Overview
IBM Corp. - Business segments
IBM Corp. - Key news
IBM Corp. - Key offerings
IBM Corp. - Segment focus
SWOT

15.13 Microsoft Corp.

Microsoft Corp. - Overview
Microsoft Corp. - Business segments
Microsoft Corp. - Key news
Microsoft Corp. - Key offerings
Microsoft Corp. - Segment focus
SWOT

15.14 Oracle Corp.

Oracle Corp. - Overview
Oracle Corp. - Business segments
Oracle Corp. - Key news
Oracle Corp. - Key offerings
Oracle Corp. - Segment focus
SWOT

15.15 PTC Inc.

PTC Inc. - Overview
PTC Inc. - Business segments
PTC Inc. - Key offerings
PTC Inc. - Segment focus
SWOT

15.16 Rockwell Automation Inc.

Rockwell Automation Inc. - Overview
Rockwell Automation Inc. - Business segments
Rockwell Automation Inc. - Key news
Rockwell Automation Inc. - Key offerings
Rockwell Automation Inc. - Segment focus
SWOT

15.17 SAP SE

SAP SE - Overview
SAP SE - Business segments
SAP SE - Key news
SAP SE - Key offerings
SAP SE - Segment focus
SWOT

15.18 Siemens AG

Siemens AG - Overview
Siemens AG - Business segments
Siemens AG - Key news
Siemens AG - Key offerings
Siemens AG - Segment focus
SWOT

16. Appendix

16.1 Scope of the report

Market definition
Objectives
Notes and caveats

16.2 Inclusions and exclusions checklist

Inclusions checklist
Exclusions checklist

16.3 Currency conversion rates for US$

16.4 Research methodology

16.5 Data procurement

Information sources

16.6 Data validation

16.7 Validation techniques employed for market sizing

16.8 Data synthesis

16.9 360 degree market analysis

16.10 List of abbreviations

Research Methodology

Technavio presents a detailed picture of the market by way of study, synthesis, and summation of data from multiple sources. The analysts have presented the various facets of the market with a particular focus on identifying the key industry influencers. The data thus presented is comprehensive, reliable, and the result of extensive research, both primary and secondary.

INFORMATION SOURCES

Primary sources

  • Manufacturers and suppliers
  • Channel partners
  • Industry experts
  • Strategic decision makers

Secondary sources

  • Industry journals and periodicals
  • Government data
  • Financial reports of key industry players
  • Historical data
  • Press releases

DATA ANALYSIS

Data Synthesis

  • Collation of data
  • Estimation of key figures
  • Analysis of derived insights

Data Validation

  • Triangulation with data models
  • Reference against proprietary databases
  • Corroboration with industry experts

REPORT WRITING

Qualitative

  • Market drivers
  • Market challenges
  • Market trends
  • Five forces analysis

Quantitative

  • Market size and forecast
  • Market segmentation
  • Geographical insights
  • Competitive landscape

Interested in this report?

Get your sample now to see our research methodology and insights!

Download Now

Frequently Asked Questions

Digital Thread market growth will increase by USD 20389.9 million during 2026-2030.

The Digital Thread market is expected to grow at a CAGR of 20.3% during 2026-2030.

Digital Thread market is segmented by Deployment (Cloud-based, On-premises) Technology (Product lifecycle management, Computer-aided design, Digital twin and simulation, Manufacturing execution systems, Others) End-user (Automotive, Industrial manufacturing, Aerospace and defense, Energy and utilities, Others)

Altair Engineering Inc., Amazon Web Services Inc., ANSYS Inc., Aras Corp., Autodesk Inc., AVEVA Group Ltd., Bentley Systems Inc., Dassault Systemes SE, Epicor Software Corp., General Electric Co., Hexagon AB, Honeywell International Inc., IBM Corp., IFS, Microsoft Corp., Oracle Corp., PTC Inc., Rockwell Automation Inc., SAP SE, Schneider Electric SE, Siemens AG are a few of the key vendors in the Digital Thread market.

North America will register the highest growth rate of 39.2% among the other regions. Therefore, the Digital Thread market in North America is expected to garner significant business opportunities for the vendors during the forecast period.

US, Canada, Mexico, China, Japan, India, South Korea, Australia, Singapore, Germany, UK, France, Italy, Spain, The Netherlands, Saudi Arabia, UAE, South Africa, Israel, Turkey, Brazil, Argentina, Chile

  • Accelerating industrial digitalization and adoption of industry 4.0 standards is the driving factor this market.

The Digital Thread market vendors should focus on grabbing business opportunities from the Deployment segment as it accounted for the largest market share in the base year.
RIA - Research AI Assistant
Ask RIA