Digital Transformation In Oil And Gas Industry Market Analysis, Size, and Forecast 2026-2030: APAC (China, Japan, and India), North America (US, Canada, and Mexico), Middle East and Africa (Saudi Arabia, UAE, and South Africa), Europe (Germany, UK, and France), South America (Brazil and Argentina), and Rest of World (ROW)

Digital Transformation In Oil And Gas Industry Market Analysis, Size, and Forecast 2026-2030:
APAC (China, Japan, and India), North America (US, Canada, and Mexico), Middle East and Africa (Saudi Arabia, UAE, and South Africa), Europe (Germany, UK, and France), South America (Brazil and Argentina), and Rest of World (ROW)

Published: May 2026 312 Pages SKU: IRTNTR71703

Market Overview at a Glance

$69.76 B
Market Opportunity
15.6%
CAGR 2025 - 2030
36.3%
APAC Growth
$20.85 B
IoT segment 2024

Digital Transformation In Oil And Gas Industry Market Size 2026-2030

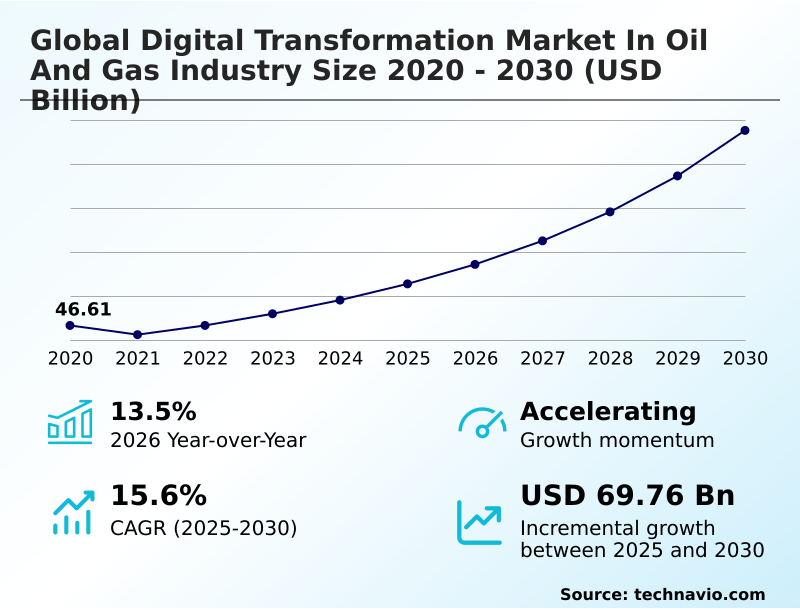
The digital transformation in oil and gas industry market size is valued to increase by USD 69.76 billion, at a CAGR of 15.6% from 2025 to 2030. Institutionalization of agentic AI and autonomous decision intelligence will drive the digital transformation in oil and gas industry market.

Major Market Trends & Insights

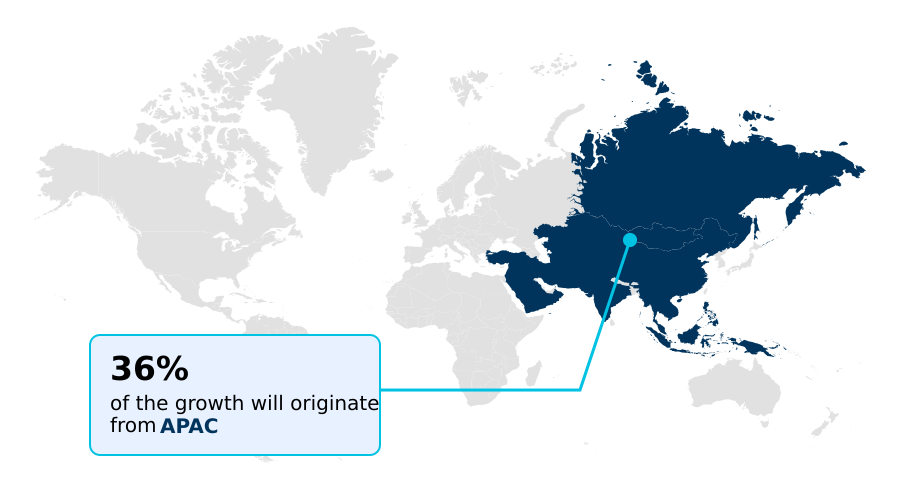
  • APAC dominated the market and accounted for a 36.3% growth during the forecast period.
  • By Technology - IoT segment was valued at USD 20.85 billion in 2024
  • By Sector - Downstream segment accounted for the largest market revenue share in 2024

Market Size & Forecast

  • Market Opportunities: USD 88.66 billion
  • Market Future Opportunities: USD 69.76 billion
  • CAGR from 2025 to 2030 : 15.6%

Market Summary

  • The digital transformation market in oil and gas industry is undergoing a structural shift, moving from legacy processes to data-centric operational models. This evolution is driven by the need for greater efficiency and safety, leveraging a data-driven operational framework built on the industrial internet of things (IIoT), high-performance computing, and machine learning algorithms.
  • The deployment of agentic AI and digital twins enables predictive maintenance and predictive simulation, significantly reducing operational risks. In one business scenario, an operator utilizes an integrated asset management system to monitor a network of remote subsea pipelines.
  • By applying predictive analytics to sensor data, the system identifies a potential integrity issue, automatically rerouting flow and scheduling a robotic subsea inspection, thereby preventing a costly and environmentally damaging failure. The integration of such technologies is no longer optional but a core component of strategy, addressing challenges from technical debt in legacy infrastructure to the complexities of IT/OT cybersecurity.
  • This transition towards a digital oilfield, supported by cloud-native architectures and zero-trust security, underpins the industry's future resilience and sustainability.

What will be the Size of the Digital Transformation In Oil And Gas Industry Market during the forecast period?

Get Key Insights on Market Forecast (PDF) Get Free Sample

How is the Digital Transformation In Oil And Gas Industry Market Segmented?

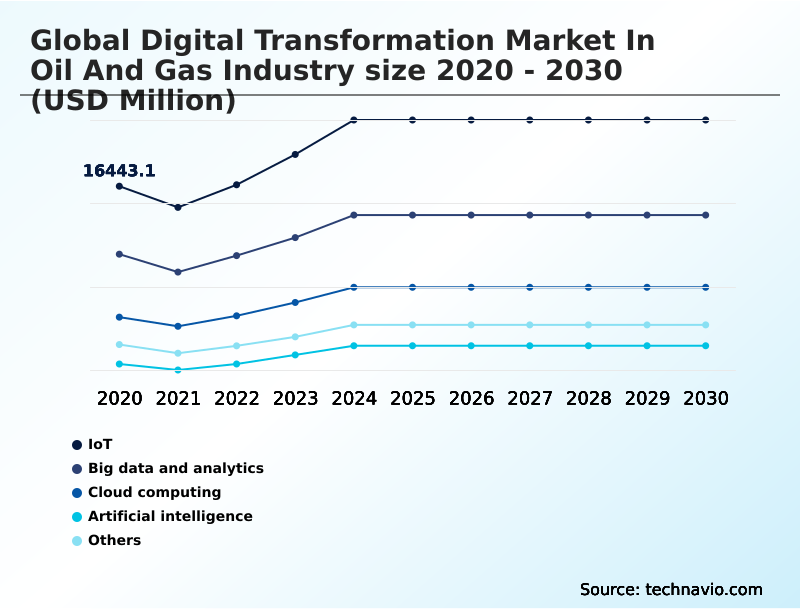
The digital transformation in oil and gas industry industry research report provides comprehensive data (region-wise segment analysis), with forecasts and estimates in "USD million" for the period 2026-2030, as well as historical data from 2020-2024 for the following segments.

  • Technology
    • IoT
    • Big data and analytics
    • Cloud computing
    • Artificial intelligence
    • Others
  • Sector
    • Downstream
    • Upstream
    • Midstream
  • Component
    • Software
    • Hardware
    • Services
  • Geography
    • APAC
      • China
      • Japan
      • India
    • North America
      • US
      • Canada
      • Mexico
    • Middle East and Africa
      • Saudi Arabia
      • UAE
      • South Africa
    • Europe
      • Germany
      • UK
      • France
    • South America
      • Brazil
      • Argentina
    • Rest of World (ROW)

By Technology Insights

The iot segment is estimated to witness significant growth during the forecast period.

The industrial internet of things (IIoT) segment is foundational, enabling a data-driven operational framework through extensive real-time data acquisition from remote and hazardous environments.

This involves deploying smart sensors across the value chain for pipeline integrity monitoring and midstream logistics optimization.

This shift from reactive maintenance to proactive, condition-based monitoring leverages edge computing to process information locally, which reduces the need for manual inspections in high-risk zones.

Integrating these IIoT systems with legacy supervisory control and data acquisition (SCADA) and operational technology (OT) hardware is critical.

This digital foundation, which powers everything from real-time reservoir modeling to downstream process optimization, allows for unprecedented visibility, helping to prevent up to 80% of catastrophic equipment failures.

Get Free Sample

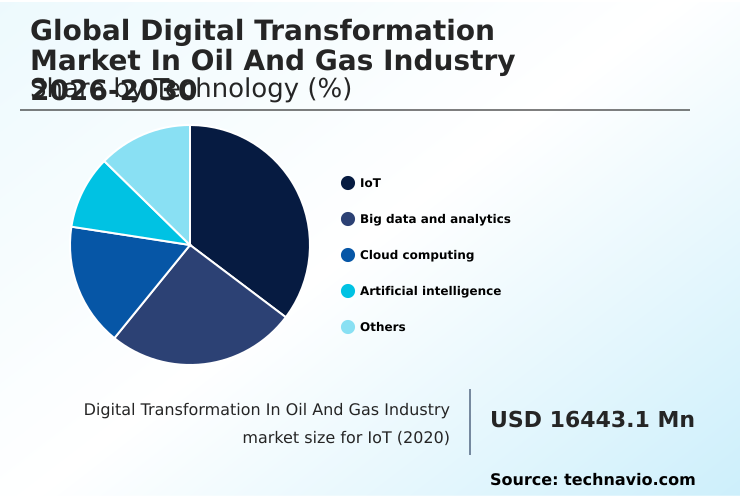
The IoT segment was valued at USD 20.85 billion in 2024 and showed a gradual increase during the forecast period.

Get Free Sample

Regional Analysis

APAC is estimated to contribute 36.3% to the growth of the global market during the forecast period.Technavio’s analysts have elaborately explained the regional trends and drivers that shape the market during the forecast period.

See How Digital Transformation In Oil And Gas Industry Market Demand is Rising in APAC Get Free Sample

The geographic landscape is increasingly defined by regional priorities in digitalization, with APAC emerging as a significant growth engine, contributing over 36% of the market's incremental growth.

In this region, the focus is on deploying cloud-native architectures and smart refineries, using machine learning algorithms to optimize production. North America continues to lead in the adoption of remote operations centers, while the Middle East pioneers large-scale predictive simulation.

The use of blockchain for supply chain verification is gaining traction globally to improve transparency through decentralized ledgers.

This technology, combined with computer vision for automated inspections and natural language processing for analyzing technical documents, is creating a more interconnected and efficient global energy ecosystem. These regional adaptations underscore a universal push toward digital modernization.

Market Dynamics

Our researchers analyzed the data with 2025 as the base year, along with the key drivers, trends, and challenges. A holistic analysis of drivers will help companies refine their marketing strategies to gain a competitive advantage.

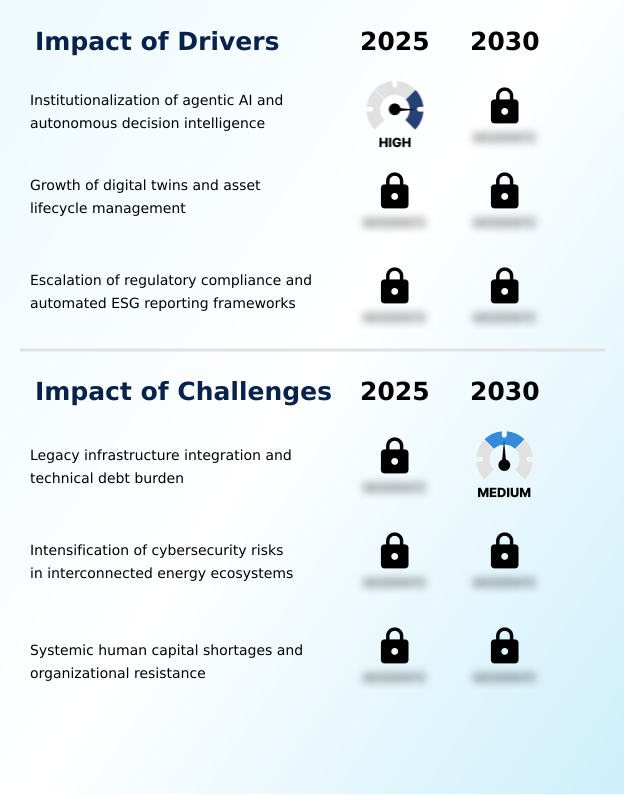
  • Achieving operational excellence in the modern energy sector increasingly depends on mastering specific digital applications. The use of agentic AI in operational workflows is transitioning from pilot projects to core strategy, enabling autonomous decision-making that optimizes complex processes.
  • This is complemented by the deployment of digital twins for asset management, which provide virtual replicas of physical infrastructure for risk-free simulation and planning. The growing pressure for sustainability is driving the adoption of automated ESG reporting frameworks, which leverage AI for predictive maintenance scheduling and ensure transparent compliance.
  • In the upstream sector, generative AI in reservoir engineering and high-performance computing for seismic data are shortening exploration cycles. For instance, firms using AI-driven seismic analysis have reported identifying viable hydrocarbon deposits over 30% faster than those using traditional methods.
  • Concurrently, the use of robotic systems for subsea inspection and autonomous drones for pipeline surveillance is enhancing safety and reducing operational costs. Securing these interconnected assets is paramount, leading to a focus on unified cybersecurity for IT and OT and the implementation of a zero-trust architecture in OT environments.
  • The integration of industrial IoT for remote monitoring, edge computing for low-latency control, and cloud-native industrial data platforms creates a resilient foundation.
  • Furthermore, technologies like blockchain for energy supply chains, machine learning for production optimization, and NLP for technical document analysis are essential for creating the smart refinery and digital oilfield of the future, all while navigating the complexities of integrating legacy SCADA systems.

What are the key market drivers leading to the rise in the adoption of Digital Transformation In Oil And Gas Industry Industry?

  • A key market driver is the institutionalization of agentic AI and autonomous decision intelligence layers across complex operational workflows.

  • Market growth is primarily driven by the institutionalization of autonomous decision intelligence and agentic AI, which facilitate self-correcting systems and software-led orchestration across operations.
  • This shift enables the deployment of high-fidelity digital twins for comprehensive asset lifecycle management, allowing for predictive simulations that optimize capital expenditure and extend infrastructure longevity.
  • The use of AI-powered monitoring systems and spatial data analytics provides granular operational insights, leading to a more data-driven corporate culture. Furthermore, escalating regulatory mandates for environmental, social, and governance (ESG) compliance are compelling operators to adopt automated ESG reporting.
  • This involves using digital tools to provide real-time emissions data, ensuring firms can meet decarbonization targets and secure green financing, with automated systems reducing compliance reporting errors by up to 60%.

What are the market trends shaping the Digital Transformation In Oil And Gas Industry Industry?

  • A key market trend is the industrialization of generative AI to address complex subsurface and reservoir engineering challenges. This involves using advanced algorithms to synthesize geological data for high-fidelity drilling models.

  • Key market trends are centered on the industrialization of AI and automation for complex engineering tasks. The use of generative AI and generative design tools for reservoir engineering is enabling a new level of computational exploration, significantly shortening the time to identify viable hydrocarbon deposits. This is complemented by advancements in seismic imaging, allowing for more precise subsurface modeling.
  • In parallel, the digital oilfield concept is expanding into hazardous environments through the deployment of robotic subsea inspection systems. These resident robotic systems and autonomous underwater vehicles are transforming subsea engineering and wellbore management.
  • The adoption of agentic AI frameworks allows these systems to perform tasks with minimal human oversight, improving safety and reducing operational expenditures by over 25% in deepwater maintenance campaigns.

What challenges does the Digital Transformation In Oil And Gas Industry Industry face during its growth?

  • A significant challenge affecting industry growth is the difficulty of integrating advanced digital layers with legacy infrastructure, compounded by a substantial technical debt burden.

  • Significant challenges are restraining market adoption, led by legacy infrastructure integration and the associated technical debt. Many operators struggle with outdated industrial control systems (ICS) that are incompatible with modern analytics, creating a barrier to deploying a digital-first organizational culture. Firms often face a choice between costly system integration or creating security risks within their cyber-physical security framework.
  • The convergence of IT and OT in interconnected energy ecosystems intensifies these risks, with approximately 94% of top energy firms experiencing at least one major breach. Addressing this requires a move toward open-architecture platforms and a zero-trust security model, supported by continuous threat-hunting services.
  • However, the high cost of implementation and a systemic shortage of talent with expertise in hybrid cloud environments remain significant hurdles.

Exclusive Technavio Analysis on Customer Landscape

The digital transformation in oil and gas industry market forecasting report includes the adoption lifecycle of the market, covering from the innovator’s stage to the laggard’s stage. It focuses on adoption rates in different regions based on penetration. Furthermore, the digital transformation in oil and gas industry market report also includes key purchase criteria and drivers of price sensitivity to help companies evaluate and develop their market growth analysis strategies.

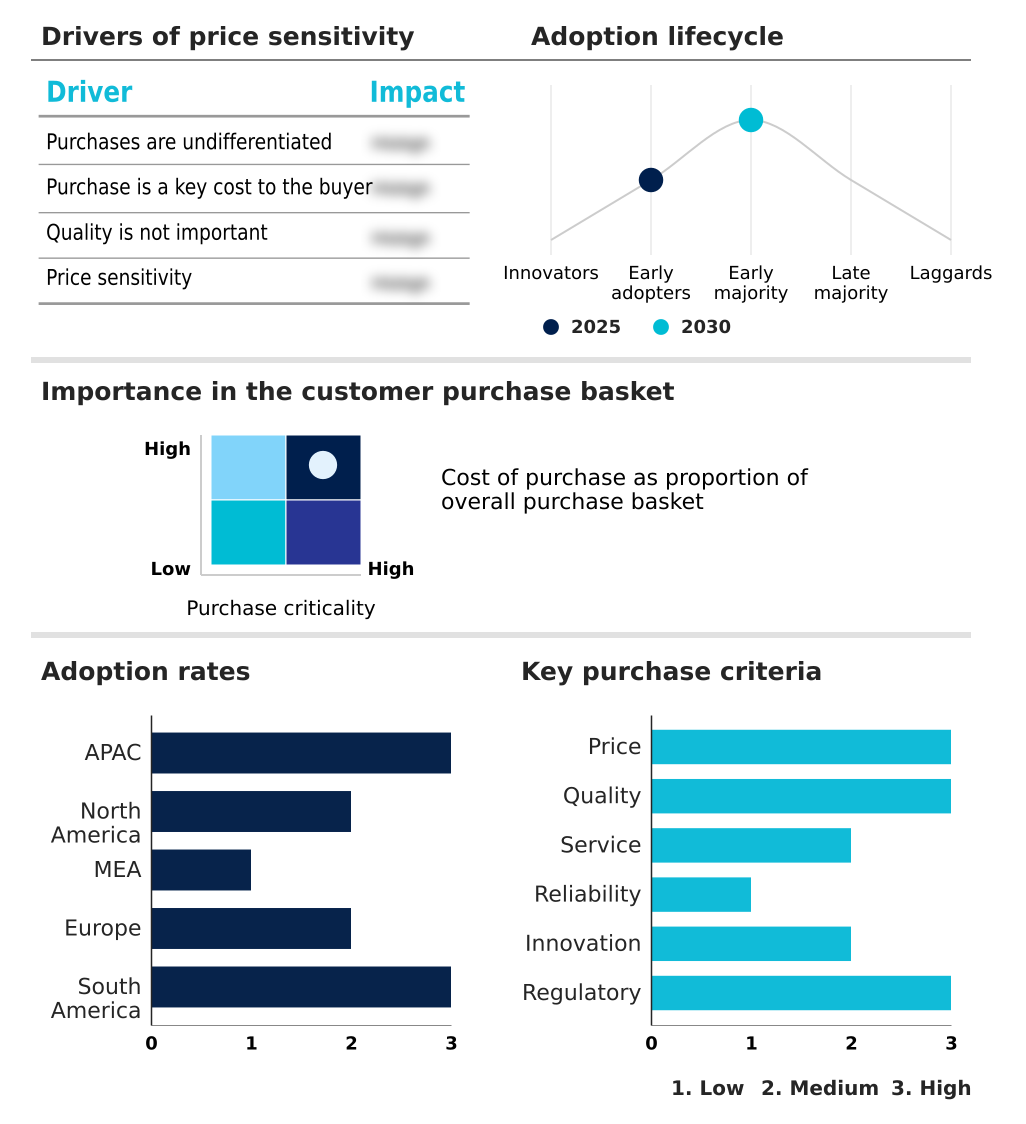
Customer Landscape of Digital Transformation In Oil And Gas Industry Industry

Competitive Landscape

Companies are implementing various strategies, such as strategic alliances, digital transformation in oil and gas industry market forecast, partnerships, mergers and acquisitions, geographical expansion, and product/service launches, to enhance their presence in the industry.

Accenture Plc - Key offerings center on AI-driven operational solutions and industrial analytics platforms, enabling enhanced asset performance management and autonomous decision intelligence across the energy value chain.

The industry research and growth report includes detailed analyses of the competitive landscape of the market and information about key companies, including:

  • Accenture Plc
  • Amazon.com Inc.
  • AVEVA Group Ltd.
  • Baker Hughes Co.
  • Emerson Electric Co.
  • General Electric Co.
  • Halliburton Co.
  • IBM Corp.
  • Informatica Inc.
  • Intel Corp.
  • Microsoft Corp.
  • NVIDIA Corp.
  • Oracle Corp.
  • Rockwell Automation Inc.
  • SAP SE
  • Schlumberger Ltd.
  • Siemens AG
  • Tata Consultancy Services
  • Teradata Corp.
  • TIBCO Software Inc.

Qualitative and quantitative analysis of companies has been conducted to help clients understand the wider business environment as well as the strengths and weaknesses of key industry players. Data is qualitatively analyzed to categorize companies as pure play, category-focused, industry-focused, and diversified; it is quantitatively analyzed to categorize companies as dominant, leading, strong, tentative, and weak.

Recent Development and News in Digital transformation in oil and gas industry market

  • In September 2024, NVIDIA Corp. announced the launch of a new generative AI platform specifically designed for reservoir engineering, enabling energy companies to create high-fidelity drilling models from unstructured geological data.
  • In November 2024, Siemens AG and Baker Hughes Co. entered a strategic partnership to deploy integrated digital twin solutions for comprehensive asset lifecycle management across major downstream refinery operations.
  • In January 2025, Microsoft Corp. completed its acquisition of a leading cybersecurity firm specializing in unified IT/OT security, aiming to strengthen its Azure platform's capabilities for protecting interconnected energy ecosystems.
  • In April 2025, SAP SE released an enhanced version of its sustainability software suite, featuring an automated ESG reporting framework that integrates real-time IoT sensor data for improved emissions tracking and compliance.

Dive into Technavio’s robust research methodology, blending expert interviews, extensive data synthesis, and validated models for unparalleled Digital Transformation In Oil And Gas Industry Market insights. See full methodology.

Market Scope
Page number 312
Base year 2025
Historic period 2020-2024
Forecast period 2026-2030
Growth momentum & CAGR Accelerate at a CAGR of 15.6%
Market growth 2026-2030 USD 69755.3 million
Market structure Fragmented
YoY growth 2025-2026(%) 13.5%
Key countries China, Japan, India, South Korea, Australia, Indonesia, US, Canada, Mexico, Saudi Arabia, UAE, South Africa, Israel, Turkey, Germany, UK, France, Italy, Spain, The Netherlands, Brazil, Argentina and Chile
Competitive landscape Leading Companies, Market Positioning of Companies, Competitive Strategies, and Industry Risks

Request Free Sample

Research Analyst Overview

  • The market is defined by the convergence of a data-driven operational framework with advanced digital technologies. Key components include agentic AI and autonomous decision intelligence, which enable predictive maintenance and asset lifecycle management through the use of digital twins and predictive simulation.
  • The industrial internet of things (IIoT) facilitates real-time data acquisition, which is crucial for automated ESG reporting and the functioning of smart refineries. This data is processed using high-performance computing and machine learning algorithms, often within cloud-native architectures that support data democratization.
  • Trends show a move toward generative AI for complex tasks like reservoir engineering and the use of computer vision and natural language processing for operational insights. The deployment of subsea robotics and autonomous underwater vehicles for robotic subsea inspection is becoming standard. However, challenges persist, including legacy infrastructure integration, technical debt, and human capital shortages.
  • Addressing these requires a unified IT/OT cybersecurity approach, implementing a zero-trust architecture to protect industrial control systems (ICS) and operational technology (OT) across interconnected energy ecosystems. Technologies like edge computing for local processing and blockchain for supply chain security are critical for building a resilient digital oilfield.

What are the Key Data Covered in this Digital Transformation In Oil And Gas Industry Market Research and Growth Report?

  • What is the expected growth of the Digital Transformation In Oil And Gas Industry Market between 2026 and 2030?

    • USD 69.76 billion, at a CAGR of 15.6%

  • What segmentation does the market report cover?

    • The report is segmented by Technology (IoT, Big data and analytics, Cloud computing, Artificial intelligence, and Others), Sector (Downstream, Upstream, and Midstream), Component (Software, Hardware, and Services) and Geography (APAC, North America, Middle East and Africa, Europe, South America)

  • Which regions are analyzed in the report?

    • APAC, North America, Middle East and Africa, Europe and South America

  • What are the key growth drivers and market challenges?

    • Institutionalization of agentic AI and autonomous decision intelligence, Legacy infrastructure integration and technical debt burden

  • Who are the major players in the Digital Transformation In Oil And Gas Industry Market?

    • Accenture Plc, Amazon.com Inc., AVEVA Group Ltd., Baker Hughes Co., Emerson Electric Co., General Electric Co., Halliburton Co., IBM Corp., Informatica Inc., Intel Corp., Microsoft Corp., NVIDIA Corp., Oracle Corp., Rockwell Automation Inc., SAP SE, Schlumberger Ltd., Siemens AG, Tata Consultancy Services, Teradata Corp. and TIBCO Software Inc.

Market Research Insights

  • The market's dynamics are shaped by a strategic shift towards autonomous and data-centric operations, where organizations are leveraging hybrid cloud environments and managed cybersecurity services. This transition is critical, as evidenced by the fact that approximately 94% of top energy firms have reported at least one significant data breach, highlighting the need for robust cyber-physical security.
  • The adoption of self-correcting systems and software-led orchestration has been shown to reduce unplanned downtime by as much as 40%. The focus is on implementing a digital-first organizational culture supported by system integration and advanced process control to create a resilient and efficient operational framework.
  • This evolution is essential for navigating the complexities of modern energy production while maximizing return on digital investments.

We can help! Our analysts can customize this digital transformation in oil and gas industry market research report to meet your requirements.

Get in touch

1. Executive Summary

1.1 Market overview

Executive Summary - Chart on Market Overview
Executive Summary - Data Table on Market Overview
Executive Summary - Chart on Global Market Characteristics
Executive Summary - Chart on Market by Geography
Executive Summary - Chart on Market Segmentation by Technology
Executive Summary - Chart on Market Segmentation by Sector
Executive Summary - Chart on Market Segmentation by Component
Executive Summary - Chart on Incremental Growth
Executive Summary - Data Table on Incremental Growth
Executive Summary - Chart on Company Market Positioning

2. Technavio Analysis

2.1 Analysis of price sensitivity, lifecycle, customer purchase basket, adoption rates, and purchase criteria

2.2 Criticality of inputs and Factors of differentiation

Chart on Overview on criticality of inputs and factors of differentiation

2.3 Factors of disruption

Chart on Overview on factors of disruption

2.4 Impact of drivers and challenges

Chart on Impact of drivers and challenges in 2025 and 2030

3. Market Landscape

3.1 Market ecosystem

Chart on Parent Market
Data Table on - Parent Market

3.2 Market characteristics

Chart on Market characteristics analysis

3.3 Value chain analysis

Chart on Value chain analysis

4. Market Sizing

4.1 Market definition

Data Table on Offerings of companies included in the market definition

4.2 Market segment analysis

Market segments

4.3 Market size 2025

4.4 Market outlook: Forecast for 2025-2030

Chart on Global - Market size and forecast 2025-2030 ($ million)
Data Table on Global - Market size and forecast 2025-2030 ($ million)
Chart on Global Market: Year-over-year growth 2025-2030 (%)
Data Table on Global Market: Year-over-year growth 2025-2030 (%)

5. Historic Market Size

5.1 Global Digital Transformation Market In Oil And Gas Industry 2020 - 2024

Historic Market Size - Data Table on Global Digital Transformation Market In Oil And Gas Industry 2020 - 2024 ($ million)

5.2 Technology segment analysis 2020 - 2024

Historic Market Size - Technology Segment 2020 - 2024 ($ million)

5.3 Sector segment analysis 2020 - 2024

Historic Market Size - Sector Segment 2020 - 2024 ($ million)

5.4 Component segment analysis 2020 - 2024

Historic Market Size - Component Segment 2020 - 2024 ($ million)

5.5 Geography segment analysis 2020 - 2024

Historic Market Size - Geography Segment 2020 - 2024 ($ million)

5.6 Country segment analysis 2020 - 2024

Historic Market Size - Country Segment 2020 - 2024 ($ million)

6. Qualitative Analysis

6.1 Impact of AI in global digital transformation market in oil and gas industry

6.2 Impact of geopolitical conflict on global digital transformation market in oil and gas industry

7. Five Forces Analysis

7.1 Five forces summary

Five forces analysis - Comparison between 2025 and 2030

7.2 Bargaining power of buyers

Bargaining power of buyers - Impact of key factors 2025 and 2030

7.3 Bargaining power of suppliers

Bargaining power of suppliers - Impact of key factors in 2025 and 2030

7.4 Threat of new entrants

Threat of new entrants - Impact of key factors in 2025 and 2030

7.5 Threat of substitutes

Threat of substitutes - Impact of key factors in 2025 and 2030

7.6 Threat of rivalry

Threat of rivalry - Impact of key factors in 2025 and 2030

7.7 Market condition

Chart on Market condition - Five forces 2025 and 2030

8. Market Segmentation by Technology

8.1 Market segments

Chart on Technology - Market share 2025-2030 (%)
Data Table on Technology - Market share 2025-2030 (%)

8.2 Comparison by Technology

Chart on Comparison by Technology
Data Table on Comparison by Technology

8.3 IoT - Market size and forecast 2025-2030

Chart on IoT - Market size and forecast 2025-2030 ($ million)
Data Table on IoT - Market size and forecast 2025-2030 ($ million)
Chart on IoT - Year-over-year growth 2025-2030 (%)
Data Table on IoT - Year-over-year growth 2025-2030 (%)

8.4 Big data and analytics - Market size and forecast 2025-2030

Chart on Big data and analytics - Market size and forecast 2025-2030 ($ million)
Data Table on Big data and analytics - Market size and forecast 2025-2030 ($ million)
Chart on Big data and analytics - Year-over-year growth 2025-2030 (%)
Data Table on Big data and analytics - Year-over-year growth 2025-2030 (%)

8.5 Cloud computing - Market size and forecast 2025-2030

Chart on Cloud computing - Market size and forecast 2025-2030 ($ million)
Data Table on Cloud computing - Market size and forecast 2025-2030 ($ million)
Chart on Cloud computing - Year-over-year growth 2025-2030 (%)
Data Table on Cloud computing - Year-over-year growth 2025-2030 (%)

8.6 Artificial intelligence - Market size and forecast 2025-2030

Chart on Artificial intelligence - Market size and forecast 2025-2030 ($ million)
Data Table on Artificial intelligence - Market size and forecast 2025-2030 ($ million)
Chart on Artificial intelligence - Year-over-year growth 2025-2030 (%)
Data Table on Artificial intelligence - Year-over-year growth 2025-2030 (%)

8.7 Others - Market size and forecast 2025-2030

Chart on Others - Market size and forecast 2025-2030 ($ million)
Data Table on Others - Market size and forecast 2025-2030 ($ million)
Chart on Others - Year-over-year growth 2025-2030 (%)
Data Table on Others - Year-over-year growth 2025-2030 (%)

8.8 Market opportunity by Technology

Market opportunity by Technology ($ million)
Data Table on Market opportunity by Technology ($ million)

9. Market Segmentation by Sector

9.1 Market segments

Chart on Sector - Market share 2025-2030 (%)
Data Table on Sector - Market share 2025-2030 (%)

9.2 Comparison by Sector

Chart on Comparison by Sector
Data Table on Comparison by Sector

9.3 Downstream - Market size and forecast 2025-2030

Chart on Downstream - Market size and forecast 2025-2030 ($ million)
Data Table on Downstream - Market size and forecast 2025-2030 ($ million)
Chart on Downstream - Year-over-year growth 2025-2030 (%)
Data Table on Downstream - Year-over-year growth 2025-2030 (%)

9.4 Upstream - Market size and forecast 2025-2030

Chart on Upstream - Market size and forecast 2025-2030 ($ million)
Data Table on Upstream - Market size and forecast 2025-2030 ($ million)
Chart on Upstream - Year-over-year growth 2025-2030 (%)
Data Table on Upstream - Year-over-year growth 2025-2030 (%)

9.5 Midstream - Market size and forecast 2025-2030

Chart on Midstream - Market size and forecast 2025-2030 ($ million)
Data Table on Midstream - Market size and forecast 2025-2030 ($ million)
Chart on Midstream - Year-over-year growth 2025-2030 (%)
Data Table on Midstream - Year-over-year growth 2025-2030 (%)

9.6 Market opportunity by Sector

Market opportunity by Sector ($ million)
Data Table on Market opportunity by Sector ($ million)

10. Market Segmentation by Component

10.1 Market segments

Chart on Component - Market share 2025-2030 (%)
Data Table on Component - Market share 2025-2030 (%)

10.2 Comparison by Component

Chart on Comparison by Component
Data Table on Comparison by Component

10.3 Software - Market size and forecast 2025-2030

Chart on Software - Market size and forecast 2025-2030 ($ million)
Data Table on Software - Market size and forecast 2025-2030 ($ million)
Chart on Software - Year-over-year growth 2025-2030 (%)
Data Table on Software - Year-over-year growth 2025-2030 (%)

10.4 Hardware - Market size and forecast 2025-2030

Chart on Hardware - Market size and forecast 2025-2030 ($ million)
Data Table on Hardware - Market size and forecast 2025-2030 ($ million)
Chart on Hardware - Year-over-year growth 2025-2030 (%)
Data Table on Hardware - Year-over-year growth 2025-2030 (%)

10.5 Services - Market size and forecast 2025-2030

Chart on Services - Market size and forecast 2025-2030 ($ million)
Data Table on Services - Market size and forecast 2025-2030 ($ million)
Chart on Services - Year-over-year growth 2025-2030 (%)
Data Table on Services - Year-over-year growth 2025-2030 (%)

10.6 Market opportunity by Component

Market opportunity by Component ($ million)
Data Table on Market opportunity by Component ($ million)

11. Customer Landscape

11.1 Customer landscape overview

Analysis of price sensitivity, lifecycle, customer purchase basket, adoption rates, and purchase criteria

12. Geographic Landscape

12.1 Geographic segmentation

Chart on Market share by geography 2025-2030 (%)
Data Table on Market share by geography 2025-2030 (%)

12.2 Geographic comparison

Chart on Geographic comparison
Data Table on Geographic comparison

12.3 APAC - Market size and forecast 2025-2030

Chart on APAC - Market size and forecast 2025-2030 ($ million)
Data Table on APAC - Market size and forecast 2025-2030 ($ million)
Chart on APAC - Year-over-year growth 2025-2030 (%)
Data Table on APAC - Year-over-year growth 2025-2030 (%)
Chart on Regional Comparison - APAC
Data Table on Regional Comparison - APAC

12.3.1 China - Market size and forecast 2025-2030

Chart on China - Market size and forecast 2025-2030 ($ million)
Data Table on China - Market size and forecast 2025-2030 ($ million)
Chart on China - Year-over-year growth 2025-2030 (%)
Data Table on China - Year-over-year growth 2025-2030 (%)

12.3.2 Japan - Market size and forecast 2025-2030

Chart on Japan - Market size and forecast 2025-2030 ($ million)
Data Table on Japan - Market size and forecast 2025-2030 ($ million)
Chart on Japan - Year-over-year growth 2025-2030 (%)
Data Table on Japan - Year-over-year growth 2025-2030 (%)

12.3.3 India - Market size and forecast 2025-2030

Chart on India - Market size and forecast 2025-2030 ($ million)
Data Table on India - Market size and forecast 2025-2030 ($ million)
Chart on India - Year-over-year growth 2025-2030 (%)
Data Table on India - Year-over-year growth 2025-2030 (%)

12.3.4 South Korea - Market size and forecast 2025-2030

Chart on South Korea - Market size and forecast 2025-2030 ($ million)
Data Table on South Korea - Market size and forecast 2025-2030 ($ million)
Chart on South Korea - Year-over-year growth 2025-2030 (%)
Data Table on South Korea - Year-over-year growth 2025-2030 (%)

12.3.5 Australia - Market size and forecast 2025-2030

Chart on Australia - Market size and forecast 2025-2030 ($ million)
Data Table on Australia - Market size and forecast 2025-2030 ($ million)
Chart on Australia - Year-over-year growth 2025-2030 (%)
Data Table on Australia - Year-over-year growth 2025-2030 (%)

12.3.6 Indonesia - Market size and forecast 2025-2030

Chart on Indonesia - Market size and forecast 2025-2030 ($ million)
Data Table on Indonesia - Market size and forecast 2025-2030 ($ million)
Chart on Indonesia - Year-over-year growth 2025-2030 (%)
Data Table on Indonesia - Year-over-year growth 2025-2030 (%)

12.4 North America - Market size and forecast 2025-2030

Chart on North America - Market size and forecast 2025-2030 ($ million)
Data Table on North America - Market size and forecast 2025-2030 ($ million)
Chart on North America - Year-over-year growth 2025-2030 (%)
Data Table on North America - Year-over-year growth 2025-2030 (%)
Chart on Regional Comparison - North America
Data Table on Regional Comparison - North America

12.4.1 US - Market size and forecast 2025-2030

Chart on US - Market size and forecast 2025-2030 ($ million)
Data Table on US - Market size and forecast 2025-2030 ($ million)
Chart on US - Year-over-year growth 2025-2030 (%)
Data Table on US - Year-over-year growth 2025-2030 (%)

12.4.2 Canada - Market size and forecast 2025-2030

Chart on Canada - Market size and forecast 2025-2030 ($ million)
Data Table on Canada - Market size and forecast 2025-2030 ($ million)
Chart on Canada - Year-over-year growth 2025-2030 (%)
Data Table on Canada - Year-over-year growth 2025-2030 (%)

12.4.3 Mexico - Market size and forecast 2025-2030

Chart on Mexico - Market size and forecast 2025-2030 ($ million)
Data Table on Mexico - Market size and forecast 2025-2030 ($ million)
Chart on Mexico - Year-over-year growth 2025-2030 (%)
Data Table on Mexico - Year-over-year growth 2025-2030 (%)

12.5 Middle East and Africa - Market size and forecast 2025-2030

Chart on Middle East and Africa - Market size and forecast 2025-2030 ($ million)
Data Table on Middle East and Africa - Market size and forecast 2025-2030 ($ million)
Chart on Middle East and Africa - Year-over-year growth 2025-2030 (%)
Data Table on Middle East and Africa - Year-over-year growth 2025-2030 (%)
Chart on Regional Comparison - Middle East and Africa
Data Table on Regional Comparison - Middle East and Africa

12.5.1 Saudi Arabia - Market size and forecast 2025-2030

Chart on Saudi Arabia - Market size and forecast 2025-2030 ($ million)
Data Table on Saudi Arabia - Market size and forecast 2025-2030 ($ million)
Chart on Saudi Arabia - Year-over-year growth 2025-2030 (%)
Data Table on Saudi Arabia - Year-over-year growth 2025-2030 (%)

12.5.2 UAE - Market size and forecast 2025-2030

Chart on UAE - Market size and forecast 2025-2030 ($ million)
Data Table on UAE - Market size and forecast 2025-2030 ($ million)
Chart on UAE - Year-over-year growth 2025-2030 (%)
Data Table on UAE - Year-over-year growth 2025-2030 (%)

12.5.3 South Africa - Market size and forecast 2025-2030

Chart on South Africa - Market size and forecast 2025-2030 ($ million)
Data Table on South Africa - Market size and forecast 2025-2030 ($ million)
Chart on South Africa - Year-over-year growth 2025-2030 (%)
Data Table on South Africa - Year-over-year growth 2025-2030 (%)

12.5.4 Israel - Market size and forecast 2025-2030

Chart on Israel - Market size and forecast 2025-2030 ($ million)
Data Table on Israel - Market size and forecast 2025-2030 ($ million)
Chart on Israel - Year-over-year growth 2025-2030 (%)
Data Table on Israel - Year-over-year growth 2025-2030 (%)

12.5.5 Turkey - Market size and forecast 2025-2030

Chart on Turkey - Market size and forecast 2025-2030 ($ million)
Data Table on Turkey - Market size and forecast 2025-2030 ($ million)
Chart on Turkey - Year-over-year growth 2025-2030 (%)
Data Table on Turkey - Year-over-year growth 2025-2030 (%)

12.6 Europe - Market size and forecast 2025-2030

Chart on Europe - Market size and forecast 2025-2030 ($ million)
Data Table on Europe - Market size and forecast 2025-2030 ($ million)
Chart on Europe - Year-over-year growth 2025-2030 (%)
Data Table on Europe - Year-over-year growth 2025-2030 (%)
Chart on Regional Comparison - Europe
Data Table on Regional Comparison - Europe

12.6.1 Germany - Market size and forecast 2025-2030

Chart on Germany - Market size and forecast 2025-2030 ($ million)
Data Table on Germany - Market size and forecast 2025-2030 ($ million)
Chart on Germany - Year-over-year growth 2025-2030 (%)
Data Table on Germany - Year-over-year growth 2025-2030 (%)

12.6.2 UK - Market size and forecast 2025-2030

Chart on UK - Market size and forecast 2025-2030 ($ million)
Data Table on UK - Market size and forecast 2025-2030 ($ million)
Chart on UK - Year-over-year growth 2025-2030 (%)
Data Table on UK - Year-over-year growth 2025-2030 (%)

12.6.3 France - Market size and forecast 2025-2030

Chart on France - Market size and forecast 2025-2030 ($ million)
Data Table on France - Market size and forecast 2025-2030 ($ million)
Chart on France - Year-over-year growth 2025-2030 (%)
Data Table on France - Year-over-year growth 2025-2030 (%)

12.6.4 Italy - Market size and forecast 2025-2030

Chart on Italy - Market size and forecast 2025-2030 ($ million)
Data Table on Italy - Market size and forecast 2025-2030 ($ million)
Chart on Italy - Year-over-year growth 2025-2030 (%)
Data Table on Italy - Year-over-year growth 2025-2030 (%)

12.6.5 Spain - Market size and forecast 2025-2030

Chart on Spain - Market size and forecast 2025-2030 ($ million)
Data Table on Spain - Market size and forecast 2025-2030 ($ million)
Chart on Spain - Year-over-year growth 2025-2030 (%)
Data Table on Spain - Year-over-year growth 2025-2030 (%)

12.6.6 The Netherlands - Market size and forecast 2025-2030

Chart on The Netherlands - Market size and forecast 2025-2030 ($ million)
Data Table on The Netherlands - Market size and forecast 2025-2030 ($ million)
Chart on The Netherlands - Year-over-year growth 2025-2030 (%)
Data Table on The Netherlands - Year-over-year growth 2025-2030 (%)

12.7 South America - Market size and forecast 2025-2030

Chart on South America - Market size and forecast 2025-2030 ($ million)
Data Table on South America - Market size and forecast 2025-2030 ($ million)
Chart on South America - Year-over-year growth 2025-2030 (%)
Data Table on South America - Year-over-year growth 2025-2030 (%)
Chart on Regional Comparison - South America
Data Table on Regional Comparison - South America

12.7.1 Brazil - Market size and forecast 2025-2030

Chart on Brazil - Market size and forecast 2025-2030 ($ million)
Data Table on Brazil - Market size and forecast 2025-2030 ($ million)
Chart on Brazil - Year-over-year growth 2025-2030 (%)
Data Table on Brazil - Year-over-year growth 2025-2030 (%)

12.7.2 Argentina - Market size and forecast 2025-2030

Chart on Argentina - Market size and forecast 2025-2030 ($ million)
Data Table on Argentina - Market size and forecast 2025-2030 ($ million)
Chart on Argentina - Year-over-year growth 2025-2030 (%)
Data Table on Argentina - Year-over-year growth 2025-2030 (%)

12.7.3 Chile - Market size and forecast 2025-2030

Chart on Chile - Market size and forecast 2025-2030 ($ million)
Data Table on Chile - Market size and forecast 2025-2030 ($ million)
Chart on Chile - Year-over-year growth 2025-2030 (%)
Data Table on Chile - Year-over-year growth 2025-2030 (%)

12.8 Market opportunity by geography

Market opportunity by geography ($ million)
Data Tables on Market opportunity by geography ($ million)

13. Drivers, Challenges, and Opportunity

13.1 Market drivers

Institutionalization of agentic AI and autonomous decision intelligence
Growth of digital twins and asset lifecycle management
Escalation of regulatory compliance and automated ESG reporting frameworks

13.2 Market challenges

Legacy infrastructure integration and technical debt burden
Intensification of cybersecurity risks in interconnected energy ecosystems
Systemic human capital shortages and organizational resistance

13.3 Impact of drivers and challenges

Impact of drivers and challenges in 2025 and 2030

13.4 Market opportunities

Industrialization of generative AI for reservoir engineering
Advancements in autonomous robotic subsea inspection systems
Transition toward unified IT and OT cybersecurity frameworks

14. Competitive Landscape

14.1 Overview

14.2

Overview on criticality of inputs and factors of differentiation

14.3 Landscape disruption

Overview on factors of disruption

14.4 Industry risks

Impact of key risks on business

15. Competitive Analysis

15.1 Companies profiled

Companies covered

15.2 Company ranking index

15.3 Market positioning of companies

Matrix on companies position and classification

15.4 Accenture Plc

Accenture Plc - Overview
Accenture Plc - Business segments
Accenture Plc - Key news
Accenture Plc - Key offerings
Accenture Plc - Segment focus
SWOT

15.5 Amazon.com Inc.

Amazon.com Inc. - Overview
Amazon.com Inc. - Business segments
Amazon.com Inc. - Key news
Amazon.com Inc. - Key offerings
Amazon.com Inc. - Segment focus
SWOT

15.6 Emerson Electric Co.

Emerson Electric Co. - Overview
Emerson Electric Co. - Business segments
Emerson Electric Co. - Key news
Emerson Electric Co. - Key offerings
Emerson Electric Co. - Segment focus
SWOT

15.7 General Electric Co.

General Electric Co. - Overview
General Electric Co. - Business segments
General Electric Co. - Key offerings
General Electric Co. - Segment focus
SWOT

15.8 Halliburton Co.

Halliburton Co. - Overview
Halliburton Co. - Business segments
Halliburton Co. - Key news
Halliburton Co. - Key offerings
Halliburton Co. - Segment focus
SWOT

15.9 IBM Corp.

IBM Corp. - Overview
IBM Corp. - Business segments
IBM Corp. - Key news
IBM Corp. - Key offerings
IBM Corp. - Segment focus
SWOT

15.10 Informatica Inc.

Informatica Inc. - Overview
Informatica Inc. - Business segments
Informatica Inc. - Key offerings
Informatica Inc. - Segment focus
SWOT

15.11 Intel Corp.

Intel Corp. - Overview
Intel Corp. - Business segments
Intel Corp. - Key news
Intel Corp. - Key offerings
Intel Corp. - Segment focus
SWOT

15.12 Microsoft Corp.

Microsoft Corp. - Overview
Microsoft Corp. - Business segments
Microsoft Corp. - Key news
Microsoft Corp. - Key offerings
Microsoft Corp. - Segment focus
SWOT

15.13 NVIDIA Corp.

NVIDIA Corp. - Overview
NVIDIA Corp. - Business segments
NVIDIA Corp. - Key news
NVIDIA Corp. - Key offerings
NVIDIA Corp. - Segment focus
SWOT

15.14 Oracle Corp.

Oracle Corp. - Overview
Oracle Corp. - Business segments
Oracle Corp. - Key news
Oracle Corp. - Key offerings
Oracle Corp. - Segment focus
SWOT

15.15 Rockwell Automation Inc.

Rockwell Automation Inc. - Overview
Rockwell Automation Inc. - Business segments
Rockwell Automation Inc. - Key news
Rockwell Automation Inc. - Key offerings
Rockwell Automation Inc. - Segment focus
SWOT

15.16 SAP SE

SAP SE - Overview
SAP SE - Business segments
SAP SE - Key news
SAP SE - Key offerings
SAP SE - Segment focus
SWOT

15.17 Siemens AG

Siemens AG - Overview
Siemens AG - Business segments
Siemens AG - Key news
Siemens AG - Key offerings
Siemens AG - Segment focus
SWOT

15.18 Teradata Corp.

Teradata Corp. - Overview
Teradata Corp. - Business segments
Teradata Corp. - Key news
Teradata Corp. - Key offerings
Teradata Corp. - Segment focus
SWOT

16. Appendix

16.1 Scope of the report

Market definition
Objectives
Notes and caveats

16.2 Inclusions and exclusions checklist

Inclusions checklist
Exclusions checklist

16.3 Currency conversion rates for US$

16.4 Research methodology

16.5 Data procurement

Information sources

16.6 Data validation

16.7 Validation techniques employed for market sizing

16.8 Data synthesis

16.9 360 degree market analysis

16.10 List of abbreviations

Research Methodology

Technavio presents a detailed picture of the market by way of study, synthesis, and summation of data from multiple sources. The analysts have presented the various facets of the market with a particular focus on identifying the key industry influencers. The data thus presented is comprehensive, reliable, and the result of extensive research, both primary and secondary.

INFORMATION SOURCES

Primary sources

  • Manufacturers and suppliers
  • Channel partners
  • Industry experts
  • Strategic decision makers

Secondary sources

  • Industry journals and periodicals
  • Government data
  • Financial reports of key industry players
  • Historical data
  • Press releases

DATA ANALYSIS

Data Synthesis

  • Collation of data
  • Estimation of key figures
  • Analysis of derived insights

Data Validation

  • Triangulation with data models
  • Reference against proprietary databases
  • Corroboration with industry experts

REPORT WRITING

Qualitative

  • Market drivers
  • Market challenges
  • Market trends
  • Five forces analysis

Quantitative

  • Market size and forecast
  • Market segmentation
  • Geographical insights
  • Competitive landscape

Interested in this report?

Get your sample now to see our research methodology and insights!

Download Now

Frequently Asked Questions

Digital Transformation In Oil And Gas Industry market growth will increase by USD 69755.3 million during 2026-2030.

The Digital Transformation In Oil And Gas Industry market is expected to grow at a CAGR of 15.6% during 2026-2030.

Digital Transformation In Oil And Gas Industry market is segmented by Technology (IoT, Big data and analytics, Cloud computing, Artificial intelligence, Others) Sector (Downstream, Upstream, Midstream) Component (Software, Hardware, Services)

Accenture Plc, Amazon.com Inc., AVEVA Group Ltd., Baker Hughes Co., Emerson Electric Co., General Electric Co., Halliburton Co., IBM Corp., Informatica Inc., Intel Corp., Microsoft Corp., NVIDIA Corp., Oracle Corp., Rockwell Automation Inc., SAP SE, Schlumberger Ltd., Siemens AG, Tata Consultancy Services, Teradata Corp., TIBCO Software Inc. are a few of the key vendors in the Digital Transformation In Oil And Gas Industry market.

APAC will register the highest growth rate of 36.3% among the other regions. Therefore, the Digital Transformation In Oil And Gas Industry market in APAC is expected to garner significant business opportunities for the vendors during the forecast period.

China, Japan, India, South Korea, Australia, Indonesia, US, Canada, Mexico, Saudi Arabia, UAE, South Africa, Israel, Turkey, Germany, UK, France, Italy, Spain, The Netherlands, Brazil, Argentina, Chile

  • Institutionalization of agentic AI and autonomous decision intelligence is the driving factor this market.

The Digital Transformation In Oil And Gas Industry market vendors should focus on grabbing business opportunities from the Technology segment as it accounted for the largest market share in the base year.
RIA - Research AI Assistant
Ask RIA