Dimethylolpropionic Acid Market Size 2024-2028
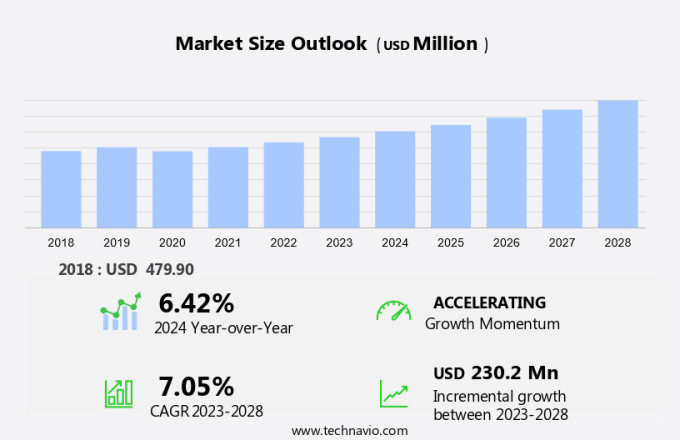
The dimethylolpropionic acid market size is estimated to grow by USD 230.2 million at a CAGR of 7.05% between 2023 and 2028. Polyurethane dispersions, a type of polyurethane resin, are gaining significant traction in various industries due to their unique properties, including excellent bonding and coating capabilities. The increasing demand for these dispersions is driven by stringent regulations on volatile organic compound (VOC) emissions, which favor the use of water-based dispersions over traditional solvent-borne systems. Moreover, the e-commerce sector's growth is contributing to the market's expansion, as customers can easily purchase essential raw materials, such as dimethylolpropionic acid, required for producing polyurethane dispersions online. Overall, the polyurethane dispersions market is poised for growth, fueled by regulatory requirements and the convenience of e-commerce.
What will be the Size of the Market During the Forecast Period?
For More Highlights About this Report, Request Free Sample
Market Dynamic and Customer Landscape
Dimethylolpropionic Acid (DMPA) is a versatile organic compound used primarily as a cross-linking agent in various industries. It is widely used in the production of textile exchange, such as polyurethane dispersions (PUDs), adhesives & sealants, alkyd resins, architectural coatings, automotive & industrial coatings, and polyester resins. DMPA is also used in water-soluble resins, aqueous urethane dispersions, and gloss waterborne coatings. The flexibility and toughness of DMPA make it an ideal choice for powder coatings, epoxy polyester, and electrodeposition coatings. Its excellent flow property and impact resistance contribute to its use in multi-substrate coatings and electrical appliances. Additionally, DMPA is used as a binder in glass fiber sizing and resin coatings.
The global Dimethylolpropionic Acid market is expected to grow significantly due to its wide range of applications in various industries. The increasing demand for waterborne coatings and the shift towards sustainable coatings are expected to drive market growth. The market is segmented into various applications, including textile exchange, adhesives & sealants, architectural coatings, automotive & industrial coatings, and others. Linseed oil glyceride is a common raw material used in the production of DMPA. The availability and cost of linseed oil glyceride are expected to impact the market dynamics. The market is competitive, with major players including BASF SE, Dow Inc., and Eastman Chemical Company. Our researchers analyzed the data with 2023 as the base year, along with the key drivers, trends, and challenges. A holistic analysis of drivers will help companies refine their marketing strategies to gain a competitive advantage.
Key Market Driver
The stringent regulations on VOC emissions is notably driving the market growth. Dimethylolpropionic Acid (DMPA) is a versatile chemical compound widely used in various industries, including Textile Exchange, Adhesives & Sealants, and Paints & Coatings. In the textile industry, DMPA is employed as a cross-linking agent for alkyd resins and polyester resins, enhancing the functionality of textiles and leather. In the manufacturing of Polyurethane Dispersion, DMPA acts as a chain extender, contributing to the flexibility and toughness of the final product. In the realm of Adhesives & Sealants, DMPA is used to produce water-soluble resins, which are essential in the production of aqueous urethane dispersions and gloss waterborne coatings. These coatings exhibit superior properties, such as impact resistance, adhesion to glass, steel, plastic, fiberglass, and electro-deposition coatings in the metal industry. Moreover, DMPA is a crucial raw material in the production of Trimethylolethane and Trimethylolpropane, which are key ingredients in the manufacturing of urethane elastomers.
These elastomers are extensively used in the automotive, furniture, and upholstery industries for their excellent flexibility, toughness, and resistance to wear and tear. In the Building & Construction sector, DMPA is used in the production of epoxy polyester resins, which are essential in the manufacturing of powder coatings. These coatings offer superior gloss, flow property, and resistance to environmental factors, making them suitable for use in appliances, HVAC systems, and architectural coatings. The production of DMPA involves the reaction of formaldehyde and propionaldehyde. Despite its widespread use, the market for DMPA is subject to various factors, including raw material prices, production capacity, and regulatory compliance. Thus, such factors are driving the growth of the market during the forecast period.
Significant Market Trends
The increasing demand for water-based paints and coatings is the key trend in the market. Dimethylolpropionic Acid (DMPA) is a versatile organic compound widely used in various industries, including Textile Exchange, Adhesives & Sealants, and Paints & Coatings. In the Textile & Leather sector, DMPA acts as a cross-linking agent for Polyurethane Dispersion, enhancing the functionality of textiles and leather. In the Industrial sector, DMPA is employed as a raw material in the production of Alkyd Resins, Polyester Resins, and Water-soluble resins, such as Aqueous Urethane Dispersions and Gloss waterborne coatings. These resins offer desirable properties like flexibility, toughness, and impact resistance, making them suitable for Building & Construction applications.
In the field of Adhesives & Sealants, DMPA contributes to the production of Epoxy polyester systems, which provide excellent adhesion to Glass, Steel, Plastic, Fiberglass, and other substrates. Furthermore, DMPA is used in the manufacturing of Urethane elastomers, which exhibit superior properties like flexibility, toughness, and impact resistance, making them ideal for Furniture & Upholstery, Electro-deposition coatings, and Metal industry applications. Trimethylolethane and Trimethylolpropane are related compounds used in the production of DMPA. DMPA's functional properties are crucial in various industries, including the Metal industry, where it is used in Powder coatings, and the Appliances and HVAC system sectors, where it enhances the flow property and gloss of coatings. The raw materials required for DMPA production include Formaldehyde and Propionaldehyde. Thus, such trends will shape the growth of the market during the forecast period.
Major Market Challenge
The availability of substitutes for dimethylolpropionic acid is the major challenge that affects the growth of the market. Dimethylolpropionic Acid (DMPA) is a versatile chemical compound used in various industries, including Textile Exchange, Adhesives & Sealants, and Paints & Coatings. In the textile industry, DMPA is utilized as a cross-linking agent for alkyd resins and polyester resins, enhancing the functionality of textiles and leather. In the realm of industrial applications, DMPA plays a crucial role in the production of Polyurethane Dispersion, Trimethylolethane, and Trimethylolpropane. In the field of Adhesives & Sealants, DMPA contributes to the formulation of water-soluble resins and aqueous urethane dispersions, which are essential components in the manufacturing of epoxy polyester, powder coatings, and electro-deposition coatings.
These coatings exhibit desirable properties such as flexibility, toughness, impact resistance, and adhesion to glass, steel, plastic, fiberglass, and other materials. In the Building & Construction sector, DMPA is employed in the production of gloss waterborne coatings for architectural applications. These coatings offer superior flow properties, gloss, and functionality. Furthermore, DMPA is utilized in the manufacturing of urethane elastomers for furniture & upholstery, appliances, HVAC systems, and the metal industry. Raw materials for DMPA production include formaldehyde and propionaldehyde. The global market for DMPA is expected to grow due to its wide range of applications and the increasing demand for high-performance coatings and adhesives. Hence, the above factors will impede the growth of the market during the forecast period.
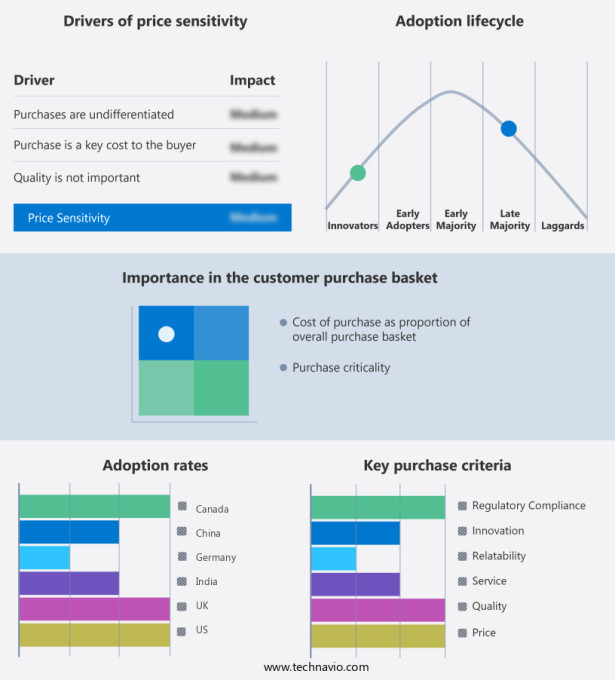
Exclusive Customer Landscape
The market forecasting report includes the adoption lifecycle of the market, covering from the innovator’s stage to the laggard’s stage. It focuses on adoption rates in different regions based on penetration. Furthermore, the report also includes key purchase criteria and drivers of price sensitivity to help companies evaluate and develop their market growth analysis strategies.
Customer Landscape
Key Companies & Market Insights
Companies are implementing various strategies, such as strategic alliances, partnerships, mergers and acquisitions, geographical expansion, and product/service launches, to enhance their presence in the market.
Actylis - The company offers 3610300 dimethylolpropionic acid for coating.
The market research and growth report also includes detailed analyses of the competitive landscape of the market and information about key companies, including:
- Actylis
- Anhui Sinograce Chemical Co. Ltd.
- Biosynth Ltd.
- Connect Chemicals GmbH
- Fengchen Group Co. Ltd.
- Glister Industrial Development Co. Ltd.
- Huzhou Changsheng Chemical Co. Ltd
- Jiangxi Keding Chemical Material Co. Ltd.
- Jiangxi Nancheng Hongdu Chemical Technology Development Co.Ltd.
- Jiangxi Selon Industrial Co. Ltd.
- Merck KGaA
- NutriScience Innovations LLC
- Perstorp Holding AB
- Pinpools GmbH.
- Shandong Pulisi Chemical Co. Ltd.
- Shanghai Wibson Biotechnology Co. Ltd
- Vesino Industrial Co. Ltd.
- Yigyooly Enterprise Ltd.
- Zhang Jia Gang Yarui Chemical Co. Ltd.
Qualitative and quantitative analysis of companies has been conducted to help clients understand the wider business environment as well as the strengths and weaknesses of key market players. Data is qualitatively analyzed to categorize companies as pure play, category-focused, industry-focused, and diversified; it is quantitatively analyzed to categorize companies as dominant, leading, strong, tentative, and weak.
Market Segmentation
By Application
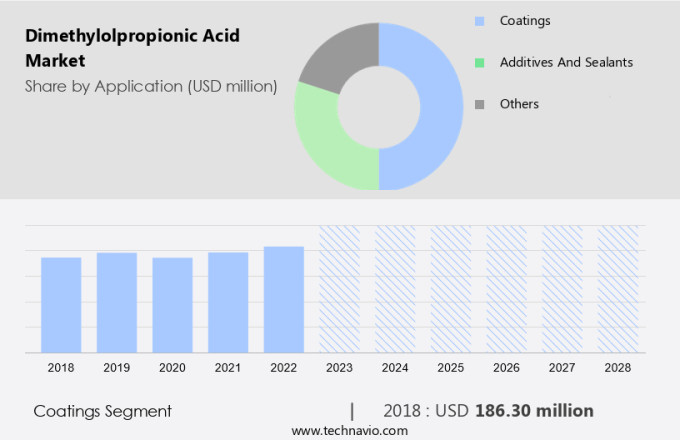
The coatings segment is estimated to witness significant growth during the forecast period. Dimethylolpropionic acid (DMPA) is a versatile organic compound that plays a significant role in various industries, particularly in the production of coatings and resins. This diol, derived from propionic acid, is known for its ability to enhance the water dispersibility or solubility of resins through its free acid group. After neutralization with a base, DMPA introduces a polar group that improves coating adhesion and synthetic fiber dye receptivity, as well as increasing the alkali solubility of deposited films.
Get a glance at the market share of various regions Download the PDF Sample
The coatings segment accounted for USD 186.30 million in 2018. The textile industry, through Textile Exchange, utilizes DMPA in polyurethane dispersions for textiles and leather. In the realm of adhesives and sealants, DMPA is employed in alkyd resins, architectural coatings, and polyester resins for paints and coatings. DMPA's applications extend to the building and construction sector, where it enhances the functionality of powder coatings, epoxy polyesters, and glass and steel coatings. Trimethylolethane and trimethylolpropane, water-soluble resins, are often used in conjunction with DMPA to create aqueous urethane dispersions and gloss waterborne coatings. These coatings exhibit desirable properties, such as flexibility, toughness, impact resistance, and excellent adhesion to various substrates, including glass, steel, plastic, fiberglass, furniture, and electro-deposition coatings in the metal industry. DMPA's role in the manufacturing of protective coatings is crucial due to its ability to enhance the weathering properties of such coatings. As a key raw material, DMPA is extensively used in industrial coatings, concrete floors, and road paints. In the HVAC system and appliance industries, DMPA contributes to the production of raw materials, such as formaldehyde and propionaldehyde, which are essential in various applications.
Regional Analysis
For more insights on the market share of various regions Download PDF Sample now!
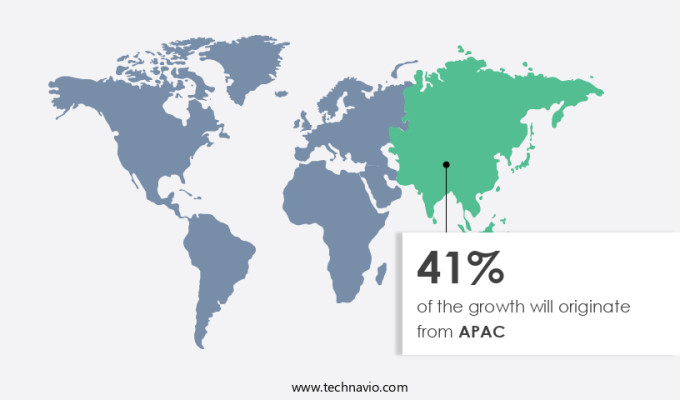
APAC is estimated to contribute 41% to the growth of the global market during the market forecast period. Technavio’s analysts have elaborately explained the regional trends and drivers that shape the market during the forecast period.
Dimethylolpropionic Acid (DMPA) is a crucial ingredient in the production of polyester resins, playing a significant role in the infrastructure sector and the petrochemical industry. This eco-friendly compound is widely used in coatings and adhesives, contributing to the development of waterborne coatings, multi-substrate coatings, and electrodeposition coatings. DMPA's applications extend to various industries, including electrical appliances, where it functions as a linseed oil glyceride replacement in resin coatings. Additionally, DMPA is employed in glass fiber sizing and powder coating applications, further broadening its market reach. Overall, Dimethylolpropionic Acid's versatility and performance make it an essential component in the coatings, adhesives, and resins industries.
Segment Overview
The market report provides comprehensive data (region-wise segment analysis), with forecasts and estimates in "USD million " for the period 2024-2028, as well as historical data from 2018-2022 for the following segments.
- Application Outlook
- Coatings
- Additives and sealants
- Others
- End-user Outlook
- Automotive industry
- Paints and coating industry
- Others
- Region Outlook
- North America
- The U.S.
- Canada
- Europe
- U.K.
- Germany
- France
- Rest of Europe
- APAC
- China
- India
- Middle East & Africa
- Saudi Arabia
- South Africa
- Rest of the Middle East & Africa
- South America
- Argentina
- Brazil
- Chile
- North America
You may also be interested in:
- Polyurethane Dispersions Market Analysis APAC, Europe, North America, Middle East and Africa, South America - US, China, India, Germany, France - Size and Forecast
- Polyurethane Coatings Market Analysis APAC, Europe, North America, South America, Middle East and Africa - China, US, Japan, Germany, UK - Size and Forecast
- Emulsion Polymers Market Analysis APAC, North America, Europe, South America, Middle East and Africa - China, US, India, Germany, Canada - Size and Forecast
Market Analyst Overview
Dimethylolpropionic Acid (DMPA) is a versatile organic compound used in various industries, including textiles, coatings, and adhesives. DMPA is primarily used as a cross-linking agent in the production of Polyurethane Dispersion (PUD), which is widely employed in textiles for making water-resistant and breathable fabrics. In the coatings industry, DMPA is used in the production of water-soluble resins, aqueous urethane dispersions, and gloss waterborne coatings. The building and construction sector utilizes DMPA in architectural coatings, epoxy polyester, and powder coatings due to its flexibility, toughness, and impact resistance.
In the textile and leather industry, DMPA is used in the production of Trimethylolethane and Trimethylolpropane-based resins. DMPA also finds applications in industrial sectors such as furniture & upholstery, appliances, HVAC systems, and electro-deposition coatings for the metal industry. The raw materials used in the production of DMPA include formaldehyde and propionaldehyde. DMPA's functional properties, such as adhesion, gloss, flow property, and excellent resistance to glass, steel, plastic, fiberglass, and other materials, make it a valuable ingredient in various industries. The demand for DMPA is expected to grow due to its increasing usage in various end-use industries. According to Trademap data, the global market is anticipated to expand at a steady pace in the coming years.
|
Market Scope |
|
|
Report Coverage |
Details |
|
Page number |
193 |
|
Base year |
2023 |
|
Historic period |
2018-2022 |
|
Forecast period |
2024-2028 |
|
Growth momentum & CAGR |
Accelerate at a CAGR of 7.05% |
|
Market growth 2024-2028 |
USD 230.2 million |
|
Market structure |
Fragmented |
|
YoY growth 2023-2024(%) |
6.42 |
|
Regional analysis |
APAC, Europe, North America, Middle East and Africa, and South America |
|
Performing market contribution |
APAC at 41% |
|
Key countries |
US, China, India, Germany, UK, and Canada |
|
Competitive landscape |
Leading Companies, Market Positioning of Companies, Competitive Strategies, and Industry Risks |
|
Key companies profiled |
Actylis, Anhui Sinograce Chemical Co. Ltd., Biosynth Ltd., Connect Chemicals GmbH, Fengchen Group Co. Ltd., Glister Industrial Development Co. Ltd., Huzhou Changsheng Chemical Co. Ltd, Jiangxi Keding Chemical Material Co. Ltd., Jiangxi Nancheng Hongdu Chemical Technology Development Co.Ltd., Jiangxi Selon Industrial Co. Ltd., Merck KGaA, NutriScience Innovations LLC, Perstorp Holding AB, Pinpools GmbH. , Shandong Pulisi Chemical Co. Ltd., Shanghai Wibson Biotechnology Co. Ltd, Vesino Industrial Co. Ltd. , Yigyooly Enterprise Ltd., and Zhang Jia Gang Yarui Chemical Co. Ltd. |
|
Market dynamics |
Parent market analysis, Market growth inducers and obstacles, Fast-growing and slow-growing segment analysis, COVID-19 impact and recovery analysis and future consumer dynamics, Market condition analysis for forecast period |
|
Customization purview |
If our report has not included the data that you are looking for, you can reach out to our analysts and get segments customized. |
What are the Key Data Covered in this Market Research Report?
- CAGR of the market during the forecast period
- Detailed information on factors that will drive the market growth and forecasting between 2024 and 2028
- Precise estimation of the size of the market and its contribution of the market in focus to the parent market
- Accurate predictions about upcoming market growth and trends and changes in consumer behavior
- Growth of the market across APAC, Europe, North America, Middle East and Africa, and South America
- Thorough analysis of the market’s competitive landscape and detailed information about companies
- Comprehensive analysis of factors that will challenge the growth of market companies


