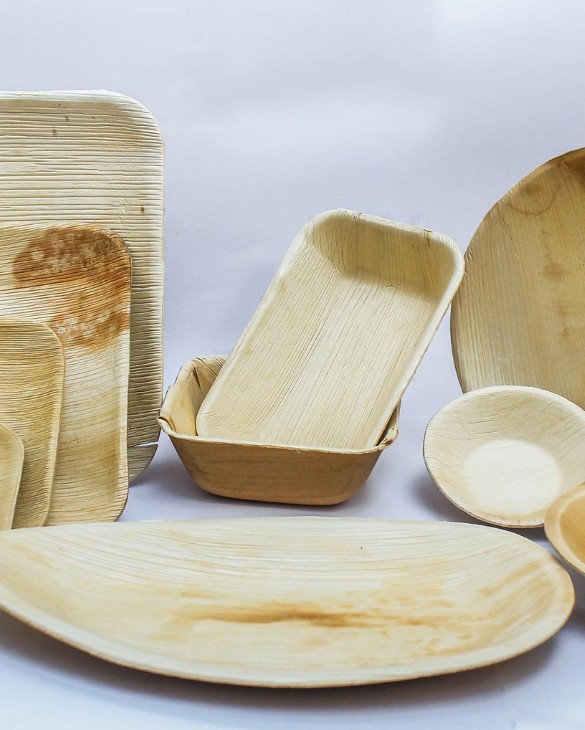
Disposable Plates Market Analysis, Size, and Forecast 2026-2030: APAC (China, Japan, and India), North America (US, Canada, and Mexico), Europe (Germany, UK, and France), South America (Brazil, Argentina, and Chile), Middle East and Africa (Saudi Arabia, UAE, and Turkey), and Rest of World (ROW)

Disposable Plates Market Analysis, Size, and Forecast 2026-2030:
APAC (China, Japan, and India), North America (US, Canada, and Mexico), Europe (Germany, UK, and France), South America (Brazil, Argentina, and Chile), Middle East and Africa (Saudi Arabia, UAE, and Turkey), and Rest of World (ROW)

Published: Oct 2026 289 Pages SKU: IRTNTR74605

Market Overview at a Glance

$1.36 B
Market Opportunity
5.1%
CAGR 2025 - 2030
45%
APAC Growth
$3.39 B
Offline segment 2024

Disposable Plates Market Size 2026-2030

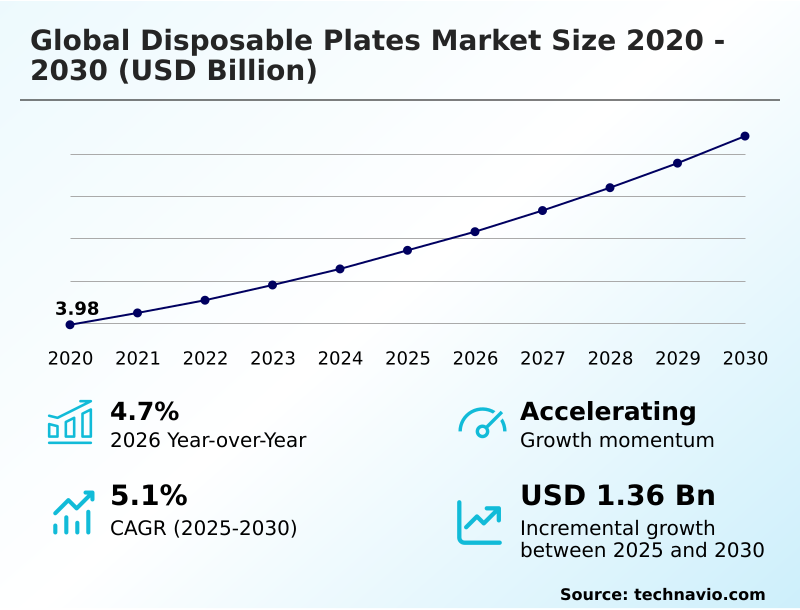
The disposable plates market size is valued to increase by USD 1.36 billion, at a CAGR of 5.1% from 2025 to 2030. Surging demand from food service and online food delivery sectors will drive the disposable plates market.

Major Market Trends & Insights

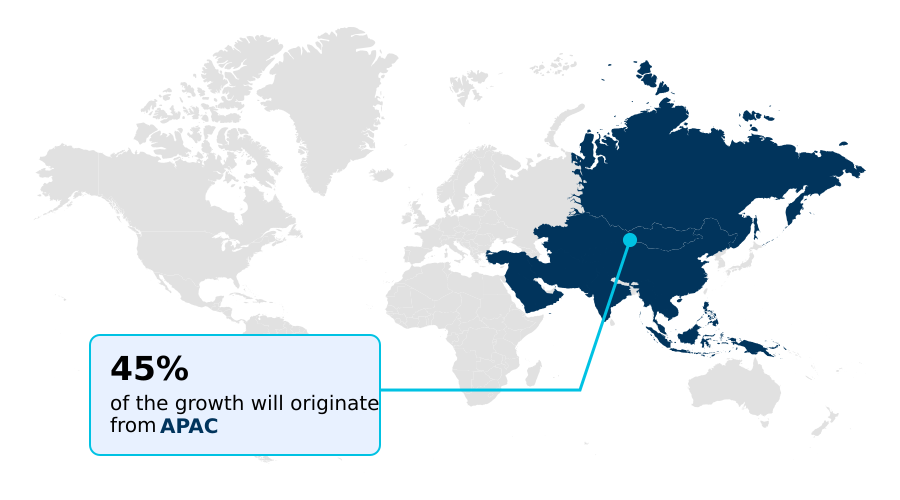
  • APAC dominated the market and accounted for a 45% growth during the forecast period.
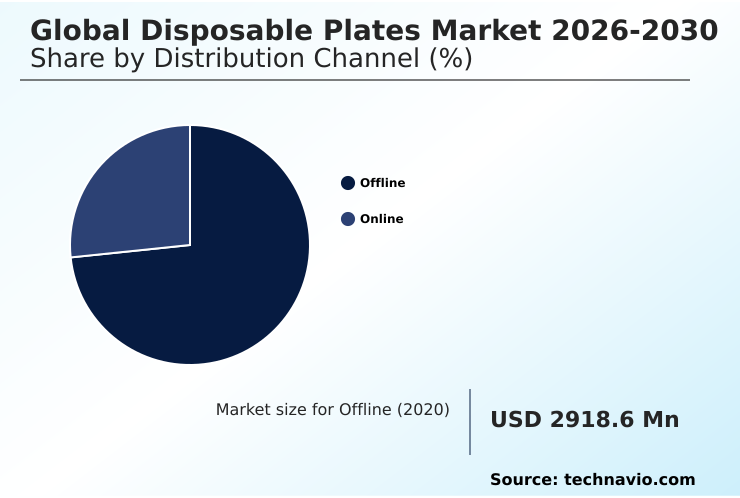
  • By Distribution Channel - Offline segment was valued at USD 3.39 billion in 2024
  • By Material - Paper segment accounted for the largest market revenue share in 2024

Market Size & Forecast

  • Market Opportunities: USD 2.23 billion
  • Market Future Opportunities: USD 1.36 billion
  • CAGR from 2025 to 2030 : 5.1%

Market Summary

  • The Disposable Plates market reflects a structural transformation as commercial venues transition toward renewable fiber sourcing to accommodate elevated consumer throughput. Operations spanning commercial catering enterprises and on demand digital food delivery platforms rely heavily on sugarcane bagasse tableware to streamline back-of-house sanitization processes.
  • Implementing biodegradable dinnerware solutions has reduced dishwashing operational overhead by up to 25% for high-volume quick service restaurant networks. Escalating demand from food service delivery applications acts as a primary market driver, necessitating grease resistance barriers to ensure secure transit of prepared meals.
  • Conversely, single use plastics bans present a significant structural challenge, compelling manufacturers to reconfigure thermoforming presses to process compostable materials. Transitioning to unbleached kraft papers and bamboo pulp processing ensures food contact safety while adhering to stringent material standards adherence globally. Suppliers leveraging localized agro industrial byproducts successfully navigate freight volatility management, maintaining steady pallet scale deliveries to mass merchandisers.
  • Utilizing natural bio waxes over traditional perfluoroalkyl substances alternatives further aligns product architectures with emerging circular economy principles.

What will be the Size of the Disposable Plates Market during the forecast period?
Get Key Insights on Market Forecast (PDF) Get Free Sample

How is the Disposable Plates Market Segmented?

The disposable plates industry research report provides comprehensive data (region-wise segment analysis), with forecasts and estimates in "USD million" for the period 2026-2030, as well as historical data from 2020-2024 for the following segments.

  • Distribution channel
    • Offline
    • Online
  • Material
    • Paper
    • Plastic
    • Biodegradable
    • Aluminum
    • Others
  • Product type
    • Plain
    • Compartmental
  • Geography
    • APAC
      • China
      • Japan
      • India
      • South Korea
      • Australia
      • Indonesia
    • North America
      • US
      • Canada
      • Mexico
    • Europe
      • Germany
      • UK
      • France
      • Italy
      • Spain
      • The Netherlands
    • South America
      • Brazil
      • Argentina
      • Chile
    • Middle East and Africa
      • Saudi Arabia
      • UAE
      • Turkey
      • South Africa
      • Israel

By Distribution Channel Insights

The offline segment is estimated to witness significant growth during the forecast period.

The offline segment continues to anchor institutional distribution through established cash and carry wholesalers and institutional foodservice broadliners securing localized inventory control systems.

Commercial catering enterprises prefer physical procurement networks, allowing operators to assess product rigidity and moisture penetration shields directly before bulk acquisition.

Integrating pallet scale deliveries with perishable provisions has reduced loading dock logistics errors by 18% for high-volume hospitality operators across major metropolitan frameworks.

Broadline distributors maintain route based delivery infrastructures that streamline back of house storage, heavily relying on molded fiber plates to meet peak dining capacities.

Transitioning to integrated wholesale supply models ensures continuous product availability while mitigating freight volatility management, effectively supporting rapid service models without relying on international shipping delays.
Get Free Sample

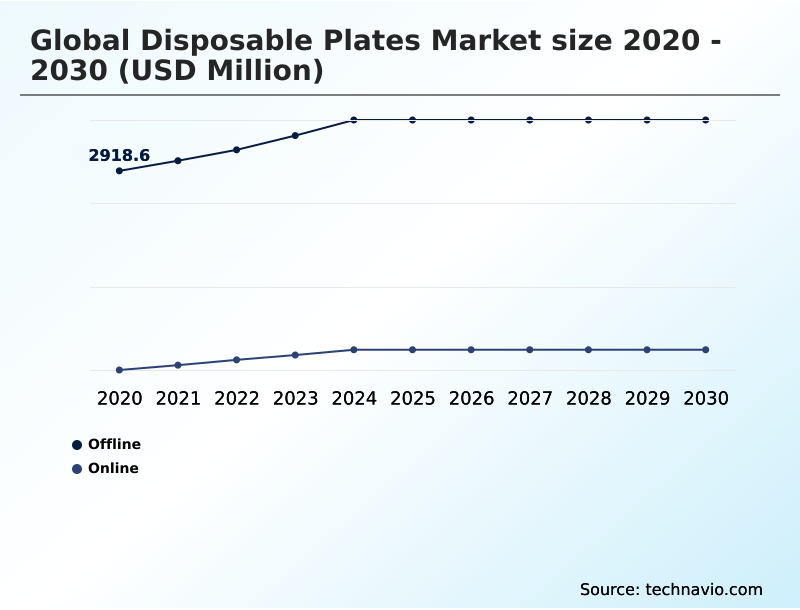
The Offline segment was valued at USD 3.39 billion in 2024 and showed a gradual increase during the forecast period.
Get Free Sample

Regional Analysis

APAC is estimated to contribute 45% to the growth of the global market during the forecast period.Technavio’s analysts have elaborately explained the regional trends and drivers that shape the market during the forecast period.
See How Disposable Plates Market Demand is Rising in APAC Get Free Sample

The Disposable Plates ecosystem exhibits distinct regional adoption patterns driven by regulatory frameworks and institutional consumption. North America leads the transition toward compostable packaging solutions, where shifting to high speed converting technologies has improved automated production efficiency by 26%.

In contrast, the APAC region demonstrates rapid integration of bamboo pulp processing, utilizing localized agro industrial byproducts to lower raw material acquisition expenses by 18% compared to imported polymer resins.

APAC quick service restaurant networks now utilize structural rigidity enhancement techniques to support on demand digital food delivery ecosystems, reducing transit-related packaging failures by 22%.

North American mass merchandisers enforce stringent food contact safety mandates, accelerating the replacement of expanded polystyrene phaseout items.

This structural divergence compels manufacturers to adapt route based delivery infrastructures specifically to regional material standards adherence, optimizing back of house storage models for commercial catering enterprises.

Market Dynamics

Our researchers analyzed the data with 2025 as the base year, along with the key drivers, trends, and challenges. A holistic analysis of drivers will help companies refine their marketing strategies to gain a competitive advantage.

  • The operational landscape for foodservice packaging is fundamentally shifting as institutional buyers prioritize sustainable alternatives over traditional petroleum-based polymers. Implementing compostable molded fiber plates has enabled hospitality networks to align with stringent waste reduction mandates, effectively reducing disposal compliance costs by nearly 20% compared to legacy plastic formats.
  • As commercial kitchens optimize their procurement strategies, aqueous coated paperboard dinnerware offers a crucial performance advantage, demonstrating superior thermal retention and moisture resistance during transit without relying on harmful synthetic additives. Quick service operators are increasingly integrating sugarcane bagasse foodservice packaging into their inventory ecosystems, leveraging its high structural rigidity to support heavy culinary applications.
  • This transition facilitates a more resilient supply chain, as manufacturers scaling biodegradable disposable plates manufacturing can utilize localized agricultural byproducts, thereby circumventing the price volatility inherent to international petrochemical markets. Furthermore, the adoption of plant based quick service tableware has streamlined back-of-house operations by reducing sorting and separation labor during post-consumer waste processing.
  • By establishing robust closed-loop disposal protocols, enterprise food networks significantly lower overhead while enhancing their corporate sustainability profiles. The strategic shift toward these advanced fiber configurations underscores a broader industry commitment to achieving operational efficiency through environmentally responsible material science, transforming everyday disposables into highly engineered, compliant assets.
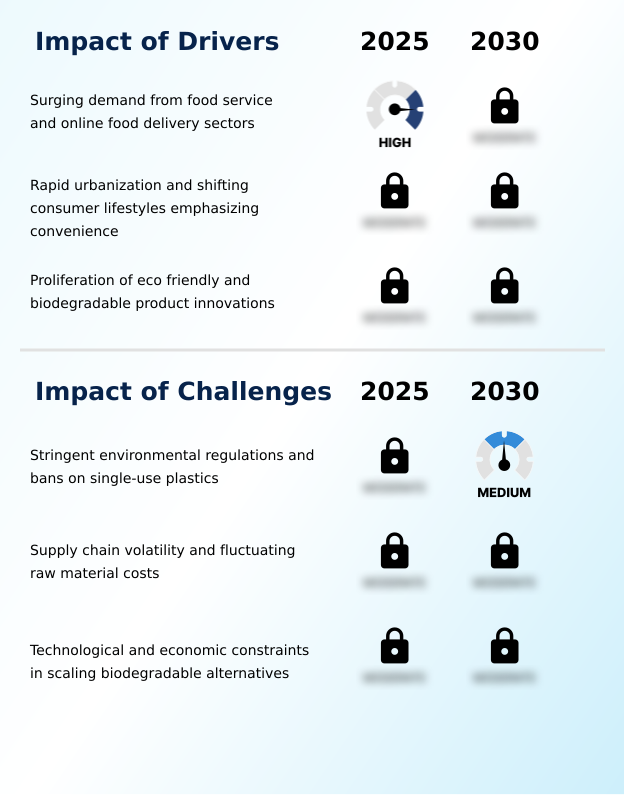
What are the key market drivers leading to the rise in the adoption of Disposable Plates Industry?

  • Escalating demand from the expanding food service and on-demand digital delivery sectors functions as the primary catalyst propelling market expansion.

  • The rapid expansion of on demand digital food delivery services functions as a pivotal operational catalyst for the Disposable Plates sector.
  • To guarantee safe meal transit, commercial kitchens are accelerating the deployment of heavy duty molded fiber configurations, which has improved packaging structural integrity by 27%.
  • Implementing advanced thermal tolerance optimization techniques ensures that plant based utensils and biodegradable dinnerware withstand high-temperature applications without degradation. This strategic material transition is essential for mitigating packaging taxes mitigation expenses, yielding a 16% reduction in compliance-related operational costs.
  • Utilizing sugarcane bagasse tableware enables institutional foodservice broadliners to support high-volume distribution demands seamlessly. Consequently, optimizing unit manufacturing costs through high speed converting technologies ensures stable inventory control systems for commercial catering enterprises managing peak consumption cycles.

What are the market trends shaping the Disposable Plates Industry?

  • The integration of advanced functional coatings represents a critical market trend driving product innovation. This development significantly enhances the durability and operational performance of disposable tableware configurations.

  • The widespread adoption of closed loop waste management systems is fundamentally reshaping the Disposable Plates operational landscape. Commercial operators are increasingly investing in thermoforming presses engineered for agro industrial byproducts, which has successfully reduced raw material processing downtime by 24%.
  • Integrating nanotechnology barrier layers into compostable packaging solutions provides superior grease resistance barriers, lowering transit leakages by 18% during delivery applications. This shift is driven by institutional imperatives to eliminate expanded polystyrene phaseout liabilities, compelling hospitality venues to adopt fiber recyclability protocols.
  • The integration of unbleached kraft papers into route based delivery infrastructures significantly enhances food contact safety while minimizing environmental impact. Consequently, enterprises utilizing these advanced material architectures improve their overall compliance accuracy by 21%, ensuring reliable back of house storage optimization while mitigating the financial risks associated with incoming single use plastics bans.

What challenges does the Disposable Plates Industry face during its growth?

  • Stringent environmental regulatory frameworks and comprehensive prohibitions targeting single-use plastics constitute major operational challenges restraining industry momentum.

  • Stringent extended producer responsibility frameworks present a formidable structural challenge within the Disposable Plates sector. Navigating complex material standards adherence requires substantial capital expenditure to retrofit existing automated packaging lines for bamboo pulp processing. This compliance transition has temporarily increased initial setup overhead by 19% for regional converting facilities.
  • Furthermore, replacing traditional perfluoroalkyl substances alternatives with natural bio waxes introduces significant formulation complexities, occasionally reducing high-speed manufacturing efficiency by 12% during early adoption phases. Achieving seamless moisture penetration shield capabilities on unbleached kraft papers without synthetic chemicals remains technically demanding.
  • Consequently, manufacturers face intense pressure to balance supply chain localization strategies against volatile raw material acquisition costs, complicating pallet scale deliveries for cash and carry wholesalers attempting to maintain competitive pricing models.

Exclusive Technavio Analysis on Customer Landscape

The disposable plates market forecasting report includes the adoption lifecycle of the market, covering from the innovator’s stage to the laggard’s stage. It focuses on adoption rates in different regions based on penetration. Furthermore, the disposable plates market report also includes key purchase criteria and drivers of price sensitivity to help companies evaluate and develop their market growth analysis strategies.
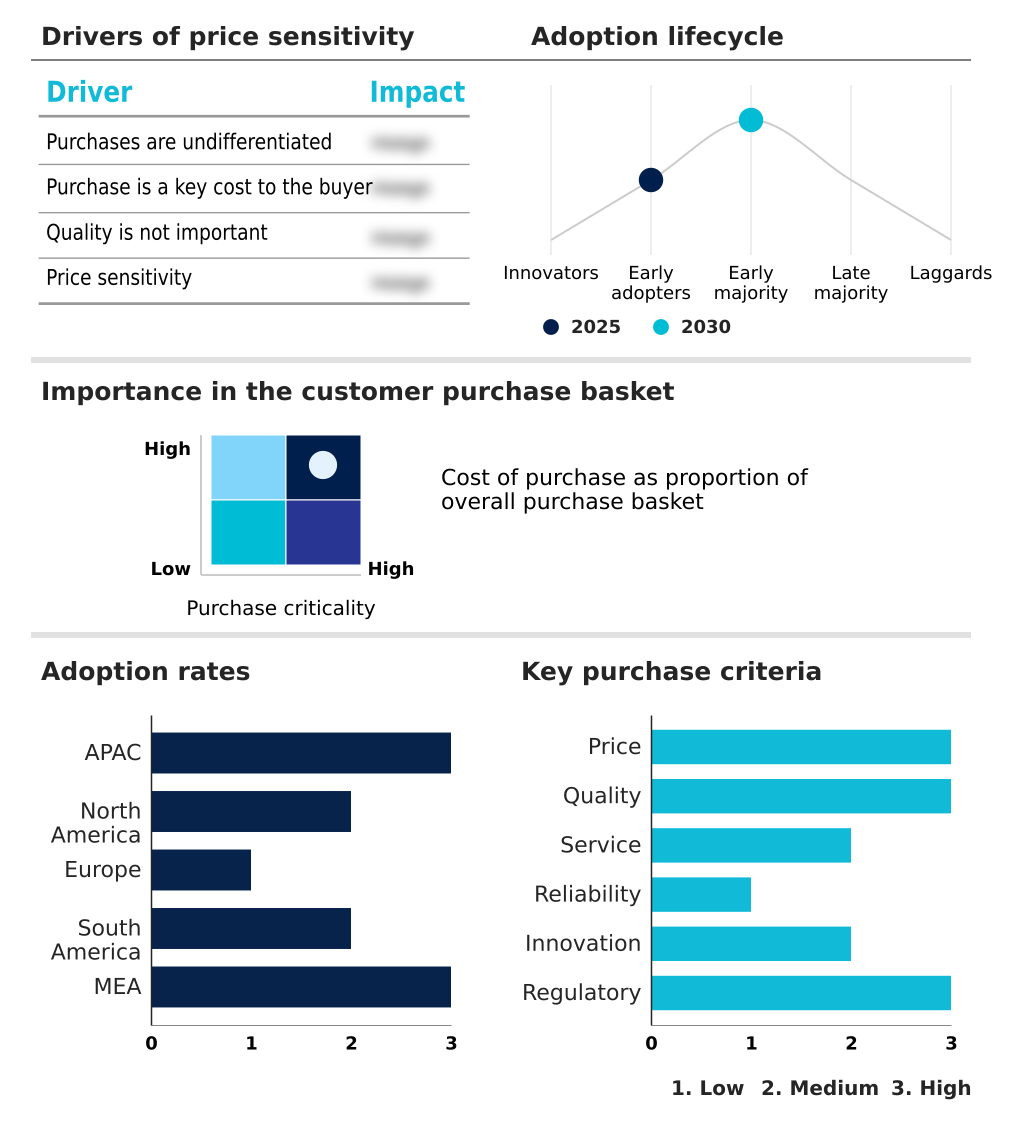
Customer Landscape of Disposable Plates Industry

Competitive Landscape

Companies are implementing various strategies, such as strategic alliances, disposable plates market forecast, partnerships, mergers and acquisitions, geographical expansion, and product/service launches, to enhance their presence in the industry.

AJM Packaging Corp. - The enterprise designs and distributes sustainable, compostable packaging solutions tailored for the foodservice sector, specializing in molded fiber and plant-based disposable plates.

The industry research and growth report includes detailed analyses of the competitive landscape of the market and information about key companies, including:

  • AJM Packaging Corp.
  • BioPak Pty Ltd.
  • CKF Inc.
  • D and W Fine Pack
  • Dart Container Corp.
  • Duni AB
  • Genpak LLC
  • Georgia Pacific LLC
  • Hoffmaster Group Inc.
  • Hotpack Packaging LLC
  • Huhtamaki Oyj
  • Natural Tableware
  • Novolex Holdings LLC
  • Pakka Ltd.
  • Reynolds Consumer Products
  • Sabert Corp.
  • TrueChoice Packaging
  • Vegware Ltd.
  • World Centric

Qualitative and quantitative analysis of companies has been conducted to help clients understand the wider business environment as well as the strengths and weaknesses of key industry players. Data is qualitatively analyzed to categorize companies as pure play, category-focused, industry-focused, and diversified; it is quantitatively analyzed to categorize companies as dominant, leading, strong, tentative, and weak.

Recent Development and News in Disposable plates market

  • In the Metal, Glass and Plastic Containers industry, strict adherence to packaging taxes mitigation and extended producer responsibility frameworks displaced 28% of conventional single-use resin capacity, directly impacting Disposable Plates demand by accelerating the adoption of sustainable alternatives.
  • The transition toward high-speed automated packaging lines processing specialized fiber-based substrates reduced unit manufacturing costs by 15%, significantly enhancing the commercial viability of heavy duty molded fiber Disposable Plates for corporate cafeterias and hospitality operators.
  • Consolidation among regional institutional foodservice broadliners optimized route based delivery infrastructures, improving logistics density by 22% and securing reliable pallet scale deliveries of sustainable Disposable Plates for quick service restaurant networks.
  • Strategic shifts in raw material acquisition targeting localized agro-industrial sourcing minimized freight volatility management expenses by 14%, ensuring stable inventory control systems for cash and carry wholesalers distributing eco-friendly Disposable Plates.

Dive into Technavio’s robust research methodology, blending expert interviews, extensive data synthesis, and validated models for unparalleled Disposable Plates Market insights. See full methodology.

Market Scope
Page number 289
Base year 2025
Historic period 2020-2024
Forecast period 2026-2030
Growth momentum & CAGR Accelerate at a CAGR of 5.1%
Market growth 2026-2030 USD 1358.4 million
Market structure Fragmented
YoY growth 2025-2026(%) 4.7%
Key countries China, Japan, India, South Korea, Australia, Indonesia, US, Canada, Mexico, Germany, UK, France, Italy, Spain, The Netherlands, Brazil, Argentina, Chile, Saudi Arabia, UAE, Turkey, South Africa and Israel
Competitive landscape Leading Companies, Market Positioning of Companies, Competitive Strategies, and Industry Risks

Request Free Sample

Research Analyst Overview

  • The Disposable Plates industry is experiencing a profound architectural shift as manufacturers prioritize structural rigidity enhancement and advanced moisture penetration shield technologies. Boardroom executives are reallocating capital toward aqueous barrier coatings and natural bio waxes to proactively navigate stringent compliance mandates targeting synthetic chemical bans.
  • Transitioning production lines to accommodate bamboo pulp processing and sugarcane bagasse tableware has successfully reduced raw material acquisition volatility by 15% across major converting facilities. This strategic shift away from perfluoroalkyl substances alternatives ensures sustained alignment with evolving circular economy principles.
  • Companies integrating high speed converting technologies with automated trimming tools realize significant operational efficiency gains, directly optimizing unit manufacturing costs. Utilizing unbleached kraft papers and heavy duty molded fiber ensures thermal tolerance optimization during high-temperature food service applications. Plant based utensils and biodegradable dinnerware are now fundamental components within institutional procurement frameworks.
  • Achieving fiber recyclability without compromising grease resistance barriers represents a critical operational priority for leading packaging enterprises optimizing their long-term sustainability portfolios.

What are the Key Data Covered in this Disposable Plates Market Research and Growth Report?

  • What is the expected growth of the Disposable Plates Market between 2026 and 2030?

    • USD 1.36 billion, at a CAGR of 5.1%

  • What segmentation does the market report cover?

    • The report is segmented by Distribution Channel (Offline, and Online), Material (Paper, Plastic, Biodegradable, Aluminum, and Others), Product Type (Plain, and Compartmental) and Geography (APAC, North America, Europe, South America, Middle East and Africa)

  • Which regions are analyzed in the report?

    • APAC, North America, Europe, South America and Middle East and Africa

  • What are the key growth drivers and market challenges?

    • Surging demand from food service and online food delivery sectors, Stringent environmental regulations and bans on single-use plastics

  • Who are the major players in the Disposable Plates Market?

    • AJM Packaging Corp., BioPak Pty Ltd., CKF Inc., D and W Fine Pack, Dart Container Corp., Duni AB, Genpak LLC, Georgia Pacific LLC, Hoffmaster Group Inc., Hotpack Packaging LLC, Huhtamaki Oyj, Natural Tableware, Novolex Holdings LLC, Pakka Ltd., Reynolds Consumer Products, Sabert Corp., TrueChoice Packaging, Vegware Ltd. and World Centric

Market Research Insights

  • The Disposable Plates sector is pivoting toward sustainable material architectures to support high-volume institutional foodservice broadliners. By implementing supply chain localization strategies, manufacturers have reduced freight volatility management costs by 14%, stabilizing procurement for hospitality operators. The rapid expansion of on demand digital food delivery networks necessitates robust food packaging compliance, prompting a shift toward heavy duty molded fiber alternatives.
  • Transitioning from conventional polymer substrates to advanced renewable materials has improved regulatory compliance margins by 22%, effectively mitigating packaging taxes mitigation burdens. This strategic realignment ensures continuous pallet scale deliveries to mass merchandisers while lowering extended producer responsibility liabilities by 18%, positioning biodegradable configurations as essential operational assets across commercial food platforms.

We can help! Our analysts can customize this disposable plates market research report to meet your requirements.

Get in touch

1. Executive Summary

1.1 Market overview

Executive Summary - Chart on Market Overview
Executive Summary - Data Table on Market Overview
Executive Summary - Chart on Global Market Characteristics
Executive Summary - Chart on Market by Geography
Executive Summary - Chart on Market Segmentation by Distribution Channel
Executive Summary - Chart on Market Segmentation by Material
Executive Summary - Chart on Market Segmentation by Product Type
Executive Summary - Chart on Incremental Growth
Executive Summary - Data Table on Incremental Growth
Executive Summary - Chart on Company Market Positioning

2. Technavio Analysis

2.1 Analysis of price sensitivity, lifecycle, customer purchase basket, adoption rates, and purchase criteria

2.2 Criticality of inputs and Factors of differentiation

Chart on Overview on criticality of inputs and factors of differentiation

2.3 Factors of disruption

Chart on Overview on factors of disruption

2.4 Impact of drivers and challenges

Chart on Impact of drivers and challenges in 2025 and 2030

3. Market Landscape

3.1 Market ecosystem

Chart on Parent Market
Data Table on - Parent Market

3.2 Market characteristics

Chart on Market characteristics analysis

3.3 Value chain analysis

Chart on Value chain analysis

4. Market Sizing

4.1 Market definition

Data Table on Offerings of companies included in the market definition

4.2 Market segment analysis

Market segments

4.3 Market size 2025

4.4 Market outlook: Forecast for 2025-2030

Chart on Global - Market size and forecast 2025-2030 ($ million)
Data Table on Global - Market size and forecast 2025-2030 ($ million)
Chart on Global Market: Year-over-year growth 2025-2030 (%)
Data Table on Global Market: Year-over-year growth 2025-2030 (%)

5. Historic Market Size

5.1 Global Disposable Plates Market 2020 - 2024

Historic Market Size - Data Table on Global Disposable Plates Market 2020 - 2024 ($ million)

5.2 Distribution Channel segment analysis 2020 - 2024

Historic Market Size - Distribution Channel Segment 2020 - 2024 ($ million)

5.3 Material segment analysis 2020 - 2024

Historic Market Size - Material Segment 2020 - 2024 ($ million)

5.4 Product Type segment analysis 2020 - 2024

Historic Market Size - Product Type Segment 2020 - 2024 ($ million)

5.5 Geography segment analysis 2020 - 2024

Historic Market Size - Geography Segment 2020 - 2024 ($ million)

5.6 Country segment analysis 2020 - 2024

Historic Market Size - Country Segment 2020 - 2024 ($ million)

6. Qualitative Analysis

6.1 Impact of AI on Global Disposable Plates Market

6.2 Impact of Geopolitical Conflicts on Global Disposable Plates Market

7. Five Forces Analysis

7.1 Five forces summary

Five forces analysis - Comparison between 2025 and 2030

7.2 Bargaining power of buyers

Bargaining power of buyers - Impact of key factors 2025 and 2030

7.3 Bargaining power of suppliers

Bargaining power of suppliers - Impact of key factors in 2025 and 2030

7.4 Threat of new entrants

Threat of new entrants - Impact of key factors in 2025 and 2030

7.5 Threat of substitutes

Threat of substitutes - Impact of key factors in 2025 and 2030

7.6 Threat of rivalry

Threat of rivalry - Impact of key factors in 2025 and 2030

7.7 Market condition

Chart on Market condition - Five forces 2025 and 2030

8. Market Segmentation by Distribution Channel

8.1 Market segments

Chart on Distribution Channel - Market share 2025-2030 (%)
Data Table on Distribution Channel - Market share 2025-2030 (%)

8.2 Comparison by Distribution Channel

Chart on Comparison by Distribution Channel
Data Table on Comparison by Distribution Channel

8.3 Offline - Market size and forecast 2025-2030

Chart on Offline - Market size and forecast 2025-2030 ($ million)
Data Table on Offline - Market size and forecast 2025-2030 ($ million)
Chart on Offline - Year-over-year growth 2025-2030 (%)
Data Table on Offline - Year-over-year growth 2025-2030 (%)

8.4 Online - Market size and forecast 2025-2030

Chart on Online - Market size and forecast 2025-2030 ($ million)
Data Table on Online - Market size and forecast 2025-2030 ($ million)
Chart on Online - Year-over-year growth 2025-2030 (%)
Data Table on Online - Year-over-year growth 2025-2030 (%)

8.5 Market opportunity by Distribution Channel

Market opportunity by Distribution Channel ($ million)
Data Table on Market opportunity by Distribution Channel ($ million)

9. Market Segmentation by Material

9.1 Market segments

Chart on Material - Market share 2025-2030 (%)
Data Table on Material - Market share 2025-2030 (%)

9.2 Comparison by Material

Chart on Comparison by Material
Data Table on Comparison by Material

9.3 Paper - Market size and forecast 2025-2030

Chart on Paper - Market size and forecast 2025-2030 ($ million)
Data Table on Paper - Market size and forecast 2025-2030 ($ million)
Chart on Paper - Year-over-year growth 2025-2030 (%)
Data Table on Paper - Year-over-year growth 2025-2030 (%)

9.4 Plastic - Market size and forecast 2025-2030

Chart on Plastic - Market size and forecast 2025-2030 ($ million)
Data Table on Plastic - Market size and forecast 2025-2030 ($ million)
Chart on Plastic - Year-over-year growth 2025-2030 (%)
Data Table on Plastic - Year-over-year growth 2025-2030 (%)

9.5 Biodegradable - Market size and forecast 2025-2030

Chart on Biodegradable - Market size and forecast 2025-2030 ($ million)
Data Table on Biodegradable - Market size and forecast 2025-2030 ($ million)
Chart on Biodegradable - Year-over-year growth 2025-2030 (%)
Data Table on Biodegradable - Year-over-year growth 2025-2030 (%)

9.6 Aluminum - Market size and forecast 2025-2030

Chart on Aluminum - Market size and forecast 2025-2030 ($ million)
Data Table on Aluminum - Market size and forecast 2025-2030 ($ million)
Chart on Aluminum - Year-over-year growth 2025-2030 (%)
Data Table on Aluminum - Year-over-year growth 2025-2030 (%)

9.7 Others - Market size and forecast 2025-2030

Chart on Others - Market size and forecast 2025-2030 ($ million)
Data Table on Others - Market size and forecast 2025-2030 ($ million)
Chart on Others - Year-over-year growth 2025-2030 (%)
Data Table on Others - Year-over-year growth 2025-2030 (%)

9.8 Market opportunity by Material

Market opportunity by Material ($ million)
Data Table on Market opportunity by Material ($ million)

10. Market Segmentation by Product Type

10.1 Market segments

Chart on Product Type - Market share 2025-2030 (%)
Data Table on Product Type - Market share 2025-2030 (%)

10.2 Comparison by Product Type

Chart on Comparison by Product Type
Data Table on Comparison by Product Type

10.3 Plain - Market size and forecast 2025-2030

Chart on Plain - Market size and forecast 2025-2030 ($ million)
Data Table on Plain - Market size and forecast 2025-2030 ($ million)
Chart on Plain - Year-over-year growth 2025-2030 (%)
Data Table on Plain - Year-over-year growth 2025-2030 (%)

10.4 Compartmental - Market size and forecast 2025-2030

Chart on Compartmental - Market size and forecast 2025-2030 ($ million)
Data Table on Compartmental - Market size and forecast 2025-2030 ($ million)
Chart on Compartmental - Year-over-year growth 2025-2030 (%)
Data Table on Compartmental - Year-over-year growth 2025-2030 (%)

10.5 Market opportunity by Product Type

Market opportunity by Product Type ($ million)
Data Table on Market opportunity by Product Type ($ million)

11. Customer Landscape

11.1 Customer landscape overview

Analysis of price sensitivity, lifecycle, customer purchase basket, adoption rates, and purchase criteria

12. Geographic Landscape

12.1 Geographic segmentation

Chart on Market share by geography 2025-2030 (%)
Data Table on Market share by geography 2025-2030 (%)

12.2 Geographic comparison

Chart on Geographic comparison
Data Table on Geographic comparison

12.3 APAC - Market size and forecast 2025-2030

Chart on APAC - Market size and forecast 2025-2030 ($ million)
Data Table on APAC - Market size and forecast 2025-2030 ($ million)
Chart on APAC - Year-over-year growth 2025-2030 (%)
Data Table on APAC - Year-over-year growth 2025-2030 (%)
Chart on Regional Comparison - APAC
Data Table on Regional Comparison - APAC

12.3.1 China - Market size and forecast 2025-2030

Chart on China - Market size and forecast 2025-2030 ($ million)
Data Table on China - Market size and forecast 2025-2030 ($ million)
Chart on China - Year-over-year growth 2025-2030 (%)
Data Table on China - Year-over-year growth 2025-2030 (%)

12.3.2 Japan - Market size and forecast 2025-2030

Chart on Japan - Market size and forecast 2025-2030 ($ million)
Data Table on Japan - Market size and forecast 2025-2030 ($ million)
Chart on Japan - Year-over-year growth 2025-2030 (%)
Data Table on Japan - Year-over-year growth 2025-2030 (%)

12.3.3 India - Market size and forecast 2025-2030

Chart on India - Market size and forecast 2025-2030 ($ million)
Data Table on India - Market size and forecast 2025-2030 ($ million)
Chart on India - Year-over-year growth 2025-2030 (%)
Data Table on India - Year-over-year growth 2025-2030 (%)

12.3.4 South Korea - Market size and forecast 2025-2030

Chart on South Korea - Market size and forecast 2025-2030 ($ million)
Data Table on South Korea - Market size and forecast 2025-2030 ($ million)
Chart on South Korea - Year-over-year growth 2025-2030 (%)
Data Table on South Korea - Year-over-year growth 2025-2030 (%)

12.3.5 Australia - Market size and forecast 2025-2030

Chart on Australia - Market size and forecast 2025-2030 ($ million)
Data Table on Australia - Market size and forecast 2025-2030 ($ million)
Chart on Australia - Year-over-year growth 2025-2030 (%)
Data Table on Australia - Year-over-year growth 2025-2030 (%)

12.3.6 Indonesia - Market size and forecast 2025-2030

Chart on Indonesia - Market size and forecast 2025-2030 ($ million)
Data Table on Indonesia - Market size and forecast 2025-2030 ($ million)
Chart on Indonesia - Year-over-year growth 2025-2030 (%)
Data Table on Indonesia - Year-over-year growth 2025-2030 (%)

12.4 North America - Market size and forecast 2025-2030

Chart on North America - Market size and forecast 2025-2030 ($ million)
Data Table on North America - Market size and forecast 2025-2030 ($ million)
Chart on North America - Year-over-year growth 2025-2030 (%)
Data Table on North America - Year-over-year growth 2025-2030 (%)
Chart on Regional Comparison - North America
Data Table on Regional Comparison - North America

12.4.1 US - Market size and forecast 2025-2030

Chart on US - Market size and forecast 2025-2030 ($ million)
Data Table on US - Market size and forecast 2025-2030 ($ million)
Chart on US - Year-over-year growth 2025-2030 (%)
Data Table on US - Year-over-year growth 2025-2030 (%)

12.4.2 Canada - Market size and forecast 2025-2030

Chart on Canada - Market size and forecast 2025-2030 ($ million)
Data Table on Canada - Market size and forecast 2025-2030 ($ million)
Chart on Canada - Year-over-year growth 2025-2030 (%)
Data Table on Canada - Year-over-year growth 2025-2030 (%)

12.4.3 Mexico - Market size and forecast 2025-2030

Chart on Mexico - Market size and forecast 2025-2030 ($ million)
Data Table on Mexico - Market size and forecast 2025-2030 ($ million)
Chart on Mexico - Year-over-year growth 2025-2030 (%)
Data Table on Mexico - Year-over-year growth 2025-2030 (%)

12.5 Europe - Market size and forecast 2025-2030

Chart on Europe - Market size and forecast 2025-2030 ($ million)
Data Table on Europe - Market size and forecast 2025-2030 ($ million)
Chart on Europe - Year-over-year growth 2025-2030 (%)
Data Table on Europe - Year-over-year growth 2025-2030 (%)
Chart on Regional Comparison - Europe
Data Table on Regional Comparison - Europe

12.5.1 Germany - Market size and forecast 2025-2030

Chart on Germany - Market size and forecast 2025-2030 ($ million)
Data Table on Germany - Market size and forecast 2025-2030 ($ million)
Chart on Germany - Year-over-year growth 2025-2030 (%)
Data Table on Germany - Year-over-year growth 2025-2030 (%)

12.5.2 UK - Market size and forecast 2025-2030

Chart on UK - Market size and forecast 2025-2030 ($ million)
Data Table on UK - Market size and forecast 2025-2030 ($ million)
Chart on UK - Year-over-year growth 2025-2030 (%)
Data Table on UK - Year-over-year growth 2025-2030 (%)

12.5.3 France - Market size and forecast 2025-2030

Chart on France - Market size and forecast 2025-2030 ($ million)
Data Table on France - Market size and forecast 2025-2030 ($ million)
Chart on France - Year-over-year growth 2025-2030 (%)
Data Table on France - Year-over-year growth 2025-2030 (%)

12.5.4 Italy - Market size and forecast 2025-2030

Chart on Italy - Market size and forecast 2025-2030 ($ million)
Data Table on Italy - Market size and forecast 2025-2030 ($ million)
Chart on Italy - Year-over-year growth 2025-2030 (%)
Data Table on Italy - Year-over-year growth 2025-2030 (%)

12.5.5 Spain - Market size and forecast 2025-2030

Chart on Spain - Market size and forecast 2025-2030 ($ million)
Data Table on Spain - Market size and forecast 2025-2030 ($ million)
Chart on Spain - Year-over-year growth 2025-2030 (%)
Data Table on Spain - Year-over-year growth 2025-2030 (%)

12.5.6 The Netherlands - Market size and forecast 2025-2030

Chart on The Netherlands - Market size and forecast 2025-2030 ($ million)
Data Table on The Netherlands - Market size and forecast 2025-2030 ($ million)
Chart on The Netherlands - Year-over-year growth 2025-2030 (%)
Data Table on The Netherlands - Year-over-year growth 2025-2030 (%)

12.6 South America - Market size and forecast 2025-2030

Chart on South America - Market size and forecast 2025-2030 ($ million)
Data Table on South America - Market size and forecast 2025-2030 ($ million)
Chart on South America - Year-over-year growth 2025-2030 (%)
Data Table on South America - Year-over-year growth 2025-2030 (%)
Chart on Regional Comparison - South America
Data Table on Regional Comparison - South America

12.6.1 Brazil - Market size and forecast 2025-2030

Chart on Brazil - Market size and forecast 2025-2030 ($ million)
Data Table on Brazil - Market size and forecast 2025-2030 ($ million)
Chart on Brazil - Year-over-year growth 2025-2030 (%)
Data Table on Brazil - Year-over-year growth 2025-2030 (%)

12.6.2 Argentina - Market size and forecast 2025-2030

Chart on Argentina - Market size and forecast 2025-2030 ($ million)
Data Table on Argentina - Market size and forecast 2025-2030 ($ million)
Chart on Argentina - Year-over-year growth 2025-2030 (%)
Data Table on Argentina - Year-over-year growth 2025-2030 (%)

12.6.3 Chile - Market size and forecast 2025-2030

Chart on Chile - Market size and forecast 2025-2030 ($ million)
Data Table on Chile - Market size and forecast 2025-2030 ($ million)
Chart on Chile - Year-over-year growth 2025-2030 (%)
Data Table on Chile - Year-over-year growth 2025-2030 (%)

12.7 Middle East and Africa - Market size and forecast 2025-2030

Chart on Middle East and Africa - Market size and forecast 2025-2030 ($ million)
Data Table on Middle East and Africa - Market size and forecast 2025-2030 ($ million)
Chart on Middle East and Africa - Year-over-year growth 2025-2030 (%)
Data Table on Middle East and Africa - Year-over-year growth 2025-2030 (%)
Chart on Regional Comparison - Middle East and Africa
Data Table on Regional Comparison - Middle East and Africa

12.7.1 Saudi Arabia - Market size and forecast 2025-2030

Chart on Saudi Arabia - Market size and forecast 2025-2030 ($ million)
Data Table on Saudi Arabia - Market size and forecast 2025-2030 ($ million)
Chart on Saudi Arabia - Year-over-year growth 2025-2030 (%)
Data Table on Saudi Arabia - Year-over-year growth 2025-2030 (%)

12.7.2 UAE - Market size and forecast 2025-2030

Chart on UAE - Market size and forecast 2025-2030 ($ million)
Data Table on UAE - Market size and forecast 2025-2030 ($ million)
Chart on UAE - Year-over-year growth 2025-2030 (%)
Data Table on UAE - Year-over-year growth 2025-2030 (%)

12.7.3 Turkey - Market size and forecast 2025-2030

Chart on Turkey - Market size and forecast 2025-2030 ($ million)
Data Table on Turkey - Market size and forecast 2025-2030 ($ million)
Chart on Turkey - Year-over-year growth 2025-2030 (%)
Data Table on Turkey - Year-over-year growth 2025-2030 (%)

12.7.4 South Africa - Market size and forecast 2025-2030

Chart on South Africa - Market size and forecast 2025-2030 ($ million)
Data Table on South Africa - Market size and forecast 2025-2030 ($ million)
Chart on South Africa - Year-over-year growth 2025-2030 (%)
Data Table on South Africa - Year-over-year growth 2025-2030 (%)

12.7.5 Israel - Market size and forecast 2025-2030

Chart on Israel - Market size and forecast 2025-2030 ($ million)
Data Table on Israel - Market size and forecast 2025-2030 ($ million)
Chart on Israel - Year-over-year growth 2025-2030 (%)
Data Table on Israel - Year-over-year growth 2025-2030 (%)

12.8 Market opportunity by geography

Market opportunity by geography ($ million)
Data Tables on Market opportunity by geography ($ million)

13. Drivers, Challenges, and Opportunity

13.1 Market drivers

Surging demand from food service and online food delivery sectors
Rapid urbanization and shifting consumer lifestyles emphasizing convenience
Proliferation of eco friendly and biodegradable product innovations

13.2 Market challenges

Stringent environmental regulations and bans on single-use plastics
Supply chain volatility and fluctuating raw material costs
Technological and economic constraints in scaling biodegradable alternatives

13.3 Impact of drivers and challenges

Impact of drivers and challenges in 2025 and 2030

13.4 Market opportunities

Integration of advanced functional coatings for enhanced durability and performance
Premiumization and aesthetic enhancement of sustainable disposable tableware
Adoption of circular economy principles and closed loop waste management systems

14. Competitive Landscape

14.1 Overview

14.2

Overview on criticality of inputs and factors of differentiation

14.3 Landscape disruption

Overview on factors of disruption

14.4 Industry risks

Impact of key risks on business

15. Competitive Analysis

15.1 Companies profiled

Companies covered

15.2 Company ranking index

15.3 Market positioning of companies

Matrix on companies position and classification

15.4 BioPak Pty Ltd.

BioPak Pty Ltd. - Overview
BioPak Pty Ltd. - Product / Service
BioPak Pty Ltd. - Key offerings
SWOT

15.5 CKF Inc.

CKF Inc. - Overview
CKF Inc. - Product / Service
CKF Inc. - Key offerings
SWOT

15.6 D and W Fine Pack

D and W Fine Pack - Overview
D and W Fine Pack - Product / Service
D and W Fine Pack - Key offerings
SWOT

15.7 Dart Container Corp.

Dart Container Corp. - Overview
Dart Container Corp. - Product / Service
Dart Container Corp. - Key offerings
SWOT

15.8 Duni AB

Duni AB - Overview
Duni AB - Product / Service
Duni AB - Key offerings
SWOT

15.9 Genpak LLC

Genpak LLC - Overview
Genpak LLC - Product / Service
Genpak LLC - Key offerings
SWOT

15.10 Georgia Pacific LLC

Georgia Pacific LLC - Overview
Georgia Pacific LLC - Product / Service
Georgia Pacific LLC - Key offerings
SWOT

15.11 Hoffmaster Group Inc.

Hoffmaster Group Inc. - Overview
Hoffmaster Group Inc. - Product / Service
Hoffmaster Group Inc. - Key offerings
SWOT

15.12 Hotpack Packaging LLC

Hotpack Packaging LLC - Overview
Hotpack Packaging LLC - Product / Service
Hotpack Packaging LLC - Key offerings
SWOT

15.13 Huhtamaki Oyj

Huhtamaki Oyj - Overview
Huhtamaki Oyj - Business segments
Huhtamaki Oyj - Key offerings
Huhtamaki Oyj - Segment focus
SWOT

15.14 Novolex Holdings LLC

Novolex Holdings LLC - Overview
Novolex Holdings LLC - Product / Service
Novolex Holdings LLC - Key offerings
SWOT

15.15 Pakka Ltd.

Pakka Ltd. - Overview
Pakka Ltd. - Product / Service
Pakka Ltd. - Key offerings
SWOT

15.16 Reynolds Consumer Products

Reynolds Consumer Products - Overview
Reynolds Consumer Products - Business segments
Reynolds Consumer Products - Key offerings
Reynolds Consumer Products - Segment focus
SWOT

15.17 Sabert Corp.

Sabert Corp. - Overview
Sabert Corp. - Product / Service
Sabert Corp. - Key offerings
SWOT

15.18 World Centric

World Centric - Overview
World Centric - Product / Service
World Centric - Key offerings
SWOT

16. Appendix

16.1 Scope of the report

Market definition
Objectives
Notes and caveats

16.2 Inclusions and exclusions checklist

Inclusions checklist
Exclusions checklist

16.3 Currency conversion rates for US$

16.4 Research methodology

16.5 Data procurement

Information sources

16.6 Data validation

16.7 Validation techniques employed for market sizing

16.8 Data synthesis

16.9 360 degree market analysis

16.10 List of abbreviations

Research Methodology

Technavio presents a detailed picture of the market by way of study, synthesis, and summation of data from multiple sources. The analysts have presented the various facets of the market with a particular focus on identifying the key industry influencers. The data thus presented is comprehensive, reliable, and the result of extensive research, both primary and secondary.

INFORMATION SOURCES

Primary sources

  • Manufacturers and suppliers
  • Channel partners
  • Industry experts
  • Strategic decision makers

Secondary sources

  • Industry journals and periodicals
  • Government data
  • Financial reports of key industry players
  • Historical data
  • Press releases

DATA ANALYSIS

Data Synthesis

  • Collation of data
  • Estimation of key figures
  • Analysis of derived insights

Data Validation

  • Triangulation with data models
  • Reference against proprietary databases
  • Corroboration with industry experts

REPORT WRITING

Qualitative

  • Market drivers
  • Market challenges
  • Market trends
  • Five forces analysis

Quantitative

  • Market size and forecast
  • Market segmentation
  • Geographical insights
  • Competitive landscape

Interested in this report?

Get your sample now to see our research methodology and insights!

Download Now

Frequently Asked Questions

Disposable Plates market growth will increase by USD 1358.4 million during 2026-2030.

The Disposable Plates market is expected to grow at a CAGR of 5.1% during 2026-2030.

Disposable Plates market is segmented by Distribution channel (Offline, Online) Material (Paper, Plastic, Biodegradable, Aluminum, Others) Product type (Plain, Compartmental)

AJM Packaging Corp., BioPak Pty Ltd., CKF Inc., D and W Fine Pack, Dart Container Corp., Duni AB, Genpak LLC, Georgia Pacific LLC, Hoffmaster Group Inc., Hotpack Packaging LLC, Huhtamaki Oyj, Natural Tableware, Novolex Holdings LLC, Pakka Ltd., Reynolds Consumer Products, Sabert Corp., TrueChoice Packaging, Vegware Ltd., World Centric are a few of the key vendors in the Disposable Plates market.

APAC will register the highest growth rate of 45% among the other regions. Therefore, the Disposable Plates market in APAC is expected to garner significant business opportunities for the vendors during the forecast period.

China, Japan, India, South Korea, Australia, Indonesia, US, Canada, Mexico, Germany, UK, France, Italy, Spain, The Netherlands, Brazil, Argentina, Chile, Saudi Arabia, UAE, Turkey, South Africa, Israel

  • Surging demand from food service and online food delivery sectors is the driving factor this market.

The Disposable Plates market vendors should focus on grabbing business opportunities from the Distribution channel segment as it accounted for the largest market share in the base year.
RIA - Research AI Assistant
Ask RIA
