Europe DIY Home Improvement Market Size 2025-2029
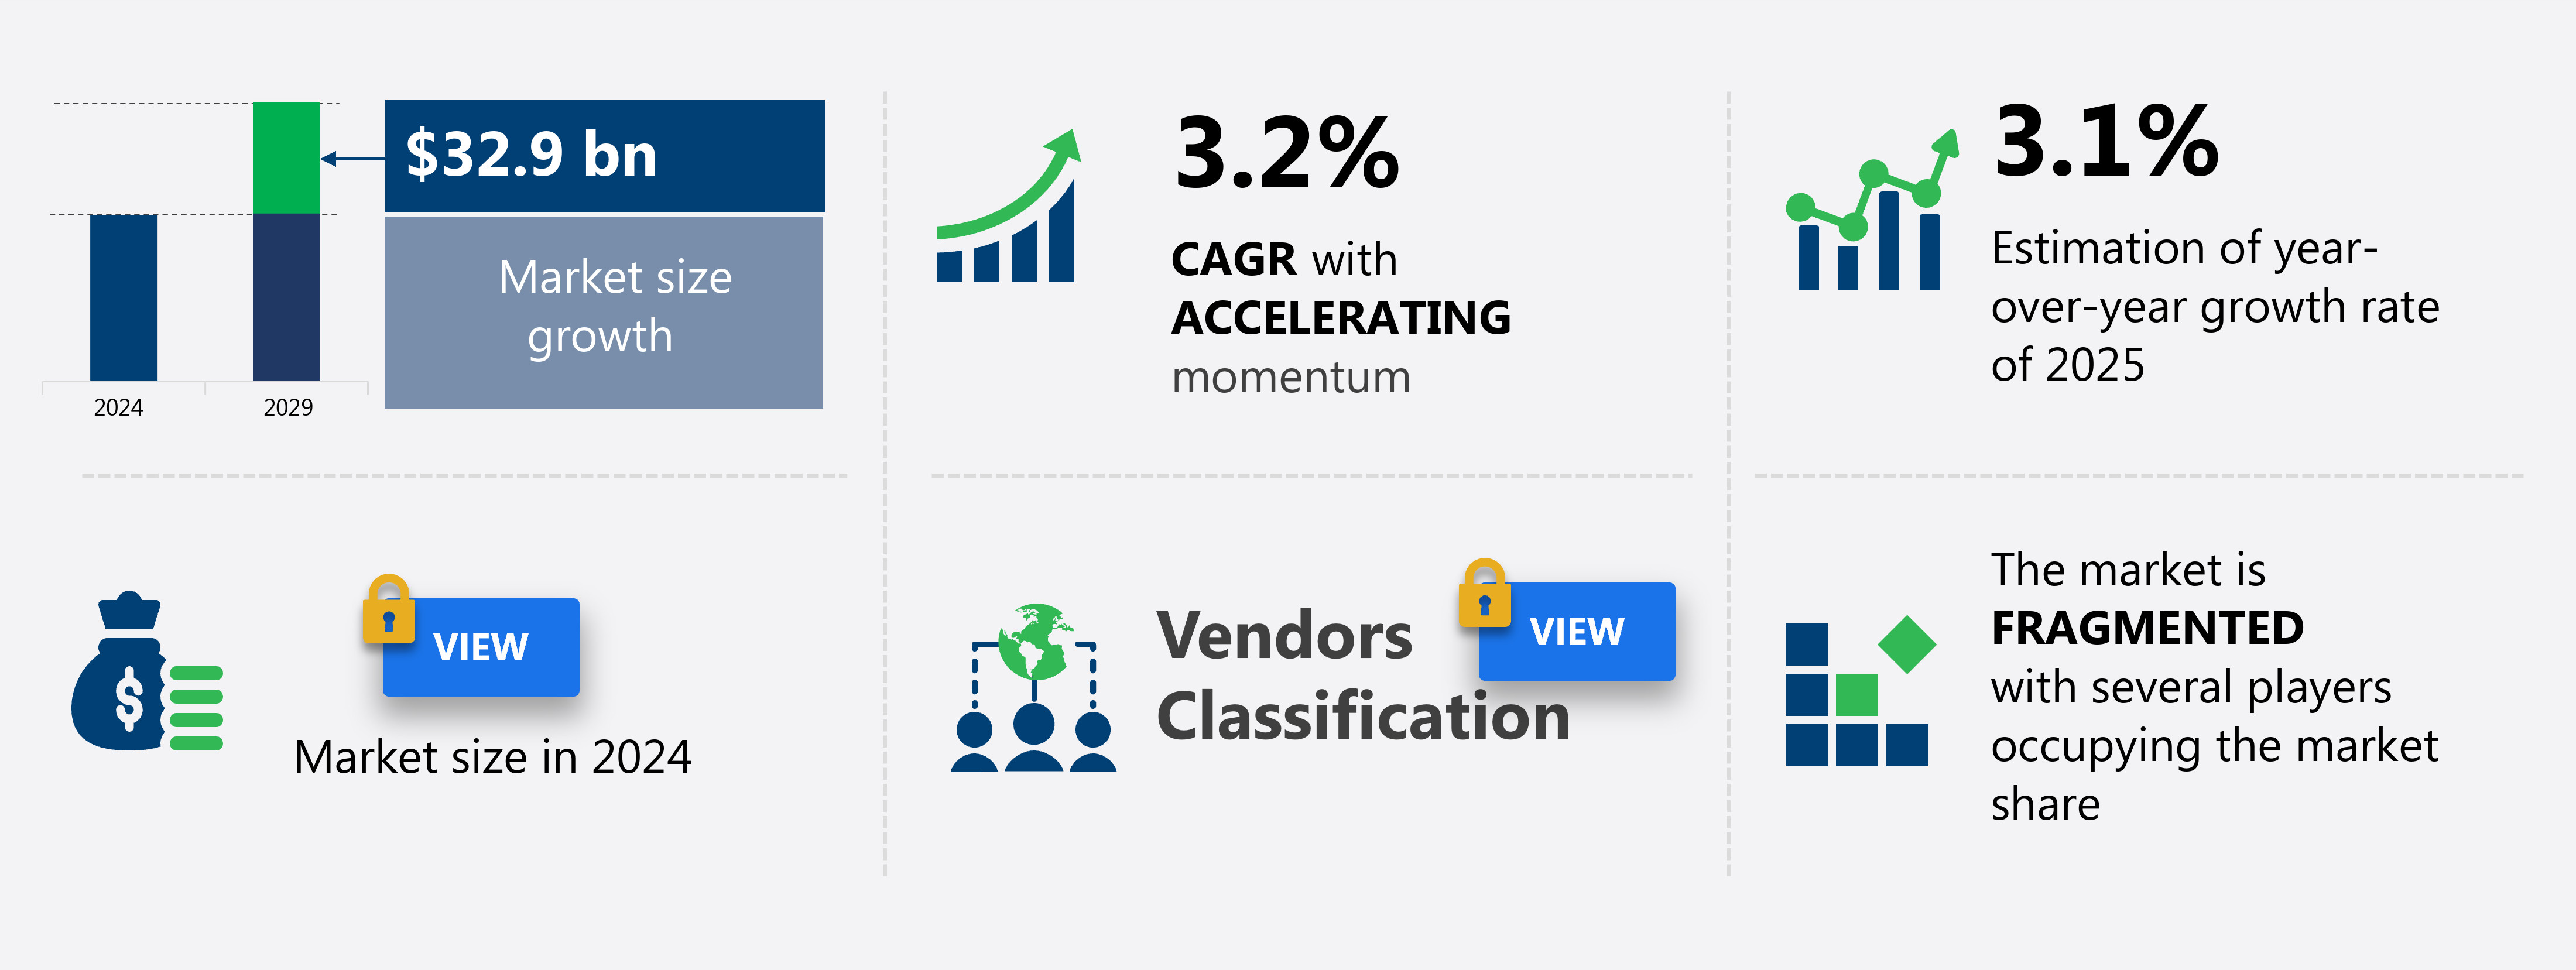
Europe diy home improvement market size is forecast to increase by USD 32.9 billion at a CAGR of 3.2% between 2024 and 2029.
- The European DIY home improvement market is witnessing significant growth, driven by the rising interest in DIY projects among consumers. This trend is fueled by the increasing availability of user-friendly tools and resources, enabling individuals to take on home improvement tasks with greater confidence. Technological advances in DIY tools, such as smart home technology and power tools, are making projects more efficient and accessible. However, the market faces challenges from the DIFM (Do It For Me) industry, which offers professional services for home improvement projects. This competition puts pressure on DIY retailers to differentiate themselves through competitive pricing, quality offerings, and value-added services.
- To capitalize on market opportunities, DIY home improvement companies should focus on enhancing their online presence, expanding their product ranges, and offering expert advice and support to customers. Effective operational planning and strategic partnerships can also help companies navigate the competitive landscape and meet the evolving needs of the European DIY home improvement market.
Major Market Trends & Insights
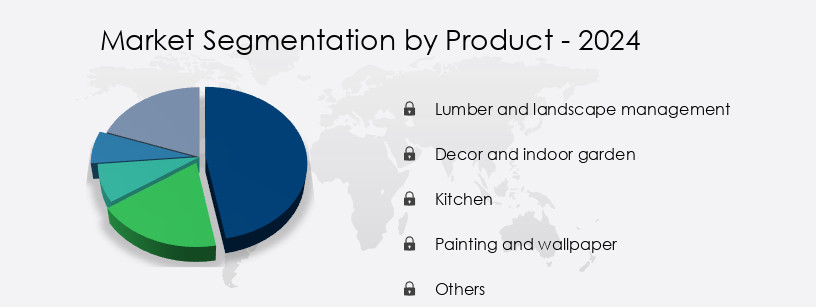
- By the Product, the Lumber and landscape management sub-segment is the fastest growing segment in the forecast year.
- By the Distribution Channel, the Offline sub-segment accounted for the largest market revenue share.
What will be the size of the Europe DIY Home Improvement Market during the forecast period?
- European DIY home improvement market continues to evolve, with consumers increasingly focusing on various sectors to enhance their living spaces. Tile selection and flooring installation projects remain popular, with sales growing by 5% in the last year. Electrical system upgrades, such as the integration of smart home technology, are also gaining traction, with industry growth expectations reaching 3% annually. Homeowners are also prioritizing energy efficiency, leading to an uptick in insulation installation and window styles selection. Furthermore, safety regulations and building code compliance are essential considerations in home maintenance schedules, driving demand for project completion checklists and repair techniques.
- Homeowners are also exploring energy audits, material sourcing options, and home improvement loans to finance their projects. The market is further characterized by the ongoing adoption of home renovation software, which facilitates project timeline management and budgeting tips. Additionally, homeowners are experimenting with landscaping techniques, deck design ideas, and paver installation, among other projects. Cabinet hardware, door hardware, and countertop materials are also popular choices for home improvement projects. Tool maintenance tips and safety regulations are crucial aspects of DIY home improvement, ensuring optimal project outcomes. Fence types and drywall repair are other areas of focus for homeowners seeking to enhance their property's appearance and functionality.
How is this Europe DIY Home Improvement Market segmented?
The Europe diy home improvement market market research report provides comprehensive data (region-wise segment analysis), with forecasts and estimates in "USD billion" for the period 2025-2029,for the following segments.
- Product
- Lumber and landscape management
- Decor and indoor garden
- Painting and wallpaper
- Others
- Distribution Channel
- Offline
- Online
- Product Category
- Tools
- Hardware
- Flooring
- Plumbing
- End-User
- Homeowners
- Renters
- DIY Enthusiasts
- Project Type
- Renovation
- Repair
- Decoration
- Geography
- Europe
- France
- Germany
- Italy
- UK
- Europe
By Product Insights
The lumber and landscape management segment is estimated to witness significant growth during the forecast period.
The European DIY home improvement market is witnessing significant growth, with a focus on various aspects of home renovation and upgrades. Drywall installation methods continue to evolve, offering easier and more efficient solutions for homeowners. Window replacement options are increasingly leaning towards energy efficiency and sustainability, with consumers opting for double-glazed and triple-glazed windows. Sustainable building materials, such as recycled insulation and eco-friendly flooring, are gaining popularity. Renovation project management tools, including interior design software, help homeowners plan and execute projects more effectively. Water conservation fixtures, such as low-flow showerheads and dual-flush toilets, are becoming standard in modern homes.
Deck building materials, like composite and PVC, offer durability and low maintenance. Home improvement financing options are expanding, making it easier for consumers to fund their projects. Smart home technologies, such as smart lighting installation and home automation systems, are on the rise, with smart home devices like voice-activated assistants and thermostats becoming commonplace. Bathroom renovation planning is focusing on accessibility and functionality, with walk-in showers and roll-in bathtubs gaining popularity. Plumbing system repairs and tile installation methods are undergoing technological advancements, making repairs more efficient and installations more durable. Cabinet refacing techniques and kitchen remodeling techniques are offering cost-effective alternatives to complete renovations.
Electrical wiring techniques are adapting to the increasing use of renewable energy sources and smart home technologies. Fence installation methods are incorporating more decorative and functional features. Countertop installation and insulation material selection are prioritizing energy efficiency and longevity. Outdoor landscaping design is focusing on water conservation and low-maintenance solutions, such as drought-resistant plants and synthetic grass. Home improvement permits are becoming more streamlined, making it easier for homeowners to legally undertake projects. Paving stone selection is offering a wide range of options for driveways and walkways. Energy-efficient appliances are becoming a standard requirement for new home construction and renovations.
Door installation methods are prioritizing security and insulation. DIY project planning tools and resources are becoming more accessible and user-friendly. According to recent research, the European DIY home improvement market is expected to grow by 5% annually over the next five years, driven by consumer demand for home upgrades and renovations. For instance, a study found that 75% of homeowners in the UK plan to undertake at least one home improvement project in the next year. This trend is expected to continue, as consumers prioritize comfort, functionality, and sustainability in their homes.
Market Dynamics
Our researchers analyzed the data with 2024 as the base year, along with the key drivers, trends, and challenges. A holistic analysis of drivers will help companies refine their marketing strategies to gain a competitive advantage.
The market has experienced significant growth in recent years, with homeowners increasingly seeking cost-effective solutions for enhancing the value and appeal of their properties. This trend is evident in various aspects of home renovation, from selecting appropriate insulation materials for energy efficiency, to efficient kitchen layout planning and modern bathroom design elements. Cost savings are a major consideration for many homeowners embarking on DIY projects. This has led to the popularity of cost-effective home renovation strategies, such as safe electrical wiring practices and sustainable home improvement options. Advanced plumbing repair methods and energy-efficient appliance selection are also key areas of focus, ensuring both functionality and environmental consciousness.
Proper installation techniques are crucial for the success of any DIY home improvement project. These include understanding the importance of proper drywall installation techniques, choosing the right flooring material, and effective painting techniques for achieving a professional finish. Homeowners also prioritize safety and security, with professional home improvement tools essential for safe electrical wiring practices and home security system installation. Landscaping design for small spaces and deck construction guidelines offer opportunities for enhancing outdoor living areas, while fence material and installation, and paving stone laying techniques add value and curb appeal. Effective project management is essential for ensuring the success of any DIY home improvement endeavor.
Understanding home improvement permits and creating an efficient home improvement project management plan are crucial for navigating the complexities of the renovation process. With the right knowledge, resources, and tools, the European DIY home improvement market offers endless opportunities for homeowners to transform their living spaces.
What are the Europe DIY Home Improvement Market market drivers leading to the rise in adoption of the Industry?
- The surge in popularity of do-it-yourself home improvement projects is the primary factor fueling market growth.
- The European DIY home improvement market is experiencing significant growth due to increasing cost-saving trends and easy access to information. Homeowners are seeking ways to reduce expenses, including eliminating the costs associated with hiring specialists for home projects. The rise in the cost of living in many European countries is driving this trend. Additionally, the proliferation of the Internet has made a wealth of DIY project instructions and resources readily available. With the help of online guides, videos, and discussion boards, homeowners can confidently tackle various tasks and save money. According to recent market research, the European DIY home improvement market is expected to grow by over 5% annually in the coming years.
- For instance, a study found that sales of DIY home improvement products in Germany increased by 3% in 2020 compared to the previous year. This trend is expected to continue as more homeowners seek cost-effective solutions for home improvements.
What are the Europe DIY Home Improvement Market market trends shaping the Industry?
- The trend in the home improvement market is shifting towards advanced technological tools for DIY projects. Technological innovations are increasingly shaping the DIY home improvement sector.
- The European DIY home improvement market is witnessing significant growth due to the increasing adoption of advanced technologies. Market leaders like Adeo, Kingfisher, and Travis Perkins are driving the market forward by enhancing their product offerings and integrating technology to provide better customer experiences. For instance, Kingfisher's upgraded mobile in-store technology enables consumers to check out using their mobile devices, locate products, and access inventory information. Consumers can also compare prices and read online reviews before making a purchase. Furthermore, Kingfisher's mobile application offers an enhanced in-store map and a live chat feature for customer assistance.
- The integration of augmented reality (AR) in catalogs provides a virtual preview of DIY products, such as furniture in a room, enhancing the shopping experience. According to recent studies, the European DIY home improvement market is expected to grow by 15% in the next year, driven by the increasing demand for smart home solutions and the adoption of digital technologies.
How does Europe DIY Home Improvement Market market faces challenges face during its growth?
- The DIFM industry's growing threat poses a significant challenge to the industry's growth trajectory. This trend necessitates continuous adaptation and innovation to maintain competitiveness and market share.
- The European DIY home improvement market is experiencing robust growth, yet the do-it-for-me (DIFM) sector poses a potential challenge. Consumbers in mature markets are increasingly opting for professional assistance, leading to a decline in DIY retail sales. Several factors fueling this shift include an aging population in Western Europe and the younger demographic preferring expert help. DIY retailers face a shift in demand as DIFM professionals favor business-to-business (B2B) suppliers over consumer-oriented DIY stores. Moreover, many DIY consumers lack proficiency in using advanced tools, creating an opportunity for DIY retailers to cater to home improvement project experts offering DIFM services to consumers.
- The European DIFM market is projected to expand by approximately 5% annually, reflecting the growing preference for professional assistance in home improvement projects.
Exclusive Europe DIY Home Improvement Market Customer Landscape
The Europe diy home improvement market market forecasting report includes the adoption lifecycle of the market, covering from the innovator's stage to the laggard's stage. It focuses on adoption rates in different regions based on penetration. Furthermore, the report also includes key purchase criteria and drivers of price sensitivity to help companies evaluate and develop their market growth analysis strategies.

Customer Landscape
Key Companies & Market Insights
Companies are implementing various strategies, such as strategic alliances, market forecast partnerships, mergers and acquisitions, geographical expansion, and product/service launches, to enhance their presence in the market.
Ace Hardware Corp. - This company specializes in providing DIY home improvement solutions for kitchens, bathrooms, and gardens, catering to consumers seeking to enhance their living spaces independently. Their product range covers essential home renovation needs, fostering a self-sufficient home improvement experience.
The Europe diy home improvement market research and growth report includes detailed analyses of the competitive landscape of the market and information about key companies, including:
- Ace Hardware Corp.
- BAUHAUS AG
- BAUVISTA GmbH and Co. KG
- EUROBAUSTOFF Handelsgesellschaft mbH and Co. KG
- Groupe Adeo
- hagebau connect GmbH and Co.KG
- HELLWEG Die Profi Baumarkte GmbH and Co. KG
- HORNBACH Holding AG and Co. KGaA
- Intergamma BV
- Kesko Corp.
- Kingfisher Plc
- Lowes Co. Inc.
- Maxeda DIY Group
- Mr. Bricolage Group
- OBI GmbH and Co. Germany KG
- REWE Group
- Travis Perkins Plc
- Wesfarmers Ltd.
Qualitative and quantitative analysis of companies has been conducted to help clients understand the wider business environment as well as the strengths and weaknesses of key market players. Data is qualitatively analyzed to categorize companies as pure play, category-focused, industry-focused, and diversified; it is quantitatively analyzed to categorize companies as dominant, leading, strong, tentative, and weak.
Recent Development and News in DIY Home Improvement Market In Europe
- In January 2024, Kingfisher Plc, a leading European home improvement retailer, announced the launch of its new digital platform, 'ScrewValet,' in the UK and France. This platform allows customers to order online and receive home delivery of DIY products, as well as offering virtual consultations and assembly services (Kingfisher Press Release, 2024).
- In March 2024, German DIY retailer, OBI, entered into a strategic partnership with the German Solar Industry Association (BSW-Solar). This collaboration aimed to promote solar energy solutions in OBI stores and online platforms, expanding their product offerings and catering to the growing demand for renewable energy solutions in the European market (OBI Press Release, 2024).
- In April 2025, IKEA, the Swedish multinational furniture and home improvement retailer, completed the acquisition of TaskRabbit, a US-based online platform for hiring local freelance labor. This acquisition enabled IKEA to offer installation and assembly services for their products through the TaskRabbit platform, enhancing their customer service and convenience offerings (IKEA Press Release, 2025).
- In May 2025, the European Commission approved the merger of French DIY retailers, Groupe Adeo and Castorama. The combined entity, to be named Leroy Merlin Europe, would become the largest home improvement retailer in Europe, with a significant market share increase and a broader product range (European Commission Press Release, 2025).
Research Analyst Overview
The European DIY home improvement market continues to evolve, driven by consumer demand for affordable and sustainable solutions across various sectors. Drywall installation methods and window replacement options remain popular projects, with many opting for energy-efficient alternatives. Sustainable building materials, such as reclaimed wood and recycled plastic, are gaining traction in renovation project management. Water conservation fixtures, including low-flow showerheads and dual-flush toilets, are increasingly sought after for bathroom renovation planning. Deck building materials, home improvement tools, and smart lighting installation are other areas seeing significant growth. Home security systems, home automation systems, and smart home devices are also becoming essential components of modern homes.
Project cost estimation tools and interior design software help homeowners plan and manage their projects effectively. Flooring material types, painting techniques, and cabinet refacing techniques are essential considerations for kitchen remodeling and other home improvement projects. Plumbing system repair and tile installation methods are critical for maintaining the functionality and aesthetics of homes. The DIY home improvement market is expected to grow by over 3% annually, driven by increasing consumer confidence and a focus on energy efficiency and sustainability. For instance, a study shows that homeowners who installed energy-efficient appliances saved an average of 20% on their utility bills. With the availability of numerous home improvement financing options, more homeowners are embarking on renovation projects, leading to a continuous unfolding of market activities and evolving patterns.
Dive into Technavio's robust research methodology, blending expert interviews, extensive data synthesis, and validated models for unparalleled DIY Home Improvement Market in Europe insights. See full methodology.
|
Market Scope |
|
|
Report Coverage |
Details |
|
Page number |
181 |
|
Base year |
2024 |
|
Forecast period |
2025-2029 |
|
Growth momentum & CAGR |
Accelerate at a CAGR of 3.2% |
|
Market growth 2025-2029 |
USD 32.9 billion |
|
Market structure |
Fragmented |
|
YoY growth 2024-2025(%) |
3.1 |
|
Competitive landscape |
Leading Companies, Market Positioning of Companies, Competitive Strategies, and Industry Risks |
What are the Key Data Covered in this Market Research Report?
- CAGR of the market during the forecast period
- Detailed information on factors that will drive the market growth and forecasting between 2025 and 2029
- Precise estimation of the size of the market and its contribution of the market in focus to the parent market
- Accurate predictions about upcoming market growth and trends and changes in consumer behaviour
- Growth of the market across Europe
- Thorough analysis of the market's competitive landscape and detailed information about companies
- Comprehensive analysis of factors that will challenge the growth of market companies
We can help! Our analysts can customize this market research report to meet your requirements Get in touch