
Document Outsourcing Market Size 2025-2029
The document outsourcing market size is forecast to increase by USD 19.5 billion at a CAGR of 5.7% between 2024 and 2029.
- The market is experiencing significant growth due to the increasing need for cost reduction and enhanced efficiency in business operations. Companies are turning to document outsourcing services to streamline their processes and focus on core competencies. Additionally, regulatory compliance requirements are driving the adoption of document outsourcing solutions to ensure data security and adherence to industry standards. However, the market faces challenges, primarily in the areas of data security and regulatory compliance. With the shift towards cloud sourcing, ensuring data security becomes paramount. Companies must implement robust security measures to protect sensitive information from cyber threats. Regulatory hurdles also impact adoption, as organizations grapple with complex compliance requirements across various industries and jurisdictions.
- Supply chain inconsistencies can temper growth potential, as businesses seek reliable and consistent service delivery from their outsourcing partners. To capitalize on market opportunities and navigate challenges effectively, companies must prioritize data security, regulatory compliance, and supply chain management in their outsourcing strategies.
What will be the Size of the Document Outsourcing Market during the forecast period?

- The market is experiencing significant transformation as businesses increasingly leverage technology to streamline operations and enhance productivity. Big data is playing a pivotal role in this evolution, enabling organizations to derive valuable insights from their unstructured data through intelligent document processing and data analytics. Service level agreements (SLAs) are a critical aspect of document outsourcing, ensuring quality and performance in supply chain management. Key performance indicators (KPIs) are used to measure success, with return on investment (ROI) being a key metric. Edge computing and hybrid cloud solutions are gaining traction, allowing for real-time data processing and analysis, while paperless offices and digital transformation initiatives continue to drive the demand for document outsourcing services.
- Process mining and business intelligence are essential tools for optimizing operations and improving business continuity. Compliance management and risk management are also top priorities, with predictive analytics and robotic process automation helping to mitigate risks and ensure regulatory compliance. Data governance and quality assurance are crucial components of document outsourcing, with data visualization and performance metrics used to monitor and improve processes. Customer relationship management and knowledge discovery are also important areas of focus, as organizations seek to gain a competitive edge through data-driven insights. Cloud migration and business intelligence are key trends, with organizations looking to leverage the power of the cloud to improve their document outsourcing capabilities and enhance their overall digital strategy.
- Overall, the market is dynamic and evolving, with a focus on innovation, efficiency, and data-driven insights.
How is this Document Outsourcing Industry segmented?
The document outsourcing industry research report provides comprehensive data (region-wise segment analysis), with forecasts and estimates in "USD billion" for the period 2025-2029, as well as historical data from 2019-2023 for the following segments.
- Service
- Onsite contracted
- Statement printing
- DPO
- End-user
- Large companies
- Small and medium companies
- Application
- Healthcare
- IT
- Retail
- Media
- Others
- Geography
- North America
- US
- Canada
- Europe
- France
- Germany
- Italy
- The Netherlands
- UK
- APAC
- China
- India
- Japan
- Rest of World (ROW)
- North America
By Service Insights
The onsite contracted segment is estimated to witness significant growth during the forecast period.
In the market, onsite contracted services have emerged as a popular solution for businesses seeking advanced document management systems. Service providers offer onsite technology implementation and services for document conversion, assessment, and consulting, tailored to meet specific client requirements. The evaluation of a company's IT architecture leads to the implementation of document management solutions suitable for their industry vertical, business size, and competitive landscape. To cater to the growing demand for business process automation and data-driven decision-making, document outsourcing providers expand their service offerings. These on-site document management systems enable companies to efficiently process financial documents, extract data for sales and marketing purposes, and ensure data security through compliance regulations.
Additionally, these solutions offer mobility, enabling remote work, and facilitate the digitization of healthcare and insurance documents, among others. Artificial intelligence, machine learning, and natural language processing technologies are integrated into these systems to optimize processes, automate workflows, and improve knowledge management. Moreover, cloud-based services ensure data privacy, record management, and document collaboration, while ensuring cost reduction and efficient document processing. The market continues to evolve, with data center outsourcing, contract lifecycle management, and accounts receivable processing becoming increasingly important. Overall, onsite contracted services in document outsourcing offer businesses a robust and adaptable solution for managing their document processes.
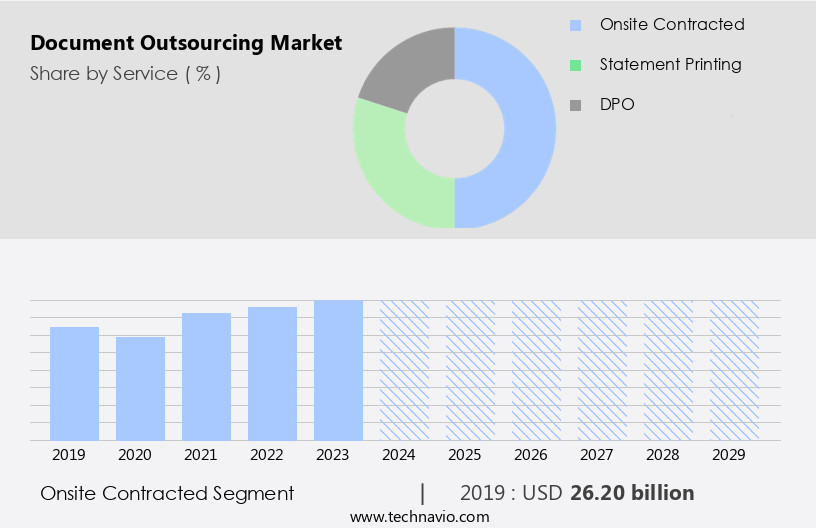
The Onsite contracted segment was valued at USD 26.20 billion in 2019 and showed a gradual increase during the forecast period.
Regional Analysis
Europe is estimated to contribute 37% to the growth of the global market during the forecast period.Technavio’s analysts have elaborately explained the regional trends and drivers that shape the market during the forecast period.

The US market holds a significant share in the North American document outsourcing industry. With one of the highest corporate income taxes in the world, US businesses seek cost savings by outsourcing operations to countries with more favorable tax environments, such as India. Despite this, the US market is projected to grow moderately during the forecast period, reflecting its maturity compared to other regions. Advanced technologies like cloud computing, artificial intelligence (AI), and robotic process automation (RPA) are increasingly adopted by companies in this market. These technologies enable them to enhance their offerings, ensuring better customer service and increased efficiency.
Areas of focus include financial document processing, data extraction, and information management. Additionally, there is a growing trend towards digital archiving, electronic records management, and compliance regulations. The market also caters to various industries, such as healthcare, insurance, and legal services, requiring document processing and contract lifecycle management. Furthermore, sales and marketing, invoice processing, accounts receivable, and accounts payable are other key areas of outsourcing. Document collaboration, data entry, and customer service are also critical functions that are outsourced. Remote work is increasingly becoming a norm in the industry, allowing for greater flexibility and cost savings. Overall, the market in the US is evolving, with a focus on advanced technologies, cost savings, and improved customer service.
Market Dynamics
Our researchers analyzed the data with 2024 as the base year, along with the key drivers, trends, and challenges. A holistic analysis of drivers will help companies refine their marketing strategies to gain a competitive advantage.
What are the Document Outsourcing market drivers leading to the rise in the adoption of Industry?
- The primary motivating factors in the market include the necessity for cost reduction, increased efficiency, and adherence to regulatory compliance.
- Document outsourcing has emerged as a popular solution for businesses seeking to streamline their document management processes while reducing costs and mitigating risks. By outsourcing tasks such as financial document processing, data extraction, and optical character recognition, organizations can improve efficiency and focus on their core competencies. Back office outsourcing providers offer advanced technologies like digital archiving and document management systems, ensuring secure data handling and easy mobile access. Outsourcing these services allows businesses to avoid the expenses and complexities of developing and maintaining in-house document management solutions.
- The outsourcing market encompasses various services, including data capture and information management, catering to industries that operate in multiple business domains. Outsourcing document management services not only reduces operational costs but also minimizes the risks of in-house solution failure, ultimately enhancing overall business productivity.
What are the Document Outsourcing market trends shaping the Industry?
- The increasing preference for cloud sourcing is a notable market trend. This shift towards cloud-based solutions reflects the growing demand for flexible, scalable, and cost-effective IT infrastructure.
- Cloud sourcing, the fusion of outsourcing services with cloud computing technology, is gaining traction among businesses for streamlining their operations. Companies are increasingly outsourcing the deployment and maintenance of specialized cloud products and services to cloud service providers, leading to a surge in IT spending. This trend is particularly popular among small and medium-sized businesses (SMBs) seeking cost-effective document management solutions in the cloud. Document processing, including insurance document processing and healthcare document processing, is a significant application of cloud sourcing. Cloud platforms and online data centers are essential for document digitization, electronic records management, document retrieval, and workflow automation.
- Artificial intelligence and image processing technologies further enhance the efficiency of these processes. Contract lifecycle management and accounts receivable are other business functions that benefit from cloud sourcing. By outsourcing these tasks, businesses can reduce costs, improve accuracy, and focus on their core competencies. The integration of cloud sourcing with business processes is expected to continue driving market growth during the forecast period.
How does Document Outsourcing market faces challenges face during its growth?
- Outsourcing data security is a significant challenge that can hinder industry growth due to the potential risks and vulnerabilities associated with transferring sensitive information to third parties. It is crucial for organizations to implement robust security measures and establish clear protocols to mitigate these risks and ensure the confidentiality, integrity, and availability of their data.
- Document outsourcing, a subset of business process outsourcing, involves the transfer of document conversion, data entry, customer service, legal document processing, and knowledge management tasks to third-party service providers. While outsourcing offers benefits such as cost savings, process optimization, and access to specialized skills, it also presents challenges, particularly in maintaining data security and regulatory compliance. Outsourcing companies handle vast amounts of data from multiple clients, necessitating robust security measures and adherence to strict regulations. Failure to secure documents can result in legal repercussions and damage to a company's reputation. Data centers must employ advanced encryption methods, access controls, and other security features to protect sensitive information.
- Enterprise content management and cloud-based services have gained popularity in document outsourcing due to their ability to provide secure, centralized storage and easy access to documents. Compliance regulations, such as HIPAA, SOX, and GDPR, require strict adherence to data security and privacy standards. Document collaboration tools facilitate seamless collaboration between teams and ensure data accuracy and consistency. In conclusion, document outsourcing offers numerous benefits, but it requires outsourcing companies to prioritize data security and regulatory compliance. Effective security measures, adherence to regulations, and the use of advanced technologies are essential to mitigate risks and maintain client trust.
Exclusive Customer Landscape
The document outsourcing market forecasting report includes the adoption lifecycle of the market, covering from the innovator’s stage to the laggard’s stage. It focuses on adoption rates in different regions based on penetration. Furthermore, the document outsourcing market report also includes key purchase criteria and drivers of price sensitivity to help companies evaluate and develop their market growth analysis strategies.

Customer Landscape
Key Companies & Market Insights
Companies are implementing various strategies, such as strategic alliances, document outsourcing market forecast, partnerships, mergers and acquisitions, geographical expansion, and product/service launches, to enhance their presence in the industry.
ABBYY Solutions Ltd. - This company specializes in document outsourcing solutions, focusing on intelligent document processing automation to streamline business operations. By leveraging advanced technologies, we efficiently extract data from various document types, ensuring accuracy and reducing manual labor. Our services enable clients to focus on core business functions while we manage document processing tasks effectively and efficiently. This approach not only enhances productivity but also minimizes errors and improves overall business agility.
The industry research and growth report includes detailed analyses of the competitive landscape of the market and information about key companies, including:
- ABBYY Solutions Ltd.
- Accenture PLC
- Adreno Technologies India Pvt. Ltd.
- Canon Inc.
- Compart AG
- FUJIFILM Holdings Corp.
- HP Inc.
- Imaging Business Machines LLC
- Invensis Technologies Pvt. Ltd.
- Iron Mountain Inc.
- Konica Minolta Inc.
- Lexmark International Inc.
- Pitney Bowes Inc.
- Ricoh Co. Ltd.
- Seiko Epson Corp.
- Siemens AG
- Swiss Post Ltd.
- Toshiba Tec Corp.
- Williams Lea Ltd.
- Xerox Holdings Corp.
Qualitative and quantitative analysis of companies has been conducted to help clients understand the wider business environment as well as the strengths and weaknesses of key industry players. Data is qualitatively analyzed to categorize companies as pure play, category-focused, industry-focused, and diversified; it is quantitatively analyzed to categorize companies as dominant, leading, strong, tentative, and weak.
Recent Development and News in Document Outsourcing Market
- In February 2024, Xerox Corporation, a leading document technology solutions provider, announced the launch of its new Document Outsourcing Services, which include document scanning, data capture, and business process automation solutions (Xerox Press Release, 2024). This expansion aimed to cater to the growing demand for digital transformation and automation in various industries.
- In June 2025, IBM and Kofax, a leading provider of Intelligent Automation software and solutions, formed a strategic partnership to offer integrated Document Outsourcing services, combining IBM's cloud capabilities and Kofax's automation expertise (IBM Press Release, 2025). This collaboration aimed to deliver end-to-end document processing solutions for businesses, enhancing efficiency and accuracy.
- In October 2024, Kodak Alaris, a leading document imaging solutions provider, completed the acquisition of Software Intelligence Group, a document capture software company, for approximately USD220 million (Business Wire, 2024). This acquisition strengthened Kodak Alaris's position in the market by expanding its software offerings and enhancing its capabilities in data capture and information extraction.
- In March 2025, the European Union's General Data Protection Regulation (GDPR) came into effect, imposing stringent rules on the handling and processing of personal data (European Commission, 2016). This regulation significantly impacted the market, as businesses were required to ensure their outsourcing partners adhered to these regulations to maintain data security and privacy. This led to increased demand for secure document processing and storage solutions.
Research Analyst Overview
The market continues to evolve, driven by the ever-increasing demand for efficient and cost-effective information management solutions. This dynamic market encompasses various applications, including financial document processing, sales and marketing support, and back office operations. Key areas of focus include data security, data extraction, and digital archiving. Insurance document processing, contract lifecycle management, and accounts receivable are critical sectors that leverage document processing and digitization to streamline operations and enhance efficiency gains. Electronic records management and cost reduction are also significant drivers, with artificial intelligence, image processing, and healthcare document processing playing essential roles. Moreover, the market's continuous evolution is marked by the adoption of advanced technologies such as workflow automation, data center outsourcing, and cloud-based services.
Compliance regulations, knowledge management, and process optimization are also crucial factors shaping the market's trajectory. The integration of data privacy, record management, document indexing, metadata management, invoice processing, and accounts payable further underscores the market's ongoing development. Regulatory requirements, natural language processing, document sharing, machine learning, remote work, and document collaboration are additional facets that contribute to the market's complexity and growth.
Dive into Technavio’s robust research methodology, blending expert interviews, extensive data synthesis, and validated models for unparalleled Document Outsourcing Market insights. See full methodology.
|
Market Scope |
|
|
Report Coverage |
Details |
|
Page number |
231 |
|
Base year |
2024 |
|
Historic period |
2019-2023 |
|
Forecast period |
2025-2029 |
|
Growth momentum & CAGR |
Accelerate at a CAGR of 5.7% |
|
Market growth 2025-2029 |
USD 19.5 billion |
|
Market structure |
Fragmented |
|
YoY growth 2024-2025(%) |
5.2 |
|
Key countries |
US, Canada, UK, Germany, China, France, Italy, The Netherlands, Japan, and India |
|
Competitive landscape |
Leading Companies, Market Positioning of Companies, Competitive Strategies, and Industry Risks |
What are the Key Data Covered in this Document Outsourcing Market Research and Growth Report?
- CAGR of the Document Outsourcing industry during the forecast period
- Detailed information on factors that will drive the growth and forecasting between 2025 and 2029
- Precise estimation of the size of the market and its contribution of the industry in focus to the parent market
- Accurate predictions about upcoming growth and trends and changes in consumer behaviour
- Growth of the market across North America, Europe, APAC, South America, and Middle East and Africa
- Thorough analysis of the market’s competitive landscape and detailed information about companies
- Comprehensive analysis of factors that will challenge the document outsourcing market growth of industry companies
We can help! Our analysts can customize this document outsourcing market research report to meet your requirements.