Drone Market Size 2026-2030
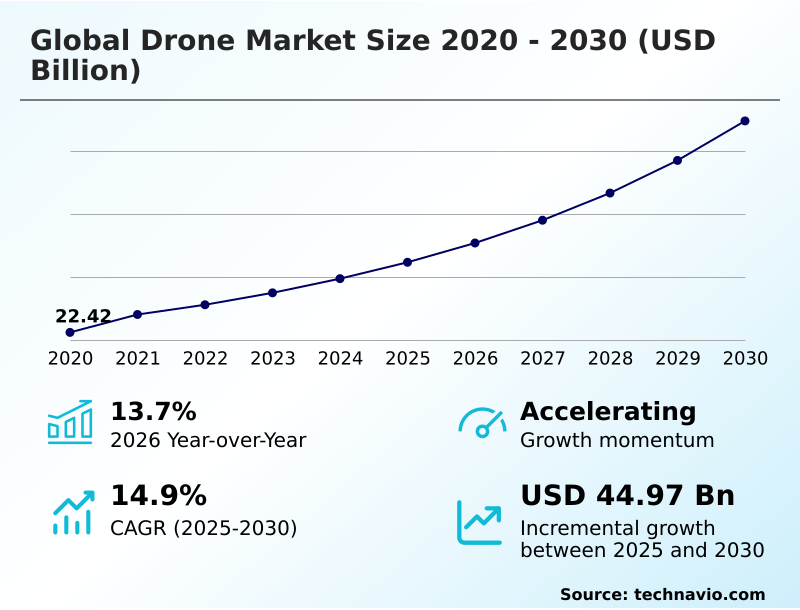
The drone market size is valued to increase by USD 44.97 billion, at a CAGR of 14.9% from 2025 to 2030. Advancement of autonomous navigation and AI integration will drive the drone market.
Major Market Trends & Insights
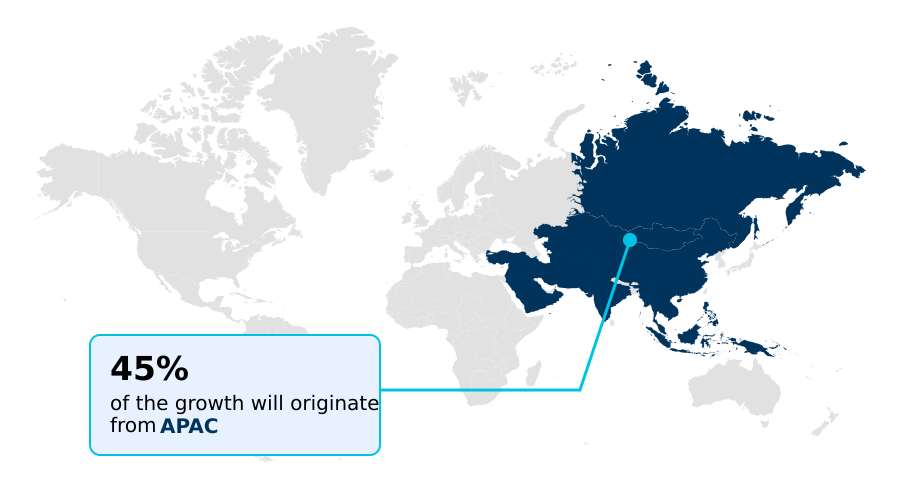
- APAC dominated the market and accounted for a 45.2% growth during the forecast period.
- By Application - Industrial segment was valued at USD 11.45 billion in 2024
- By Type - Rotary blade segment accounted for the largest market revenue share in 2024
Market Size & Forecast
- Market Opportunities: USD 67.27 billion
- Market Future Opportunities: USD 44.97 billion
- CAGR from 2025 to 2030 : 14.9%
Market Summary
- The drone market is undergoing a significant transformation, evolving from remotely piloted tools to intelligent assets capable of autonomous operation. This shift is driven by advancements in autonomous navigation and AI integration, which enable unmanned aerial vehicles to perform complex tasks with minimal human intervention.
- Key trends include the use of drone-in-a-box technology for persistent aerial monitoring and the development of hydrogen fuel cells to achieve extended flight endurance.
- For example, in a large-scale agricultural operation, a fleet of drones equipped with multispectral sensors can autonomously monitor crop health, identify pest infestations, and execute targeted spraying, which optimizes resource use and improves yields by over 15%. This data-driven decision-making is also revolutionizing critical infrastructure inspection. However, the industry faces challenges related to regulatory fragmentation and cybersecurity vulnerabilities.
- The lack of harmonized international rules for beyond visual line of sight flights and the risk of data breaches on high-speed data transmission networks constrain the scalability of commercial services. Addressing these issues through standardized protocols and robust end-to-end encryption is essential for realizing the full potential of autonomous flight technology and unmanned systems integration.
- The technology's evolution is also marked by the adoption of light detection and ranging for precise three-dimensional modeling.
What will be the Size of the Drone Market during the forecast period?
Get Key Insights on Market Forecast (PDF) Get Free Sample
How is the Drone Market Segmented?
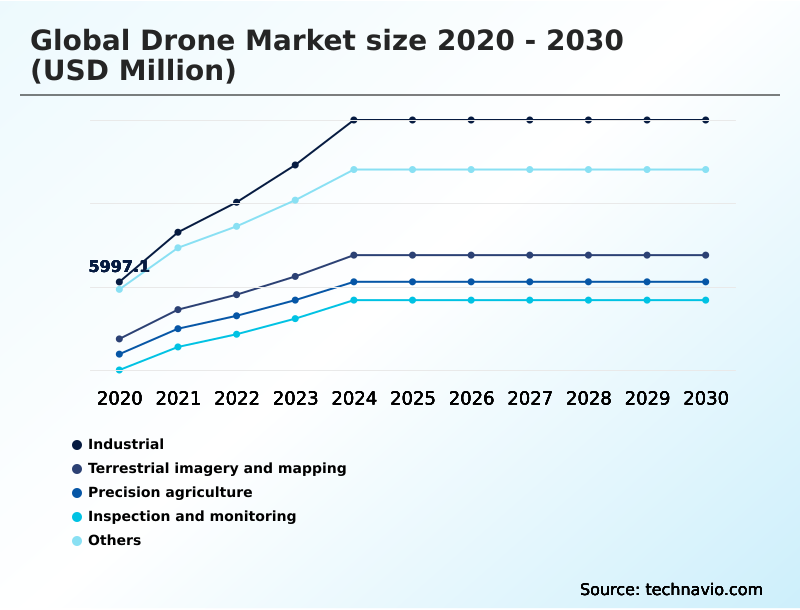
The drone industry research report provides comprehensive data (region-wise segment analysis), with forecasts and estimates in "USD million" for the period 2026-2030, as well as historical data from 2020-2024 for the following segments.
- Application
- Industrial
- Terrestrial imagery and mapping
- Precision agriculture
- Inspection and monitoring
- Others
- Type
- Rotary blade
- Fixed wing
- Hybrid
- Technology
- Remotely piloted
- Optionally piloted
- Fully autonomous
- Geography
- APAC
- China
- Japan
- India
- North America
- US
- Canada
- Mexico
- Europe
- Germany
- UK
- France
- Middle East and Africa
- Saudi Arabia
- UAE
- South Africa
- South America
- Brazil
- Argentina
- Rest of World (ROW)
- APAC
By Application Insights
The industrial segment is estimated to witness significant growth during the forecast period.
The industrial segment is driven by the modernization of heavy industries through the automation of logistics and project management. Industrial UAS platforms are integrated into daily operations for geospatial data collection and automated data collection at construction and mining sites.
This shift toward creating a digital twin of the physical environment reduces operational costs and enhances site safety. AI-enabled software facilitates three-dimensional modeling for predictive maintenance, improving asset uptime by over 20%.
The use of autonomous aerial vehicles with enhanced payload capacity enhancement for uncrewed heavy-lift capabilities and advanced drone control technologies with onboard processing systems for critical infrastructure inspection is becoming standard practice, ensuring data-rich environments for optimized supply chain performance.
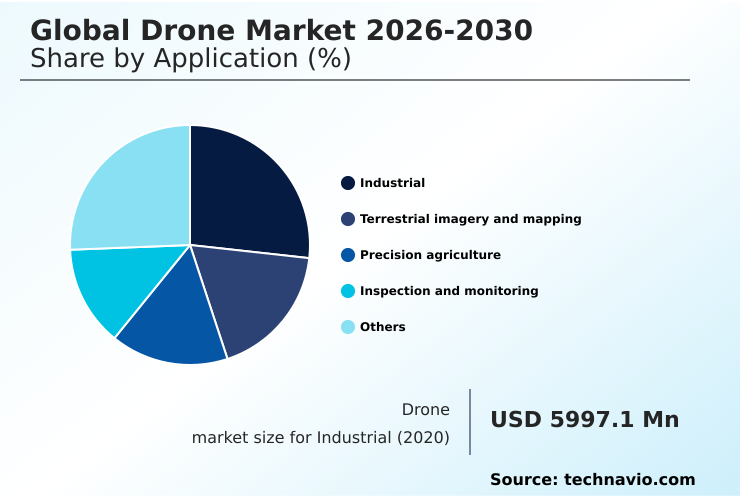
The Industrial segment was valued at USD 11.45 billion in 2024 and showed a gradual increase during the forecast period.
Regional Analysis
APAC is estimated to contribute 45.2% to the growth of the global market during the forecast period.Technavio’s analysts have elaborately explained the regional trends and drivers that shape the market during the forecast period.
See How Drone Market Demand is Rising in APAC Get Free Sample
The geographic landscape of the drone market is diverse, with regional strengths defining market dynamics. APAC leads global expansion, accounting for over 45% of incremental growth, driven by high-volume manufacturing and agricultural modernization.
This region excels in producing commercial UAV platforms and is a hub for advanced sensor manufacturing.
In contrast, North America focuses on high-end defense applications for tactical unmanned systems and pioneering research into urban air mobility and unmanned traffic management, contributing to 33.4% of market growth.
Europe emphasizes sustainable applications and strict data privacy, driving innovation in electric-powered rotary blade drone and fixed-wing UAV designs for renewable energy inspection.
Development in drone surveillance systems and passenger drones is accelerating globally, supported by remote sensing technology and cloud-based fleet management solutions that enable more complex and autonomous operations across all regions.
Market Dynamics
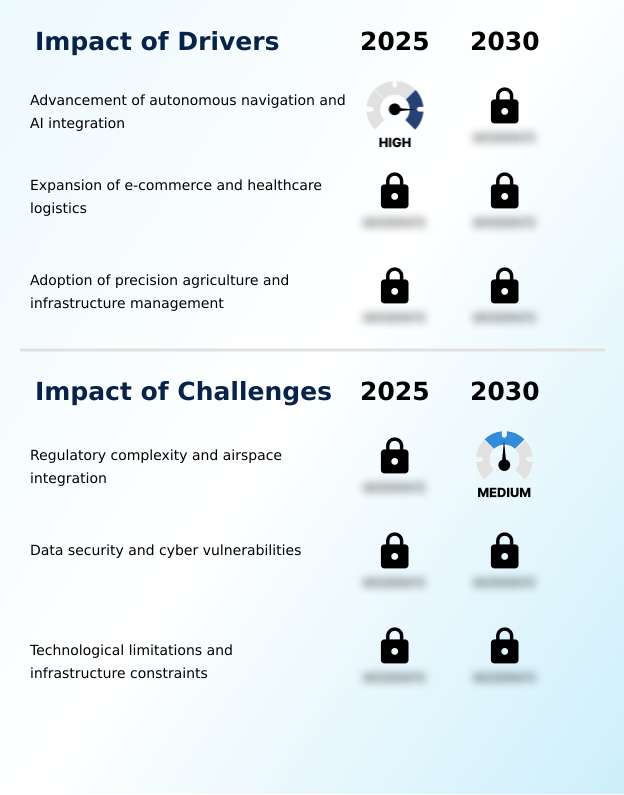
Our researchers analyzed the data with 2025 as the base year, along with the key drivers, trends, and challenges. A holistic analysis of drivers will help companies refine their marketing strategies to gain a competitive advantage.
- The strategic application of unmanned systems is expanding, with specific use cases defining the Global Drone Market 2026-2030 for industrial inspection and the Global Drone Market 2026-2030 for precision agriculture. In asset management, firms leveraging the Global Drone Market 2026-2030 for asset management achieve asset uptime rates more than double those relying on manual methods, demonstrating clear ROI.
- The use of the Global Drone Market 2026-2030 using LiDAR technology is crucial for the Global Drone Market 2026-2030 for terrestrial mapping, providing unparalleled accuracy. Meanwhile, the Global Drone Market 2026-2030 in logistics is being reshaped by automated delivery systems, supported by the Global Drone Market 2026-2030 with 5G connectivity for real-time tracking.
- Security applications, including the Global Drone Market 2026-2030 for surveillance and the Global Drone Market 2026-2030 for public safety, benefit from the Global Drone Market 2026-2030 with AI-powered analytics to identify threats faster.
- The Global Drone Market 2026-2030 beyond visual line of sight operations is becoming a reality, enabled by robust Global Drone Market 2026-2030 cybersecurity solutions and data security protocols.
- Innovations in hardware are also critical, such as the Global Drone Market 2026-2030 with hybrid propulsion for extended range and the Global Drone Market 2026-2030 using multispectral sensors for the Global Drone Market 2026-2030 for environmental monitoring.
- The future includes the Global Drone Market 2026-2030 in urban air mobility, while technologies like the Global Drone Market 2026-2030 with drone-in-a-box solutions and the Global Drone Market 2026-2030 and edge computing promise full operational autonomy.
What are the key market drivers leading to the rise in the adoption of Drone Industry?
- The advancement of autonomous navigation and the deep integration of artificial intelligence are primary drivers fueling market expansion.
- Market growth is primarily driven by the integration of artificial intelligence and advanced sensors that enable data-driven decision-making.
- The evolution of autonomous navigation and autonomous flight technology in AI-powered autonomous drones allows for unmanned systems integration into complex workflows, improving efficiency by over 40%.
- In agriculture, precision agriculture drone platforms equipped with multispectral sensors enable targeted resource application, boosting crop yields by up to 20%.
- Similarly, the use of light detection and ranging creates highly accurate orthomosaic maps for infrastructure projects, while AI-enabled software facilitates predictive maintenance.
- The expansion of e-commerce is fueling demand for last-mile delivery solutions, where real-time data processing is critical for navigating urban environments safely and efficiently.
What are the market trends shaping the Drone Industry?
- The integration of ultra-low latency connectivity with edge computing capabilities represents a significant market trend. This allows for real-time data processing and high-definition video streaming crucial for complex missions.
- Market trends are centered on achieving full autonomy and extended operational uptime. The rise of drone-in-a-box technology enables persistent aerial monitoring of critical sites, reducing the need for on-site pilots by 100% and increasing data collection frequency.
- Simultaneously, the pursuit of extended flight endurance is driving the adoption of hydrogen fuel cells and hybrid-electric propulsion, which can increase operational duration by over 300% compared to conventional batteries. Innovations in edge computing and computer vision facilitate real-time, AI-enabled navigation and high-definition video streaming with low-latency communication.
- This allows for complex applications such as synchronized swarm technology for large-scale mapping with photogrammetry software. High-altitude platforms are also being developed as atmospheric satellites for continuous regional coverage.
What challenges does the Drone Industry face during its growth?
- The complexity of international regulations and the difficulty of integrating unmanned systems into existing manned airspace pose a key challenge to industry growth.
- Significant market challenges stem from regulatory fragmentation and technological limitations. The lack of harmonized international rules for beyond visual line of sight operations creates compliance hurdles that can increase project deployment times by over 50%. The absence of universal standards for remote identification technologies and detect-and-avoid systems further complicates unmanned traffic management.
- Cybersecurity for unmanned systems is a critical concern, as high-speed data transmission links are vulnerable; implementing end-to-end encryption is essential but adds to system complexity. Technical constraints, such as limited payload capacity and battery life, also hinder performance.
- While fly-by-wire technology improves flight control systems, developing effective counter-drone technology and secure autonomous docking systems remains a focus for ensuring safe and reliable large-scale deployment.
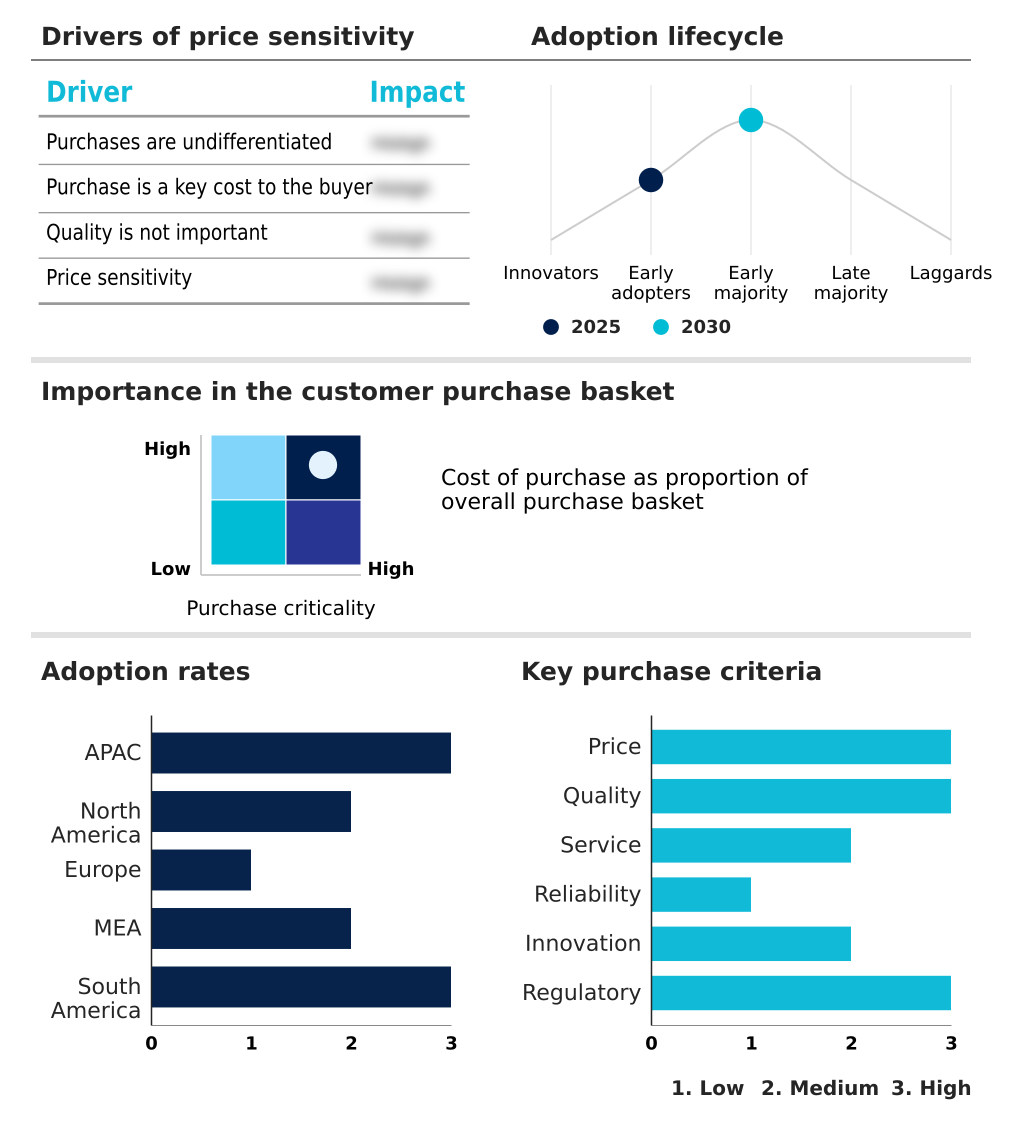
Exclusive Technavio Analysis on Customer Landscape
The drone market forecasting report includes the adoption lifecycle of the market, covering from the innovator’s stage to the laggard’s stage. It focuses on adoption rates in different regions based on penetration. Furthermore, the drone market report also includes key purchase criteria and drivers of price sensitivity to help companies evaluate and develop their market growth analysis strategies.
Customer Landscape of Drone Industry
Competitive Landscape
Companies are implementing various strategies, such as strategic alliances, drone market forecast, partnerships, mergers and acquisitions, geographical expansion, and product/service launches, to enhance their presence in the industry.
AeroVironment Inc. - Specializes in tactical unmanned systems for reconnaissance and surveillance, providing critical operational intelligence for defense applications.
The industry research and growth report includes detailed analyses of the competitive landscape of the market and information about key companies, including:
- AeroVironment Inc.
- Airbus SE
- Autel Robotics Co. Ltd.
- EHang Holdings Ltd.
- Elbit Systems Ltd.
- General Atomics Inc.
- Guangzhou XAG Co. Ltd.
- Insitu Inc.
- Leonardo S.p.A.
- Lockheed Martin Corp.
- Northrop Grumman Corp.
- Parrot Drones SAS
- Saab AB
- Skydio Inc.
- SZ DJI Technology Co. Ltd.
- Textron Systems Corp.
- Thales Group
- Wing Aviation LLC
- Yuneec International Co. Ltd.
- Zipline International Inc.
Qualitative and quantitative analysis of companies has been conducted to help clients understand the wider business environment as well as the strengths and weaknesses of key industry players. Data is qualitatively analyzed to categorize companies as pure play, category-focused, industry-focused, and diversified; it is quantitatively analyzed to categorize companies as dominant, leading, strong, tentative, and weak.
Recent Development and News in Drone market
- In May 2025, Skydio launched a proprietary software engine enabling drones to navigate complex indoor environments without relying on GPS signals, representing a significant milestone for industrial inspection and security.
- In February 2025, Intel Corporation finalized the development of a high-speed processing chip designed for unmanned systems that allows for localized decision-making during high-bandwidth transmissions, reducing reliance on external servers.
- In April 2025, Zipline, in partnership with Walmart, began commercial drone delivery operations in the Dallas-Fort Worth metroplex, utilizing its Platform 2 autonomous drone system for rapid consumer deliveries.
- In April 2025, AeroVironment Inc. successfully flight-tested a new generation of hydrogen fuel cells that extended the operational duration of light aircraft by more than 300 percent, demonstrating a clear path for long-endurance missions.
Dive into Technavio’s robust research methodology, blending expert interviews, extensive data synthesis, and validated models for unparalleled Drone Market insights. See full methodology.
| Market Scope | |
|---|---|
| Page number | 309 |
| Base year | 2025 |
| Historic period | 2020-2024 |
| Forecast period | 2026-2030 |
| Growth momentum & CAGR | Accelerate at a CAGR of 14.9% |
| Market growth 2026-2030 | USD 44969.5 million |
| Market structure | Fragmented |
| YoY growth 2025-2026(%) | 13.7% |
| Key countries | China, Japan, India, South Korea, Australia, Indonesia, US, Canada, Mexico, Germany, UK, France, Italy, Spain, The Netherlands, Saudi Arabia, UAE, South Africa, Israel, Turkey, Brazil, Argentina and Chile |
| Competitive landscape | Leading Companies, Market Positioning of Companies, Competitive Strategies, and Industry Risks |
Research Analyst Overview
- The drone market is defined by the rapid evolution of unmanned systems from simple aerial cameras to sophisticated, AI-powered autonomous drones. Key technologies such as autonomous navigation and computer vision are enabling beyond visual line of sight operations, a critical capability for industries like logistics and energy.
- The integration of light detection and ranging and multispectral sensors allows for precise three-dimensional modeling and geospatial data collection, providing actionable intelligence for predictive maintenance and resource management. This trend toward automated data collection directly impacts boardroom decisions on capital expenditure, as investments in drone-in-a-box technology and autonomous aerial vehicles can reduce manual inspection costs by over 60%.
- However, this shift necessitates a focus on end-to-end encryption and robust detect-and-avoid systems to ensure operational safety and data security. The development of hydrogen fuel cells and hybrid-electric propulsion is also extending mission endurance, opening new commercial applications for fixed-wing UAVs and vertical takeoff and landing platforms.
What are the Key Data Covered in this Drone Market Research and Growth Report?
-
What is the expected growth of the Drone Market between 2026 and 2030?
-
USD 44.97 billion, at a CAGR of 14.9%
-
-
What segmentation does the market report cover?
-
The report is segmented by Application (Industrial, Terrestrial imagery and mapping, Precision agriculture, Inspection and monitoring, and Others), Type (Rotary blade, Fixed wing, and Hybrid), Technology (Remotely piloted, Optionally piloted, and Fully autonomous) and Geography (APAC, North America, Europe, Middle East and Africa, South America)
-
-
Which regions are analyzed in the report?
-
APAC, North America, Europe, Middle East and Africa and South America
-
-
What are the key growth drivers and market challenges?
-
Advancement of autonomous navigation and AI integration, Regulatory complexity and airspace integration
-
-
Who are the major players in the Drone Market?
-
AeroVironment Inc., Airbus SE, Autel Robotics Co. Ltd., EHang Holdings Ltd., Elbit Systems Ltd., General Atomics Inc., Guangzhou XAG Co. Ltd., Insitu Inc., Leonardo S.p.A., Lockheed Martin Corp., Northrop Grumman Corp., Parrot Drones SAS, Saab AB, Skydio Inc., SZ DJI Technology Co. Ltd., Textron Systems Corp., Thales Group, Wing Aviation LLC, Yuneec International Co. Ltd. and Zipline International Inc.
-
Market Research Insights
- The market's dynamism is driven by the convergence of autonomous flight technology and advanced data analytics. Unmanned systems integration into enterprise workflows is delivering tangible results, with companies reporting up to a 75% reduction in inspection times for critical infrastructure.
- The demand for last-mile delivery solutions is fueling innovation in urban air mobility, while real-time data processing capabilities are essential for effective high-speed data transmission. Aerial data analytics now provides insights that were previously unattainable, improving forecast accuracy in agriculture by over 20%.
- As a result, the development of robust cybersecurity for unmanned systems and comprehensive unmanned traffic management frameworks is a top priority, ensuring safe and secure operations as adoption scales. These advancements solidify the role of drones as indispensable tools for data-driven decision-making.
We can help! Our analysts can customize this drone market research report to meet your requirements.
 RIA -
RIA - 
