Dunnage Packaging Market Size 2024-2028
The dunnage packaging market size is forecast to increase by USD 980.1 million at a CAGR of 5.32% between 2023 and 2028.
- The market is experiencing significant growth due to the surge in e-commerce sales and increasing international trade. The use of protective packaging, including plastic, steel, aluminum, polypropylene, and polyethylene, is on the rise to ensure safe transportation of goods.
- The market is also influenced by fluctuations in raw material costs, such as lubricants and returnable packaging, which impact the overall pricing structure. In addition, industries like FMCG, personal care, automotive, construction, and glass are major consumers of dunnage packaging. The trend towards automation in logistics is also driving the demand for advanced dunnage packaging solutions. Rubber and other protective materials are also used In the market to cater to specific industry requirements.
- Overall, the market is expected to continue its growth trajectory In the coming years.
What will be the Size of the Dunnage Packaging Market During the Forecast Period?
- The market encompasses various materials, including corrugated plastic, molded plastic, foam, steel, and aluminum, used to protect and stabilize goods during transportation. This market is driven by the surge in e-commerce and online shopping, necessitating secure and efficient packaging solutions. Sustainable practices are increasingly influencing market trends, with a focus on recyclable and biodegradable materials such as corrugated plastic-based products made from polypropylene (PP) and polyethylene (PE).
- The Reusable Packaging Industry, including returnable molded plastic packaging, is gaining traction due to cost savings and environmental benefits. The market is capital-intensive, with the Corrugated Plastic Segment leading in terms of market share.
- Foam-based Dunnage Packaging, particularly Expanded Polyethylene, remains a significant player due to its protective capabilities. Industries such as Automotive and Electronics continue to be major consumers due to the unique requirements of their products. Logistics networks play a crucial role in market growth, ensuring timely and secure delivery of goods.
How is this Dunnage Packaging Industry segmented and which is the largest segment?
The dunnage packaging industry research report provides comprehensive data (region-wise segment analysis), with forecasts and estimates in "USD million" for the period 2024-2028, as well as historical data from 2018-2022 for the following segments.
- Material
- Plastic
- Paper
- Foam
- Wood
- Others
- Application
- Automotive
- Food and beverage
- Electronics
- Consumer goods
- Others
- Geography
- APAC
- China
- India
- Japan
- North America
- US
- Europe
- Germany
- UK
- Middle East and Africa
- South America
- APAC
By Material Insights
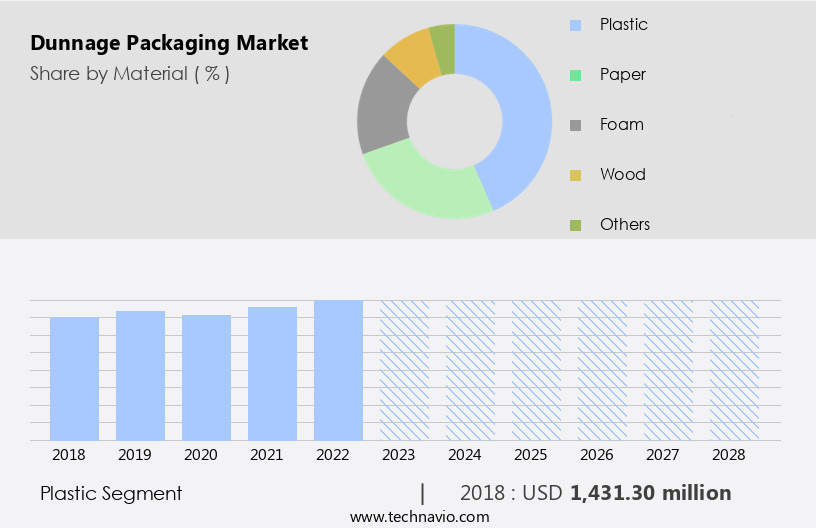
The plastic segment is estimated to witness significant growth during the forecast period. Plastic dunnage packaging plays a vital role in protecting goods during transportation and storage. This category encompasses materials such as polyethylene, polypropylene, and polycarbonate, valued for their durability, lightweight properties, and resistance to moisture, chemicals, and environmental conditions. Plastic dunnage solutions, including inflatable airbags, cushioning pads, and custom-molded trays, effectively prevent product movement and damage. These solutions are indispensable in industries like automotive, electronics, and pharmaceuticals. Key growth drivers for the plastic dunnage segment include the increasing demand for cost-effective and robust packaging solutions and the need for protection without adding substantial weight to shipments. Additionally, environmental concerns and sustainable practices are influencing the market towards recyclable and biodegradable materials. Industries like aerospace, e-commerce, and oil & lubricants are also significant contributors to the market's growth.
Get a glance at the share of various segments. Request Free Sample
The plastic segment was valued at USD 1.43 billion in 2018 and showed a gradual increase during the forecast period.
Regional Analysis
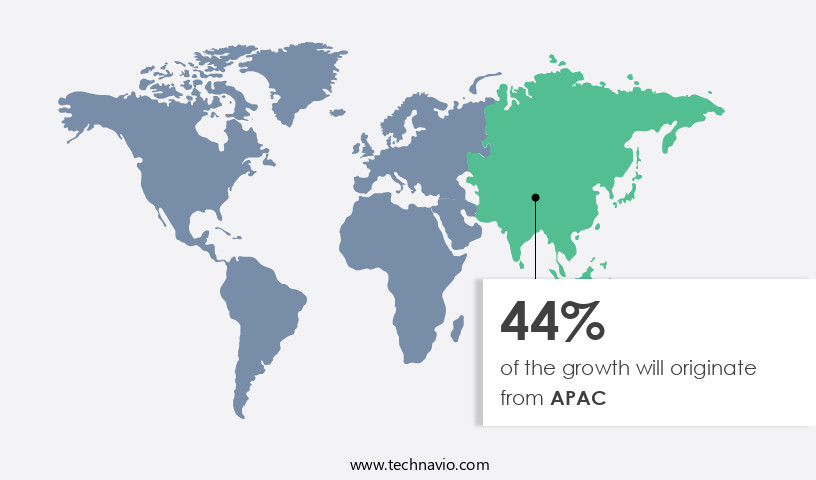
APAC is estimated to contribute 44% to the growth of the global market during the forecast period. Technavio's analysts have elaborately explained the regional trends and drivers that shape the market during the forecast period.
For more insights on the market size of various regions, Request Free Sample
The market in Asia Pacific (APAC) is experiencing consistent growth, driven by the expansion of various end-user industries such as e-commerce, fast-moving consumer goods (FMCG), and personal care. Rapidly developing economies like China and India are anticipated to significantly contribute to the market's revenue growth In the forecast period. The region's high concentration of manufacturing industries increases the demand for effective dunnage packaging solutions. The e-commerce sector is thriving in countries like China, India, and Japan. For instance, the Government e-marketplace (GeM) in India reported a Gross Merchandise Value (GMV) of approximately USD27 billion in FY 2022â2023. The APAC the market caters to various sectors, including electronics, aerospace, automotive, oil & lubricants, chemicals, healthcare, construction, food & beverages, and consumer durables.
Corrugated Plastic, Molded Plastic, Foam, Steel, Aluminum, Wood, Fabric Dunnage, Corrugated Paper, Glass, Rubber, Anti-Static, and various eco-friendly materials like Sustainable practices, Environmental concerns, Recyclable materials, and Biodegradable materials are used In the production of dunnage packaging. The Plastic segment, including Corrugated Plastic-based products, Polypropylene (PP), and Polyethylene (PE), holds a significant market share. The market is capital-intensive, with key players focusing on innovation and sustainability to cater to evolving customer needs. The Automotive and Electronics sectors, along with the Aerospace sector, are major consumers of dunnage packaging due to their stringent safety regulations. International trade and logistics networks also contribute to the market's growth.
Dunnage airbags, eco-friendly trend, and eco-friendly products are gaining popularity as packaging solutions to address environmental regulations. Wood foam and Fiber-based foam are increasingly being used due to their sustainability and returnable, reusable packaging industry benefits. In conclusion, the market in APAC is witnessing robust growth, driven by expanding end-user industries, increasing manufacturing activities, and the growing demand for eco-friendly and sustainable packaging solutions.
Market Dynamics
Our researchers analyzed the data with 2023 as the base year, along with the key drivers, trends, and challenges. A holistic analysis of drivers will help companies refine their marketing strategies to gain a competitive advantage.
What are the key market drivers leading to the rise In the adoption of Dunnage Packaging Industry?
Growth in e-commerce industry is the key driver of the market.
- The growth of e-commerce has been a significant driver of the global dunnage packaging market, revolutionizing the way products are packaged and shipped. With the surge in online shopping platforms like Amazon, Alibaba, and eBay, the demand for reliable and efficient packaging solutions has skyrocketed. Consumers now expect quick delivery and undamaged products, making protective packaging essential. For example, as of January 2022, the total number of active Internet users in the US accounted for approximately 300 million, while active social media users were 270 million. Also, the US consumer spending on e-commerce reached approximately USD 1.1 trillion in 2023. Moreover, India's burgeoning e-commerce sector, encompassing diverse segments like business-to-business (B2B), direct-to-consumer (D2C), consumer-to-consumer (C2C), and consumer-to-business (C2B), is poised to significantly influence the global dunnage packaging market.
- The rapid growth of D2C and B2B segments, projected to reach USD 60 billion and USD 350 billion respectively by specified timelines, underscores a robust demand for secure and efficient packaging solutions. As India's overall e-commerce market expands, forecasted to achieve 21.5% growth and reach USD 74.8 billion in 2022, the need for reliable dunnage packaging will intensify. This growth is driven by consumers' expectations for safe delivery of products ranging from electronics to perishables, necessitating effective packaging to prevent damage during transit. Thus, the growing global e-commerce industry will continue to drive the growth of the global dunnage packaging market during the forecast period
What are the market trends shaping the Dunnage Packaging market?
Rising international trade is the upcoming market trend.
- The growth of global trade is a significant catalyst for the expansion of the global dunnage packaging market. As international trade continues to thrive, facilitated by globalization and technological advancements, the need for efficient and reliable packaging solutions becomes paramount. Dunnage packaging plays a crucial role in protecting goods during transit, ensuring they reach their destinations intact and undamaged. The increasing volume of goods transported globally, spanning various industries such as automotive, electronics, pharmaceuticals, and consumer goods, drives the demand for robust dunnage packaging solutions. These industries rely on dunnage to secure components, products, and perishable items, safeguarding them from shocks, vibrations, and environmental factors throughout the supply chain.
- In 2024, the OECD forecasts global trade in goods and services to increase by 2.3%, followed by a higher growth rate of 3.3% in 2025, marking a significant improvement from the 1% growth observed in 2023. Simultaneously, the IMF's World Economic Outlook projects world trade growth at 3% for 2024 and slightly higher at 3.3% for 2025, despite revising its earlier projections downward. The WTO also forecasts growth in world merchandise trade volumes, expecting increases of 2.6% in 2024 and 3.3% in 2025 following a notable decline in 2023. Thus, as global trade volumes continue to rise, fueled by increasing consumer demand and economic interdependencies, the demand for advanced dunnage packaging solutions is expected to grow steadily, thereby contributing to the growth of the global dunnage packaging market during the forecast period
What challenges does the Dunnage Packaging Industry face during its growth?
Fluctuations in raw material costs used in manufacturing of dunnage packaging is a key challenge affecting the industry growth.
- The fluctuations in raw material costs used in the manufacturing of dunnage packaging restrain the growth of the global dunnage packaging market, impacting production costs and pricing. Materials such as plastics, foams, and metals are essential for manufacturing dunnage packaging, but their prices can be volatile due to factors like fluctuating oil prices, supply chain disruptions, and geopolitical tensions. For example, the price of polyethylene, a common plastic used in packaging, can vary widely based on crude oil prices, leading to increased production costs for manufacturers. Similarly, metal prices, such as aluminum and steel, can be affected by tariffs and trade policies, further exacerbating cost issues. Foam materials, often derived from petroleum products, also experience price fluctuations in tandem with global oil markets. Owing to the Russia-Ukraine war, the cost of crude oil climbed above $90 a barrel in November 2023.
- The global dunnage packaging market often relies on a global supply chain for raw materials. Geopolitical events such as the Russia-Ukraine war, trade tensions between China and the US, and disruptions in the supply chain have led to uncertainties in the availability and cost of raw materials. Raw material cost fluctuations can affect the profit margins of dunnage packaging manufacturers. Sudden increases in costs may be challenging for companies to absorb or pass on to consumers, potentially affecting competitiveness and profitability. Thus, fluctuations in raw material costs are anticipated to pose a significant challenge to the global dunnage packaging market during the forecast period
Exclusive Customer Landscape
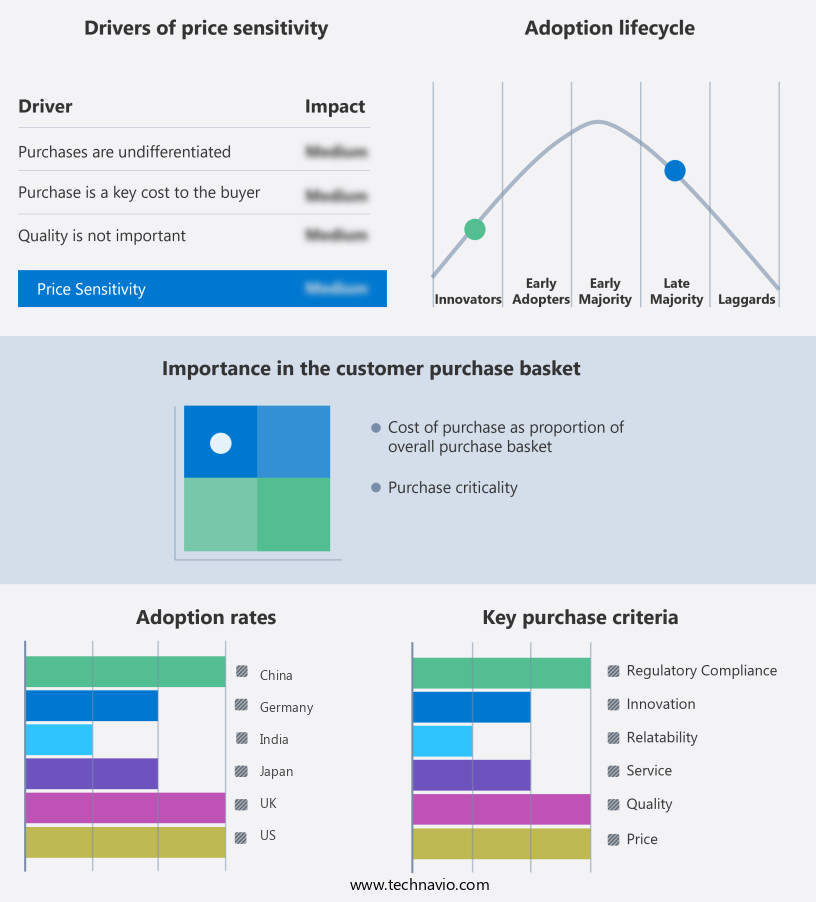
The dunnage packaging market forecasting report includes the adoption lifecycle of the market, covering from the innovator's stage to the laggard's stage. It focuses on adoption rates in different regions based on penetration. Furthermore, the dunnage packaging market report also includes key purchase criteria and drivers of price sensitivity to help companies evaluate and develop their market growth analysis strategies.
Customer Landscape
Key Companies & Market Insights
Companies are implementing various strategies, such as strategic alliances, dunnage packaging market forecast, partnerships, mergers and acquisitions, geographical expansion, and product/service launches, to enhance their presence In the industry.
ALLPACK PACKAGING LTD - The company specializes in providing a range of dunnage packaging solutions, including Contain a Pac - Paper Dunnage Bags and sustainable alternatives. These offerings ensure effective protection of goods during transportation and storage.
The industry research and growth report includes detailed analyses of the competitive landscape of the market and information about key companies, including:
- ALLPACK PACKAGING LTD
- Amatech Inc.
- Buckhorn Inc.
- Corplex
- Dordan Manufacturing Co.
- Flex Container.
- GWP Group Ltd.
- IPS Packaging and Automation
- JIDA Industrial Solutions
- MJSolpac Ltd
- NEFAB GROUP
- ORBIS Corp.
- Packaging Corp. of America
- PolyFlex Pro
- Reusable Transport Packaging
- Salco Engineering & Manufacturing Co.
- Schoeller Allibert
- Signode Industrial Group LLC
- Sonoco Products Co.
- TriEnda Holdings LLC
- UFP Industries Inc.
Qualitative and quantitative analysis of companies has been conducted to help clients understand the wider business environment as well as the strengths and weaknesses of key industry players. Data is qualitatively analyzed to categorize companies as pure play, category-focused, industry-focused, and diversified; it is quantitatively analyzed to categorize companies as dominant, leading, strong, tentative, and weak.
Research Analyst Overview
The market encompasses a diverse range of materials and applications, catering to various industries and sectors. This market includes packaging solutions made from corrugated plastic, molded plastic, foam, steel, aluminum, wood, fabric, corrugated paper, glass, rubber, anti-static, and other materials. Each material type offers distinct advantages, making them suitable for specific applications. Corrugated plastic and molded plastic are popular choices due to their durability and resistance to impact. These materials are widely used In the aerospace and electronics sectors, where the need for protective packaging is paramount. In contrast, foam-based dunnage packaging, which includes expanded polyethylene and expanded polypropylene beads, is known for its excellent shock absorption properties.
This makes it a preferred choice for industries dealing with fragile items, such as pharmaceuticals and electronics. Steel and aluminum dunnage are commonly used In the automotive sector due to their strength and ability to withstand heavy loads. Wood and fabric dunnage are popular In the construction industry due to their cost-effectiveness and ease of use. Glass and rubber dunnage, on the other hand, are primarily used for specific applications where their unique properties are required. The e-commerce sector, fueled by online shopping and returns, has seen significant growth In the market. The need for sustainable practices and environmental concerns has led to the increasing popularity of recyclable and biodegradable materials.
Logistics networks are also adopting eco-friendly trends, with a focus on reducing waste and carbon footprint. The market is capital-intensive, with various processes involved In the production of different material types. The corrugated plastic segment, which includes corrugated plastic-based products, is a significant contributor to the market's growth. The plastic segment, which includes polypropylene (PP) and polyethylene (PE), is another major player due to the versatility and durability of these materials. The automotive and electronics sectors are major consumers of dunnage packaging, with the automotive segment accounting for a significant share of the market. The aerospace sector also contributes significantly due to the stringent requirements for protective packaging in this industry.
Sustainability is a key trend In the market, with a focus on returnable and reusable packaging solutions. Wood foam and fiber-based foam are gaining popularity due to their eco-friendly nature and cost-effectiveness. The pharmaceuticals sector is also adopting sustainable practices, with a focus on using biodegradable materials for dunnage packaging. In conclusion, the market is a dynamic and diverse industry, catering to various sectors and applications. The choice of material type depends on the specific requirements of the industry and the application. Sustainability and eco-friendly practices are becoming increasingly important, with a focus on recyclable and biodegradable materials. The market is expected to continue growing, driven by the increasing demand for protective packaging solutions in various industries.
|
Market Scope |
|
|
Report Coverage |
Details |
|
Page number |
208 |
|
Base year |
2023 |
|
Historic period |
2018-2022 |
|
Forecast period |
2024-2028 |
|
Growth momentum & CAGR |
Accelerate at a CAGR of 5.32% |
|
Market growth 2024-2028 |
USD 980.1 million |
|
Market structure |
Fragmented |
|
YoY growth 2023-2024(%) |
5.14 |
|
Key countries |
US, China, India, Germany, Japan, and UK |
|
Competitive landscape |
Leading Companies, Market Positioning of Companies, Competitive Strategies, and Industry Risks |
What are the Key Data Covered in this Dunnage Packaging Market Research and Growth Report?
- CAGR of the Dunnage Packaging industry during the forecast period
- Detailed information on factors that will drive the growth and forecasting between 2024 and 2028
- Precise estimation of the size of the market and its contribution of the industry in focus to the parent market
- Accurate predictions about upcoming growth and trends and changes in consumer behaviour
- Growth of the market across APAC, North America, Europe, Middle East and Africa, and South America
- Thorough analysis of the market's competitive landscape and detailed information about companies
- Comprehensive analysis of factors that will challenge the dunnage packaging market growth of industry companies
We can help! Our analysts can customize this dunnage packaging market research report to meet your requirements.


