E-Commerce Retail Market Size 2025-2029
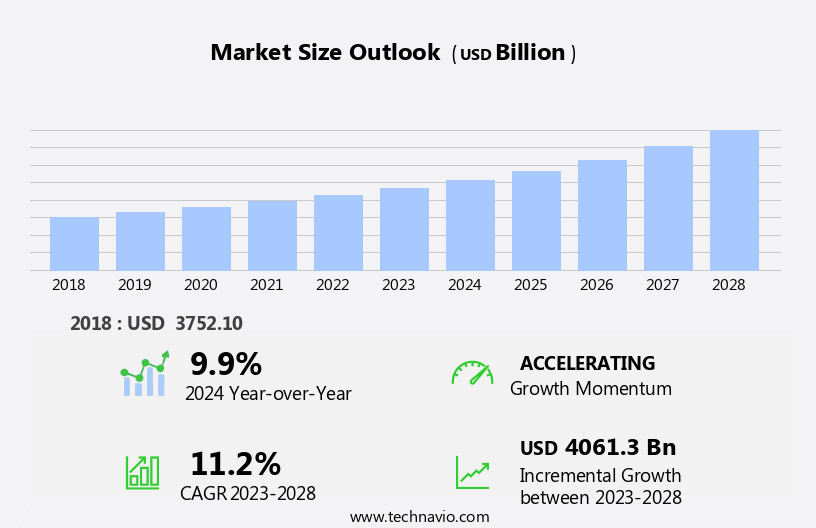
The e-commerce retail market size is forecast to increase by USD 4,833.5 billion at a CAGR of 12% between 2024 and 2029.
- The market is experiencing significant growth, driven by the advent of personalized shopping experiences. Consumers increasingly expect tailored recommendations and seamless interactions, leading retailers to integrate advanced technologies such as Artificial Intelligence (AI) to enhance the shopping journey. However, this market is not without challenges. Strict regulatory policies related to compliance and customer protection pose obstacles for retailers, requiring continuous investment in technology and resources to ensure adherence.
- Retailers must navigate these challenges to effectively capitalize on the market's potential and deliver value to customers. By focusing on personalization and regulatory compliance, e-commerce retailers can differentiate themselves, build customer loyalty, and ultimately thrive in this dynamic market. Balancing the need for innovation with regulatory requirements is a delicate task, necessitating strategic planning and operational agility. Fraud prevention and customer retention are crucial aspects of e-commerce, with payment gateways ensuring secure transactions.
What will be the Size of the E-Commerce Retail Market during the forecast period?
Explore in-depth regional segment analysis with market size data - historical 2019-2023 and forecasts 2025-2029 - in the full report.
Request Free Sample
- In the dynamic market, shopping carts and checkout processes streamline transactions, while sales forecasting and marketing automation help businesses anticipate consumer demand and optimize promotions. SMS marketing and targeted advertising reach customers effectively, driving sales growth. Warranty claims and customer support chatbots ensure post-purchase satisfaction, bolstering customer loyalty. Retail technology advances, including sustainable packaging, green logistics, and mobile optimization, cater to environmentally-conscious consumers. Legal compliance, data encryption, and fraud detection safeguard businesses and consumer trust. Product reviews, search functionality, and personalized recommendations enhance the shopping experience, fostering customer engagement.
- Dynamic pricing and delivery networks adapt to market fluctuations and consumer preferences, respectively. E-commerce software integrates various functionalities, from circular economy initiatives and website accessibility to email automation and real-time order tracking. Overall, the e-commerce landscape continues to evolve, with businesses adopting innovative strategies to meet the needs of diverse customer segments and stay competitive.
How is this E-Commerce Retail Industry segmented?
The e-commerce retail industry research report provides comprehensive data (region-wise segment analysis), with forecasts and estimates in "USD billion" for the period 2025-2029, as well as historical data from 2019-2023 for the following segments.
- Product
- Apparel and accessories
- Groceries
- Footwear
- Personal and beauty care
- Others
- Modality
- Business to business (B2B)
- Business to consumer (B2C)
- Consumer to consumer (C2C)
- Device
- Mobile
- Desktop
- Geography
- North America
- US
- Canada
- Europe
- France
- Germany
- Italy
- UK
- APAC
- China
- India
- Japan
- South Korea
- Rest of World (ROW)
- North America
By Product Insights
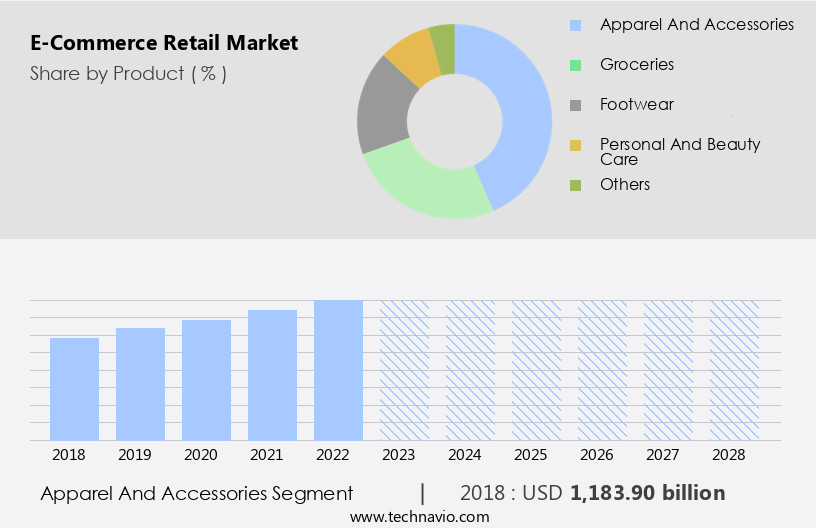
The apparel and accessories segment is estimated to witness significant growth during the forecast period. The market for apparel and accessories is experiencing significant growth, fueled by several key trends. Increasing consumer affluence and a shift toward premiumization are driving this expansion, with the organized retail sector seeing particular growth. Influenced by social media trends, the Gen Z demographic is a major contributor to this rise in online shopping. This demographic is known for their preference for the latest fashion trends and their willingness to invest in premium products, making them a valuable market segment. Machine learning and artificial intelligence are increasingly being used for returns management and personalized recommendations, enhancing the customer experience.
Ethical sourcing and supply chain optimization are also essential, as consumers demand transparency and sustainability. Cybersecurity threats continue to pose challenges, requiring robust strategies and technologies. B2C and C2C e-commerce are thriving, with influencer marketing and e-commerce analytics playing significant roles. Customer reviews are essential for building trust and brand loyalty, while reputation management and affiliate marketing help expand reach. Sustainable e-commerce and b2b e-commerce are also gaining traction, with third-party logistics and social commerce offering new opportunities. Augmented reality and virtual reality are transforming the shopping experience, while cross-border e-commerce and mobile app development are expanding market reach.
E-commerce platforms, inventory management, email marketing, and product catalog management are essential tools for retailers. Last-mile delivery and order fulfillment are critical for ensuring customer satisfaction, while data analytics and online retail help retailers gain insights into consumer behavior and preferences. Omnichannel retail, social media marketing, and user experience are also essential for engaging customers and driving sales. The market for apparel and accessories is experiencing rapid growth, driven by a range of factors including consumer trends, technology, and market dynamics. Retailers must stay informed about these trends and adapt to meet evolving consumer demands and expectations.
The Apparel and accessories segment was valued at USD 1.295.30 billion in 2019 and showed a gradual increase during the forecast period.
Cybersecurity threats persist, necessitating robust security measures. Pricing strategies are being refined using data analytics and market insights. Website design and user experience are critical factors influencing customer engagement. Cloud computing and mobile commerce are transforming the retail landscape. Data privacy and big data are key concerns, with regulations evolving to protect consumer information. Cross-border e-commerce is expanding, with third-party logistics and international shipping services streamlining operations. Social commerce and augmented reality are reshaping consumer behavior. Omnichannel retail and order fulfillment are essential for seamless customer experiences. Reputation management and content marketing are crucial for brand building. Last-mile delivery and sustainable e-commerce are emerging priorities.
The E-Commerce Retail Market continues to thrive with innovations that enhance the customer journey and backend efficiency. Payment processing technologies have become faster and more secure, encouraging seamless transactions. Businesses are leveraging customer segmentation to target audiences with tailored offerings, while product discovery tools improve visibility and drive engagement. Strengthened security protocols ensure consumer trust, especially in handling sensitive data. Transparent return policies are now a vital differentiator, influencing customer loyalty and repeat purchases. Consumers are increasingly influenced by social proof, such as reviews and ratings, that build confidence in buying decisions. Meanwhile, instant live chat support bridges the gap between brands and shoppers, offering real-time assistance and boosting conversion rates in a competitive market landscape.
Regional Analysis
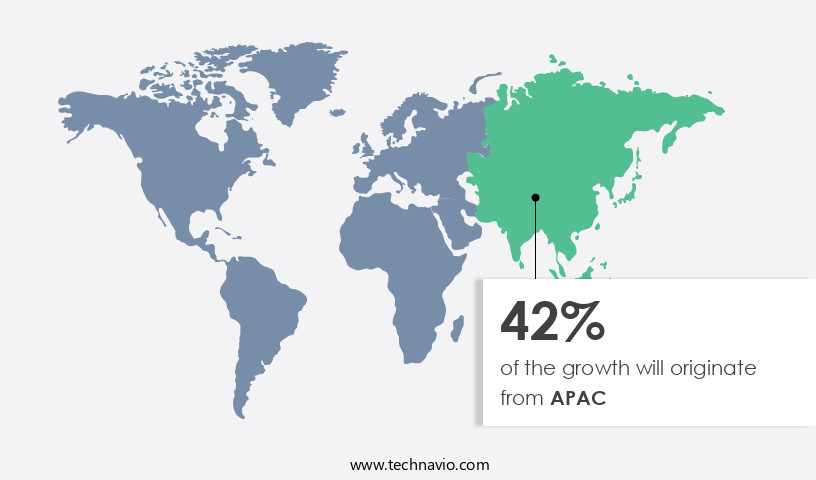
APAC is estimated to contribute 42% to the growth of the global market during the forecast period. Technavio's analysts have elaborately explained the regional trends and drivers that shape the market during the forecast period.
The market is witnessing significant advancements, with technology playing a pivotal role in shaping its dynamics. Blockchain technology is revolutionizing transactions with enhanced security and transparency. Fraud prevention solutions, powered by machine learning and artificial intelligence, are safeguarding businesses against financial losses. Customer retention strategies, including personalized recommendations and loyalty programs, are being optimized using data analytics. Payment gateways are evolving to support various currencies and regions, enabling seamless international trade. Influencer marketing is a growing trend, with brands leveraging customer trust and reach. E-commerce analytics and customer reviews are essential tools for data-driven decision-making. Ethical sourcing and supply chain optimization are prioritized for sustainable business practices.
In the Asia Pacific region, innovative services and strategic partnerships are driving cross-border trade. Japanese retailers are leveraging services that assist with handling international orders, including shipping and website translation. Beenos, a leading player, supports retailers like Tackle Berry, enabling them to tap into a broader international customer base. Their products, priced between USD70 and USD130, have found success in markets like the U.S., Malaysia, and Belarus. E-commerce platforms and email marketing are essential tools for online retailers. Product catalog management and inventory management are crucial for efficient operations. Affiliate marketing and returns processing are key aspects of revenue generation and customer satisfaction.
Recommendation engines and returns processing are essential for personalized shopping experiences and minimizing losses. The market is witnessing a myriad of innovations and trends, from technology advancements to strategic partnerships. Cross-border trade is a significant growth area, with Japan leading the way. E-commerce regulations and data analytics are essential for navigating the complex retail landscape. Brand loyalty and customer service are critical for long-term success.
Market Dynamics
Our researchers analyzed the data with 2024 as the base year, along with the key drivers, trends, and challenges. A holistic analysis of drivers will help companies refine their marketing strategies to gain a competitive advantage.
What are the E-Commerce Retail market drivers leading to the rise in the adoption of Industry?
- The advent of personalized shopping is the primary catalyst fueling the market's growth. The market is undergoing a transformation, with a focus on supply chain optimization, cybersecurity threats, pricing strategies, website design, cloud computing, mobile commerce, data privacy, big data, digital commerce, and e-commerce regulations. Leading retailers are utilizing advanced technologies, such as AI and machine learning, to deliver personalized shopping experiences and enhance consumer engagement. For instance, Amazon and Walmart are leveraging next-generation technologies to refine search queries and provide more accurate product recommendations.
- Furthermore, product catalog management and cloud computing enable retailers to offer extensive product selections and streamline operations. Cybersecurity threats and data privacy concerns are significant challenges, necessitating robust security measures and adherence to regulations. Overall, the e-commerce landscape is dynamic, requiring retailers to stay informed and adapt to evolving trends to remain competitive. Inventory management and email marketing are also crucial aspects of e-commerce, requiring effective strategies to ensure stock availability and customer retention.
What are the E-Commerce Retail market trends shaping the Industry?
- The integration of artificial intelligence (AI) is an emerging market trend. This technological advancement is mandatory for businesses seeking to remain competitive and efficient in today's dynamic business landscape. The market is undergoing a substantial evolution, driven by the integration of artificial intelligence (AI). This technological advancement is revolutionizing consumer-platform interaction, delivering personalized and streamlined services. One such innovation is AI-powered e-commerce assistants. For example, Amazon introduced Rufus, an AI assistant catering to its Indian clientele in August 2024. Rufus offers customized product recommendations, shopping list suggestions, and comparisons of various product categories.
- Recommendation engines are another essential tool, suggesting items based on users' browsing and purchasing history. Sustainable e-commerce is gaining traction, with businesses focusing on reducing their carbon footprint and adopting eco-friendly practices. B2B e-commerce is also on the rise, catering to the unique needs of businesses. Cross-border e-commerce is expanding, allowing businesses to reach global audiences. Mobile app development is crucial, ensuring a seamless shopping experience on mobile devices. Lastly, user experience (UX) is a top priority, with businesses investing in intuitive designs and easy navigation to attract and retain customers. Furthermore, it grants access to customer feedback, empowering shoppers to make informed decisions based on previous experiences. Moreover, e-commerce is expanding its horizons through various channels. Affiliate marketing is a popular strategy, where businesses partner with third parties to promote their products.
How does E-Commerce Retail market face challenges during its growth?
- Strict regulatory policies, which prioritize compliance and customer protection, pose a significant challenge to the industry's growth. These regulations are essential for maintaining trust and ensuring the well-being of consumers, but they also impose additional costs and complexities on businesses. Adhering to these policies requires substantial resources and a robust compliance framework, which can hinder innovation and growth in the industry. The market is characterized by a complex regulatory environment that poses challenges for businesses. In some regions, including Japan, e-commerce operators are subject to stringent regulations designed to protect consumers and ensure fair practices. For instance, the Act on Specified Commercial Transactions (ASCT) requires disclosure of specific information, such as cancellation policies, and prohibits unsolicited emails. The Act on Regulation of Transmission of Specified Electronic Mail (ARTSEM) further reinforces this prohibition.
- Customer service, user interface (UI), omnichannel retail, social media marketing, order fulfillment, data analytics, and last-mile delivery are critical areas of focus for e-commerce businesses. Providing excellent customer service and a seamless UI are essential for attracting and retaining customers. Omnichannel retail strategies enable businesses to engage with customers across multiple channels, enhancing brand loyalty. Social media marketing is an effective tool for reaching a large audience and driving sales. Efficient order fulfillment and data analytics help businesses optimize operations and improve the customer experience. Last-mile delivery solutions ensure timely and accurate delivery, enhancing customer satisfaction. The Consumer Contract Act imposes restrictions on disadvantageous terms in service agreements. These regulations, coupled with intellectual property laws, create a complex legal landscape for e-commerce businesses to navigate.
Exclusive Customer Landscape
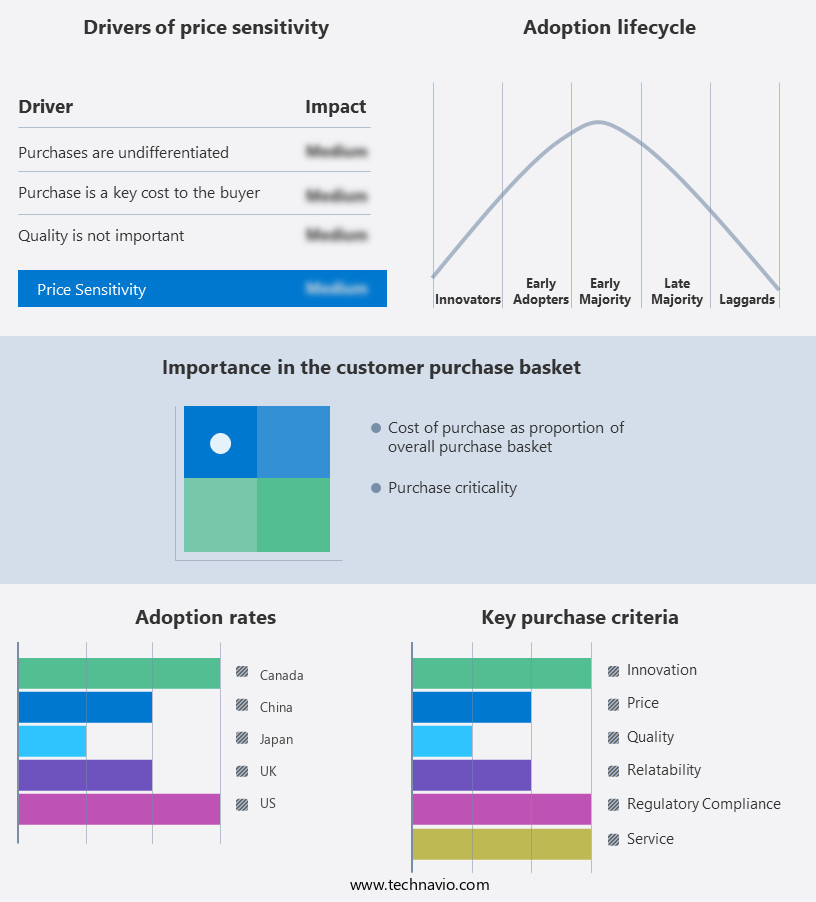
The e-commerce retail market forecasting report includes the adoption lifecycle of the market, covering from the innovator's stage to the laggard's stage. It focuses on adoption rates in different regions based on penetration. Furthermore, the e-commerce retail market report also includes key purchase criteria and drivers of price sensitivity to help companies evaluate and develop their market growth analysis strategies.
Customer Landscape
Key Companies & Market Insights
Companies are implementing various strategies, such as strategic alliances, e-commerce retail market forecast, partnerships, mergers and acquisitions, geographical expansion, and product/service launches, to enhance their presence in the industry.
Alibaba Group Holding Ltd. - This company specializes in e-commerce retail, serving a wide consumer base with a diverse product range that includes electronics, fashion, home goods, industrial machinery, beauty products, and consumer electronics.
The industry research and growth report includes detailed analyses of the competitive landscape of the market and information about key companies, including:
- Alibaba Group Holding Ltd.
- Amazon.com Inc.
- Apple Inc.
- Best Buy Co. Inc.
- Blink Commerce Pvt. Ltd.
- Coupang Inc.
- eBay Inc.
- Etsy Inc.
- Flipkart Internet Pvt. Ltd.
- Inter IKEA Holding BV
- Manash E-Commerce Pvt. Ltd.
- Nykaa E-Retail Ltd.
- Otto GmbH and Co. KG
- Rakuten Group Inc.
- Reliance Retail Ltd.
- Shopify Inc.
- Snapdeal Ltd.
- Target Corp.
- The Kroger Co.
- Walmart Inc.
Qualitative and quantitative analysis of companies has been conducted to help clients understand the wider business environment as well as the strengths and weaknesses of key industry players. Data is qualitatively analyzed to categorize companies as pure play, category-focused, industry-focused, and diversified; it is quantitatively analyzed to categorize companies as dominant, leading, strong, tentative, and weak.
Recent Development and News in E-Commerce Retail Market
- In January 2024, Amazon announced the acquisition of Whole Foods Market for approximately USD13.4 billion, marking a significant expansion of Amazon's physical retail presence and its entry into the grocery sector (Amazon Press Release, 2024).
- In March 2024, Alibaba and Walmart formed a strategic partnership, allowing Alibaba's customers to shop on Walmart's U.S. E-commerce platform, marking a significant collaboration between two major e-commerce players (Alibaba Press Release, 2024).
- In April 2025, Shopify raised USD1.1 billion in a secondary offering, demonstrating strong investor confidence in the company's growth prospects and its role as a leading e-commerce platform provider (Shopify Press Release, 2025).
- In May 2025, India's e-commerce market witnessed a major policy shift when the Competition Commission of India approved the merger of Flipkart and Walmart, paving the way for the world's largest e-commerce company to further expand its operations in India (Competition Commission of India Press Release, 2025).
Research Analyst Overview
The market continues to evolve, with dynamic market activities shaping various sectors. Customer retention remains a top priority, with fraud prevention measures and payment gateways ensuring secure transactions. Machine learning and returns management streamline processes, while recommendation engines personalize shopping experiences. Sustainable e-commerce and ethical sourcing gain traction, with supply chain optimization and cybersecurity threats at the forefront. Pricing strategies, website design, and cloud computing enhance user experience, as data privacy and big data drive e-commerce analytics. E-commerce regulations, inventory management, and email marketing are essential components of digital commerce. Reputation management, affiliate marketing, and returns processing are crucial for maintaining brand loyalty.
B2C and C2C e-commerce thrive, with influencer marketing and e-commerce platforms driving sales. Social commerce, augmented reality, and virtual reality transform shopping experiences, while cross-border e-commerce and mobile app development expand market reach. Last-mile delivery and order fulfillment optimize operations, with data analytics providing valuable insights. Omnichannel retail and social media marketing broaden consumer engagement, as user experience and customer service remain key differentiators. Content marketing and brand loyalty are essential for long-term success in the market. By creating valuable and engaging content, businesses can attract and retain customers, build brand awareness, and differentiate themselves from competitors. Brand loyalty is crucial for repeat business and long-term customer relationships. E-commerce platforms offer various features and tools to help businesses optimize their online presence, streamline operations, and enhance the customer experience.
The E-Commerce Retail Market is undergoing a digital revolution powered by innovations like BC eCommerce, which streamlines business-to-consumer transactions. Emerging technologies such as augmented reality (AR) and virtual reality (VR) are transforming the online shopping experience by enabling customers to visualize products in real-time environments. Meanwhile, machine learning (ML) plays a critical role in personalizing recommendations, optimizing inventory, and enhancing customer service. The backbone of fast and efficient delivery lies in third-party logistics (PL), which allows retailers to scale operations without owning a logistics network.
Dive into Technavio's robust research methodology, blending expert interviews, extensive data synthesis, and validated models for unparalleled E-Commerce Retail Market insights. See full methodology.
|
Market Scope |
|
|
Report Coverage |
Details |
|
Page number |
227 |
|
Base year |
2024 |
|
Historic period |
2019-2023 |
|
Forecast period |
2025-2029 |
|
Growth momentum & CAGR |
Accelerate at a CAGR of 12% |
|
Market growth 2025-2029 |
USD 4833.5 billion |
|
Market structure |
Fragmented |
|
YoY growth 2024-2025(%) |
10.5 |
|
Key countries |
US, China, Canada, Japan, UK, Germany, South Korea, India, France, and Italy |
|
Competitive landscape |
Leading Companies, Market Positioning of Companies, Competitive Strategies, and Industry Risks |
What are the Key Data Covered in this E-Commerce Retail Market Research and Growth Report?
- CAGR of the E-Commerce Retail industry during the forecast period
- Detailed information on factors that will drive the growth and forecasting between 2025 and 2029
- Precise estimation of the size of the market and its contribution of the industry in focus to the parent market
- Accurate predictions about upcoming growth and trends and changes in consumer behaviour
- Growth of the market across APAC, North America, Europe, South America, and Middle East and Africa
- Thorough analysis of the market's competitive landscape and detailed information about companies
- Comprehensive analysis of factors that will challenge the e-commerce retail market growth of industry companies
We can help! Our analysts can customize this e-commerce retail market research report to meet your requirements.


