E-Invoicing Market Size 2025-2029
The e-invoicing market size is forecast to increase by USD 36.1 billion, at a CAGR of 29.9% between 2024 and 2029.
- The market is driven by the convenience and easy accessibility of mobile payment systems, enabling seamless transactions and real-time processing. This trend is particularly prominent in regions with a high smartphone penetration and a growing preference for digital solutions. Another key factor fueling market growth is the increased security of documents using blockchain technology. By providing a tamper-proof and decentralized platform for invoice transactions, blockchain enhances data security and reduces the risk of fraud. However, the market also faces significant challenges. The threat of cyber-attacks and data privacy concerns persists, with sensitive financial and business information at risk.
- As digital transactions become more common, ensuring robust cybersecurity measures and data protection protocols is essential for market players. Additionally, the complexity of integrating various systems and platforms for seamless e-invoicing processes can pose operational challenges for businesses. Addressing these challenges through strategic partnerships, advanced technologies, and regulatory compliance will be crucial for companies seeking to capitalize on the market's potential and maintain a competitive edge.
What will be the Size of the E-Invoicing Market during the forecast period?
Explore in-depth regional segment analysis with market size data - historical 2019-2023 and forecasts 2025-2029 - in the full report.
Request Free Sample
The market continues to evolve, with dynamic market activities unfolding across various sectors. Entities seeking to streamline their financial processes are increasingly adopting accounts payable automation, digital signatures, electronic archiving, tax compliance, and artificial intelligence. These technologies offer significant benefits, including audit trails, cost reduction, and real-time tracking. B2B e-commerce is a major driver of e-invoicing adoption, as it enables seamless invoice processing and integration with other business systems. System integration, API integration, and EDI integration are crucial components of this process. Invoice processing is further enhanced through workflow automation, invoice lifecycle management, and invoice validation. E-invoicing also addresses critical business needs such as legal compliance, data security, and fraud prevention.
Data encryption, GDPR compliance, and document management are essential features in this regard. Furthermore, e-invoicing offers multi-lingual support, purchase order management, and customer and supplier portals, ensuring a comprehensive solution. Credit management, workflow optimization, and user interface are additional aspects of e-invoicing that contribute to business process optimization. Cloud storage, reporting and analytics, financial reporting, and multi-currency support are also integral elements, offering enhanced efficiency gains and cash flow management capabilities. The ongoing integration of invoice automation, error reduction, payment gateway integration, and invoice financing further underscores the continuous evolution of the market. Implementation services and support and maintenance ensure a smooth transition to this digital solution.
Overall, e-invoicing represents a powerful tool for businesses seeking to streamline their financial processes, enhance operational efficiency, and maintain regulatory compliance.
How is this E-Invoicing Industry segmented?
The e-invoicing industry research report provides comprehensive data (region-wise segment analysis), with forecasts and estimates in "USD million" for the period 2025-2029, as well as historical data from 2019-2023 for the following segments.
- End-user
- B2B
- B2C
- Deployment
- Cloud-based
- On-premises
- Application
- Energy and Utilities
- FMCG
- E-Commerce
- BFSI
- Government
- Others
- Geography
- North America
- US
- Canada
- Europe
- Denmark
- France
- Germany
- UK
- APAC
- China
- India
- Japan
- South Korea
- Rest of World (ROW)
- North America
By End-user Insights
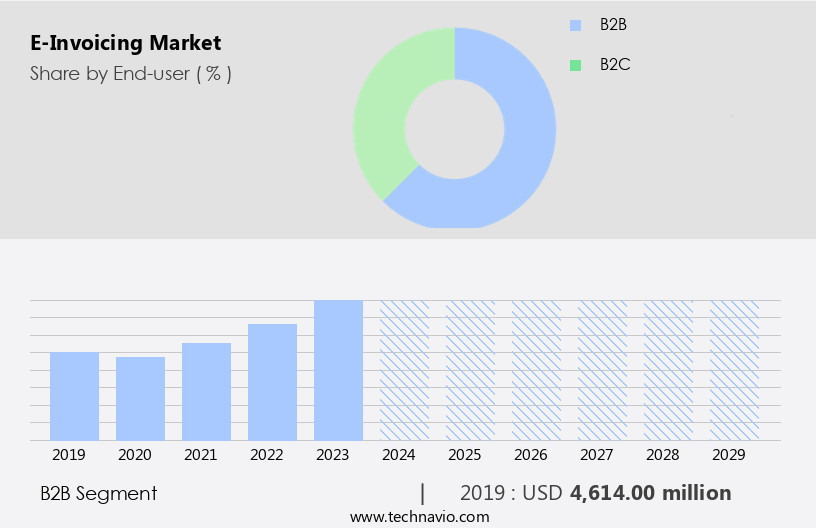
The b2b segment is estimated to witness significant growth during the forecast period.
The market is experiencing significant growth due to the increasing globalization and the expanding IT, banking, financial services and insurance (BFSI), and retail sectors. Centralized billing and invoicing systems through the Internet are becoming increasingly necessary for these industries to remain competitive. Strict regulations in the banking and retail sectors, the popularity of e-commerce, and the emergence of alternative digital payment methods are key drivers for market expansion. E-invoicing solutions are gaining traction, with invoices being issued and received via email, websites, e-post briefs, fax, and text messages. The number of small and medium enterprises (SMEs) in emerging economies is also contributing to the market's rapid adoption.
Machine learning technologies are enhancing invoice processing, while fraud prevention measures ensure secure transactions. Supply chain finance and invoice financing options provide cost savings and improved cash flow management. Data security, data migration, and support and maintenance services ensure a seamless transition to e-invoicing. Business process optimization, workflow automation, and invoice lifecycle management streamline operations, while blockchain technology and electronic archiving provide transparency and compliance with tax and GDPR regulations. Invoice processing, system integration, and real-time tracking enable efficient workflows and error reduction. APIs, digital signatures, and audit trails ensure secure document management and compliance with financial reporting requirements.
Multi-currency support and credit management features cater to global businesses, while user interfaces and cloud storage offer convenience and flexibility. Payment gateway integration and reporting and analytics tools provide valuable insights for financial decision-making. E-invoicing software solutions continue to evolve, incorporating artificial intelligence, b2b e-commerce, purchase order management, and accounts receivable and payable automation to streamline business processes and reduce costs.
The B2B segment was valued at USD 4.61 billion in 2019 and showed a gradual increase during the forecast period.
Regional Analysis
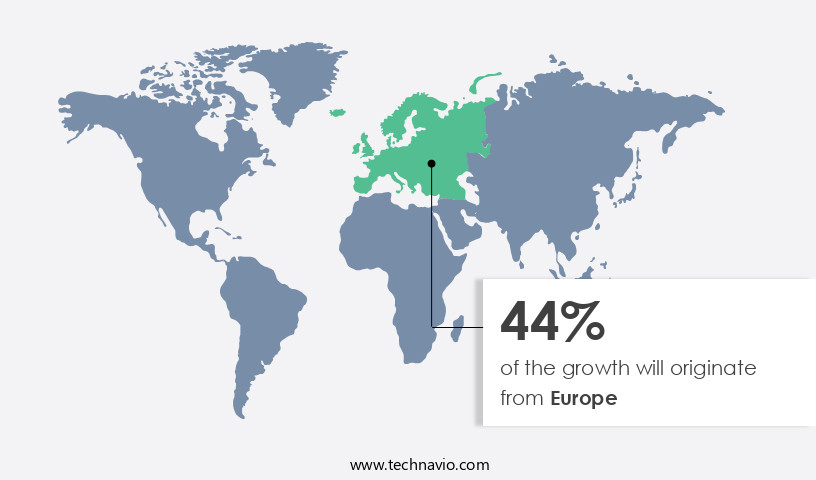
Europe is estimated to contribute 44% to the growth of the global market during the forecast period.Technavio’s analysts have elaborately explained the regional trends and drivers that shape the market during the forecast period.
The market in Western Europe is experiencing significant growth due to regulatory mandates in countries such as Italy, France, and Sweden. Governments in these regions are implementing and regularizing e-invoicing and e-billing processes, making it mandatory for businesses to comply. This trend is expected to increase the demand for e-invoicing services, which encompass various entities including machine learning for invoice processing, supply chain finance, fraud prevention, legal compliance, invoice financing, training and onboarding, data security, data migration, support and maintenance, financial accounting, cost reduction, GDPR compliance, data encryption, API integration, invoice discounting, business process optimization, blockchain technology, workflow automation, invoice lifecycle management, EDI integration, mobile accessibility, real-time tracking, multi-lingual support, purchase order management, accounts receivable automation, invoice validation, accounts payable automation, audit trails, digital signatures, electronic archiving, tax compliance, artificial intelligence, B2B e-commerce, invoice processing, system integration, automated reminders, efficiency gains, implementation services, invoice automation, error reduction, document management, customer portal, supplier portal, credit management, workflow optimization, user interface, cloud storage, payment gateway integration, reporting and analytics, financial reporting, multi-currency support, and cash flow management.
These entities are integral to the e-invoicing software that businesses use to streamline their financial processes, reduce costs, and ensure regulatory compliance. The market's growth is further propelled by the integration of advanced technologies such as machine learning, artificial intelligence, and blockchain technology, which enhance the functionality and efficiency of e-invoicing solutions.
Market Dynamics
Our researchers analyzed the data with 2024 as the base year, along with the key drivers, trends, and challenges. A holistic analysis of drivers will help companies refine their marketing strategies to gain a competitive advantage.
In the dynamic business landscape, the market continues to gain momentum, revolutionizing the way organizations manage and exchange invoices electronically. This market encompasses various solutions, including web-based, mobile, and cloud-based applications, enabling real-time invoice processing and automation. Key players offer features such as advanced analytics, customizable templates, multi-currency support, and seamless integration with accounting systems. E-invoicing platforms ensure compliance with local and international regulations, including e-invoicing mandates and tax laws. Additionally, they facilitate efficient communication between buyers and sellers, enhancing collaboration and streamlining the entire invoicing process. Security is paramount in the market, with robust encryption and data protection measures ensuring the confidentiality and integrity of financial information. Overall, the market empowers businesses to save time, reduce errors, and improve cash flow, making it an essential tool for modern organizations.
What are the key market drivers leading to the rise in the adoption of E-Invoicing Industry?
- The convenience and easy accessibility of mobile payment systems serve as the primary catalyst for market growth. Mobile payment systems' ability to offer swift, secure, and location-independent transactions has made them an indispensable component of modern financial services.
- E-Invoicing, a digital alternative to traditional paper invoicing, is gaining traction in various sectors due to its efficiency and convenience. Machine learning technologies are being integrated into e-Invoicing systems to automate processes, improve accuracy, and enhance fraud prevention. Supply chain finance and invoice financing solutions are also being offered through e-Invoicing platforms, providing businesses with faster access to cash and improved financial management. Legal compliance and GDPR are major concerns for businesses adopting e-Invoicing. Data security and encryption are essential features to ensure the confidentiality and integrity of financial information. Training and onboarding are crucial for successful implementation and adoption of e-Invoicing systems.
- Data migration from legacy systems can be a complex process, requiring expert support and maintenance. Cost reduction is a significant driver for businesses to adopt e-Invoicing, as it eliminates the need for paper-based processes and reduces manual labor costs. Financial accounting processes are streamlined, and real-time data access enables better decision-making. As the market continues to grow, companies are focusing on data security, ease of use, and customization to meet the evolving needs of businesses.
What are the market trends shaping the E-Invoicing Industry?
- Blockchain technology is increasingly being adopted for securing documents, representing a significant market trend. This innovative approach offers enhanced security and reliability for crucial data.
- E-invoicing, a digital alternative to traditional paper invoices, offers several advantages for businesses. One significant benefit is the use of APIs for seamless integration with other business systems, such as purchase order management and accounts receivable automation. This streamlines workflows and optimizes business processes. Another key feature is invoice discounting, which allows businesses to receive cash flow benefits by selling their invoices to third parties. Blockchain technology plays a crucial role in e-invoicing by ensuring data security and integrity through secure, direct transactions between parties in the same network. The immutable nature of blockchain eliminates the need for intermediaries and makes data access controlled and authorized.
- Real-time tracking, multi-lingual support, and mobile accessibility are other essential features that make e-invoicing an attractive option for businesses. Invoice lifecycle management, EDI integration, invoice validation, and workflow automation are additional benefits that contribute to increased efficiency and accuracy in the invoicing process. Overall, e-invoicing offers a cost-effective, secure, and efficient solution for managing business transactions.
What challenges does the E-Invoicing Industry face during its growth?
- The growth of industries is significantly impeded by the looming threat of cyber-attacks and the protection of data privacy. This challenge, which is of great concern to professionals, necessitates constant vigilance and robust security measures to mitigate potential risks and safeguard sensitive information.
- E-invoicing, a critical aspect of accounts payable automation, has gained significant traction in business-to-business (B2B) e-commerce. This digital invoicing system offers numerous benefits, including audit trails, digital signatures, electronic archiving, and tax compliance. Artificial intelligence and system integration further enhance invoice processing efficiency. However, the implementation of e-invoicing systems comes with challenges. Cybersecurity and privacy concerns pose a significant hurdle, as these systems handle sensitive organizational data. Mismanagement of data increases vulnerability to cybercrime, potentially leading to brand damage, costly lawsuits, and insurance claims.
- Technical glitches and unsecured data transfer within organizations further expose the system to hackers. Despite these challenges, the benefits of e-invoicing, such as automated reminders and substantial efficiency gains, make it a worthwhile investment. Implementation services can help organizations mitigate risks and optimize their e-invoicing systems.
Exclusive Customer Landscape
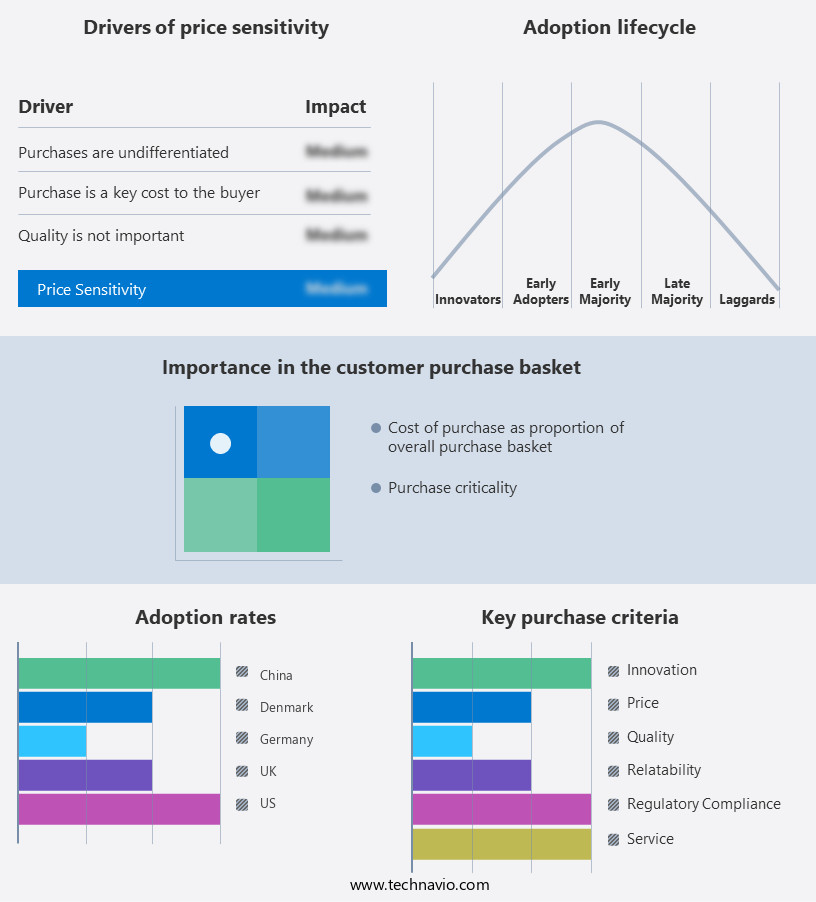
The e-invoicing market forecasting report includes the adoption lifecycle of the market, covering from the innovator’s stage to the laggard’s stage. It focuses on adoption rates in different regions based on penetration. Furthermore, the e-invoicing market report also includes key purchase criteria and drivers of price sensitivity to help companies evaluate and develop their market growth analysis strategies.
Customer Landscape
Key Companies & Market Insights
Companies are implementing various strategies, such as strategic alliances, e-invoicing market forecast, partnerships, mergers and acquisitions, geographical expansion, and product/service launches, to enhance their presence in the industry.
Basware Corp. - This company specializes in electronic invoicing solutions, providing businesses with efficient P2P processing and AP automation, enhancing financial workflows and boosting operational productivity.
The industry research and growth report includes detailed analyses of the competitive landscape of the market and information about key companies, including:
- Basware Corp.
- Cegedim SA.
- ClearGenius Solutions
- Comarch SA
- Coupa Software Inc.
- Esker SA
- International Business Machines Corp.
- iPayables Inc.
- Kofax Inc.
- Nipendo Ltd.
- PaySimple Inc.
- QuickBooks (Intuit)
- Sage Group Plc
- SAP SE
- Taulia Inc.
- Tipalti Inc.
- TradeShift Inc.
- Transcepta LLC.
- Visma Solutions Oy
- Webtel Electrosoft. Pvt. Ltd.
- Xero Ltd.
- Zoho Corp. Pvt. Ltd.
- Zycus
Qualitative and quantitative analysis of companies has been conducted to help clients understand the wider business environment as well as the strengths and weaknesses of key industry players. Data is qualitatively analyzed to categorize companies as pure play, category-focused, industry-focused, and diversified; it is quantitatively analyzed to categorize companies as dominant, leading, strong, tentative, and weak.
Recent Development and News in E-Invoicing Market
- In January 2024, global technology leader IBM announced the integration of its AI and blockchain capabilities into its E-Invoicing solution, enabling automated invoice processing and real-time fraud detection (IBM Press Release). In March 2024, German software company SAP and e-invoicing network Basware entered into a strategic partnership to offer integrated e-invoicing services to their combined customer base (SAP News Center).
- In May 2024, fintech company Tipalti raised USD110 million in a Series E funding round, further solidifying its position as a major player in the market (Tipalti Press Release). In April 2025, the European Union's eInvoicing Directive came into effect, mandating the use of standardized electronic invoicing for B2B transactions between member states (European Commission). These developments underscore the growing importance of e-invoicing solutions, driven by technological advancements, strategic partnerships, and regulatory initiatives.
Research Analyst Overview
- The market is witnessing significant advancements, driven by the integration of various technologies and processes. Validation rules ensure accuracy and compliance in invoice processing, while integration platforms facilitate seamless data exchange between systems. Security protocols safeguard sensitive financial information, and hybrid deployment models offer flexibility in implementation. Invoice retrieval and exception handling streamline the purchase-to-pay process, enabling enterprise mobility and real-time access to data. Big data and document capture enable predictive analytics, providing valuable insights for business intelligence and data analytics.
- Database management and process automation optimize workflows, reducing manual errors and increasing efficiency. Cloud computing and single sign-on (SSO) enhance accessibility and convenience. Digital transformation continues to drive the adoption of e-invoicing, with payment reconciliation and on-premise deployment options catering to diverse business needs. Risk management and data extraction ensure compliance and mitigate potential threats, making e-invoicing a crucial component of modern business operations.
Dive into Technavio’s robust research methodology, blending expert interviews, extensive data synthesis, and validated models for unparalleled E-Invoicing Market insights. See full methodology.
|
Market Scope |
|
|
Report Coverage |
Details |
|
Page number |
198 |
|
Base year |
2024 |
|
Historic period |
2019-2023 |
|
Forecast period |
2025-2029 |
|
Growth momentum & CAGR |
Accelerate at a CAGR of 29.9% |
|
Market growth 2025-2029 |
USD 36095.5 million |
|
Market structure |
Fragmented |
|
YoY growth 2024-2025(%) |
23.1 |
|
Key countries |
US, Germany, UK, France, Canada, China, Denmark, Japan, India, and South Korea |
|
Competitive landscape |
Leading Companies, Market Positioning of Companies, Competitive Strategies, and Industry Risks |
What are the Key Data Covered in this E-Invoicing Market Research and Growth Report?
- CAGR of the E-Invoicing industry during the forecast period
- Detailed information on factors that will drive the growth and forecasting between 2025 and 2029
- Precise estimation of the size of the market and its contribution of the industry in focus to the parent market
- Accurate predictions about upcoming growth and trends and changes in consumer behaviour
- Growth of the market across Europe, APAC, North America, South America, and Middle East and Africa
- Thorough analysis of the market’s competitive landscape and detailed information about companies
- Comprehensive analysis of factors that will challenge the e-invoicing market growth of industry companies
We can help! Our analysts can customize this e-invoicing market research report to meet your requirements.


