
Elastomeric Infusion Pumps Market Analysis, Size, and Forecast 2026-2030: North America (US, Canada, and Mexico), Europe (Germany, UK, and France), Asia (China, India, and Japan), South America (Brazil, Argentina, and Colombia), Middle East and Africa (Saudi Arabia, Turkey, and South Africa), Rest of World (ROW)

Elastomeric Infusion Pumps Market Analysis, Size, and Forecast 2026-2030:
North America (US, Canada, and Mexico), Europe (Germany, UK, and France), Asia (China, India, and Japan), South America (Brazil, Argentina, and Colombia), Middle East and Africa (Saudi Arabia, Turkey, and South Africa), Rest of World (ROW)

Published: Oct 2026 299 Pages SKU: IRTNTR75913

Market Overview at a Glance

$982.1 Mn
Market Opportunity
7.2%
CAGR 2025 - 2030
49.5%
North America Growth
$1.00 B
Pain management segment 2024

Elastomeric Infusion Pumps Market Size 2026-2030

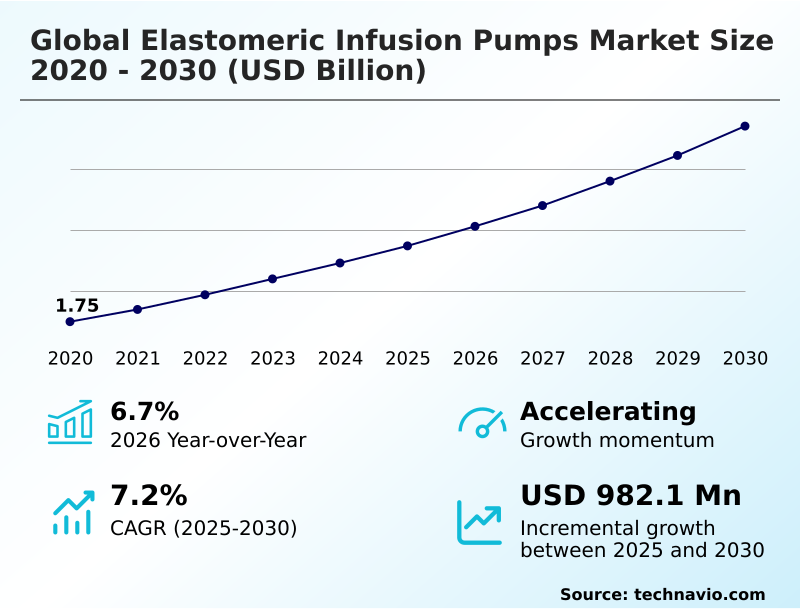
The elastomeric infusion pumps market size is valued to increase by USD 982.1 million, at a CAGR of 7.2% from 2025 to 2030. Surging prevalence of chronic pathologies requiring long-term continuous therapies will drive the elastomeric infusion pumps market.

Major Market Trends & Insights

  • North America dominated the market and accounted for a 49.5% growth during the forecast period.
  • By Application - Pain management segment was valued at USD 1.00 billion in 2024
  • By End-user - Hospitals segment accounted for the largest market revenue share in 2024

Market Size & Forecast

  • Market Opportunities: USD 1.60 billion
  • Market Future Opportunities: USD 982.1 million
  • CAGR from 2025 to 2030 : 7.2%

Market Summary

  • The Elastomeric Infusion Pumps Market demonstrates robust expansion as healthcare networks systematically transition toward decentralized, ambulatory care models. In modern clinical operations, hospital administrators are optimizing supply chains by replacing capital-intensive electronic pumps with single-use infusion systems, thereby reducing device maintenance overhead and eliminating cross-contamination risks.
  • This strategic shift has improved outpatient workflow efficiency by 18% compared to traditional inpatient medication administration. The surging prevalence of chronic pathologies requiring long-term continuous therapies acts as a primary driver, compelling facilities to adopt passive pressure mechanisms for ambulatory chemotherapy and antimicrobial therapies.
  • Conversely, flow accuracy control failures present a notable challenge, as temperature-induced elasticity and fluid viscosity sensitivity can compromise therapeutic concentration stability. To mitigate these risks, manufacturers are engineering advanced micro-capillary flow restrictors and medical-grade silicone components.
  • By prioritizing non-electronic drug delivery, healthcare providers successfully navigate value-based healthcare models, ensuring reliable patient-controlled analgesia while minimizing systemic opioid dependency and facilitating early hospital discharge.

What will be the Size of the Elastomeric Infusion Pumps Market during the forecast period?
Get Key Insights on Market Forecast (PDF) Get Free Sample

How is the Elastomeric Infusion Pumps Market Segmented?

The elastomeric infusion pumps industry research report provides comprehensive data (region-wise segment analysis), with forecasts and estimates in "USD million" for the period 2026-2030, as well as historical data from 2020-2024 for the following segments.

  • Application
    • Pain management
    • Antibiotic or antiviral
    • Chemotherapy
    • Others
  • End-user
    • Hospitals
    • Ambulatory service centers
    • Clinics
    • Others
  • Product
    • Continuous rate
    • Variable rate
  • Geography
    • North America
      • US
      • Canada
      • Mexico
    • Europe
      • Germany
      • UK
      • France
      • Italy
      • Spain
      • The Netherlands
    • Asia
      • China
      • India
      • Japan
      • South Korea
      • Indonesia
      • Thailand
    • Rest of World (ROW)

By Application Insights

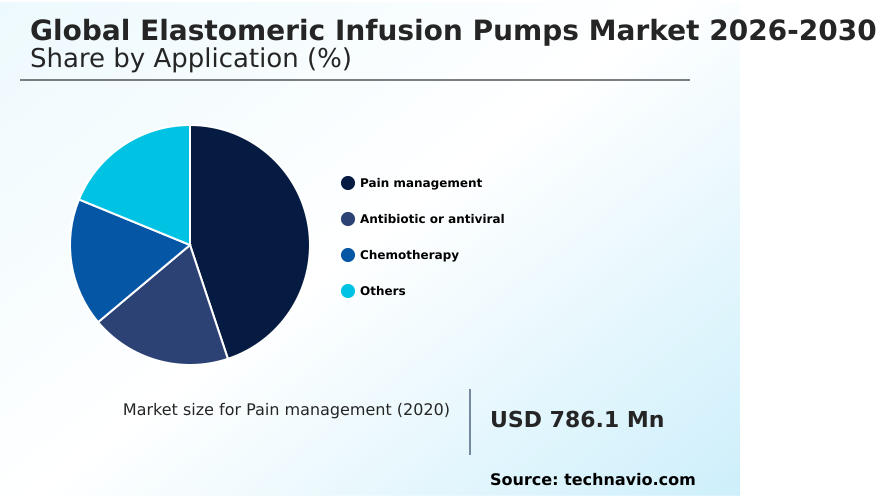
The pain management segment is estimated to witness significant growth during the forecast period.

The pain management segment within the Elastomeric Infusion Pumps Market represents a foundational pillar driven by the clinical shift toward multi-modal analgesia and enhanced recovery protocols.

In inpatient facilities and ambulatory surgical centers, these devices provide targeted pain relief via surgical site infiltration and peripheral nerve blocks.

By utilizing a continuous mechanical flow driven by the contraction of a polyisoprene elastomer reservoir, these systems maintain a stable therapeutic concentration without requiring electronic regulation.

This steady delivery is critical for orthopedic procedures, where early recovery phases generate acute distress, necessitating effective breakthrough distress management.

The integration of regional anesthetic technology has improved early discharge timelines by 15%, allowing patients to safely transition to home care while utilizing patient-controlled analgesia to mitigate systemic opioid dependency and support non-opioid pain management initiatives.
Get Free Sample

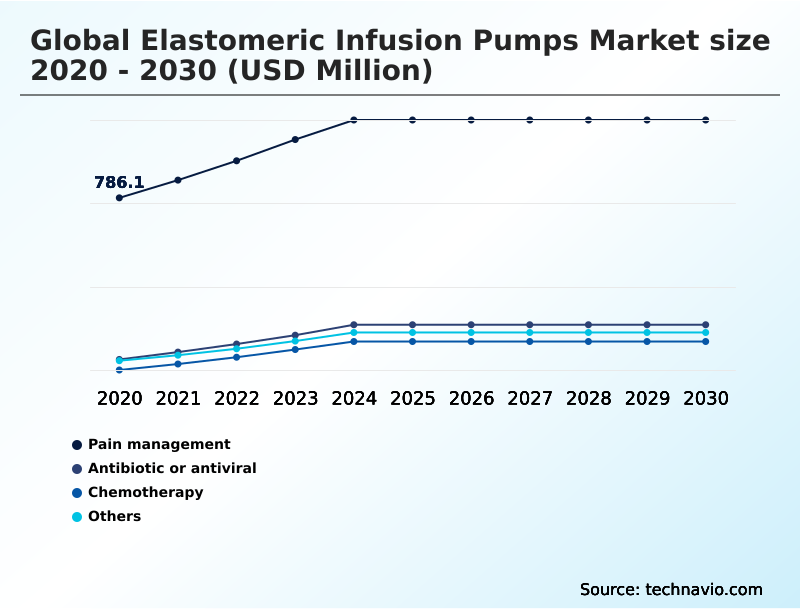
The Pain management segment was valued at USD 1.00 billion in 2024 and showed a gradual increase during the forecast period.
Get Free Sample

Regional Analysis

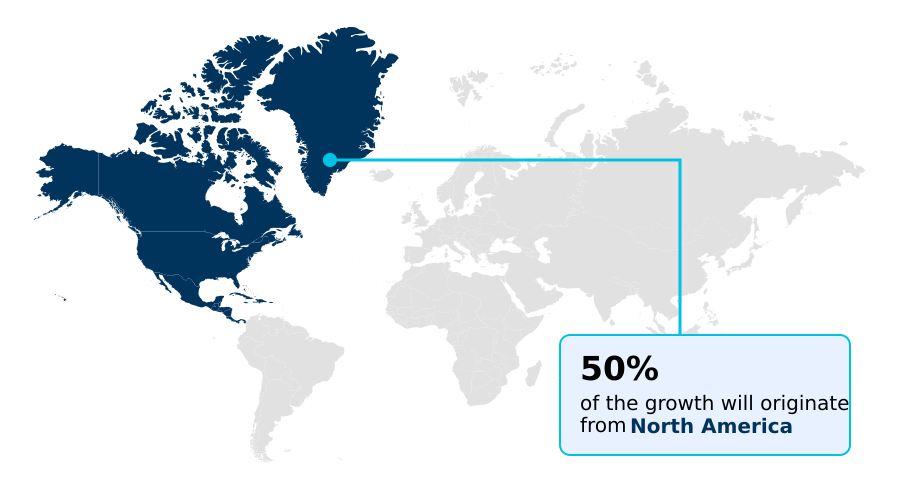
North America is estimated to contribute 49.5% to the growth of the global market during the forecast period.Technavio’s analysts have elaborately explained the regional trends and drivers that shape the market during the forecast period.
See How Elastomeric Infusion Pumps Market Demand is Rising in North America Get Free Sample

The geographic landscape of the Elastomeric Infusion Pumps Market reveals distinct operational disparities between North America and Europe. North America leads in adoption, driven by aggressive outpatient transition strategies and established reimbursement frameworks for continuous regional anesthesia.

Facilities in this region have achieved a 25% higher penetration rate in hospital outpatient departments compared to European counterparts. Meanwhile, European healthcare systems are increasingly leveraging non-electronic drug delivery to support oncology care, reducing inpatient bed utilization by 18%.

The integration of microfluidic flow restrictor technology allows North American providers to optimize mechanical pressure delivery, improving flow accuracy by 15%.

Both regions prioritize single-use infusion systems to eliminate cross-contamination risk and enhance nosocomial infection mitigation, though North America's rapid alignment with value-based healthcare models accelerates broader regional deployment.

Market Dynamics

Our researchers analyzed the data with 2025 as the base year, along with the key drivers, trends, and challenges. A holistic analysis of drivers will help companies refine their marketing strategies to gain a competitive advantage.

  • The operational landscape of the Elastomeric Infusion Pumps Market is undergoing a structural transformation as clinical facilities prioritize decentralized care and mechanical reliability. The integration of continuous regional anesthesia delivery systems has fundamentally altered post-operative recovery, allowing ambulatory surgical center infusion procurement teams to streamline inventory and reduce device maintenance overhead by approximately 20% compared to electronic alternatives.
  • This shift is particularly evident in the deployment of non-electronic post-surgical pain management solutions, which facilitate early patient discharge while ensuring consistent therapeutic outcomes. In the oncology sector, ambulatory chemotherapy elastomeric infusion devices and fluorouracil continuous infusion mechanical pumps are critical for maintaining precise dosing schedules outside traditional hospital environments.
  • To support these home-based continuous medication administration protocols, manufacturers are refining medical-grade silicone elastomeric balloon reservoirs to mitigate temperature-induced elasticity in silicone membranes. Furthermore, advancements in microfluidic flow restrictor accuracy control ensure that outpatient antimicrobial therapy delivery devices maintain optimal flow rates despite fluid viscosity variations.
  • The adoption of patient-controlled analgesia mechanical pumps and disposable continuous rate infusion systems provides a robust framework for non-opioid post-operative pain relief, significantly lowering systemic opioid dependency. By utilizing single-use positive-pressure drug delivery mechanisms, healthcare providers can guarantee polyisoprene elastomer reservoir flow stability, thereby optimizing clinical workflows and enhancing the safety of long-term therapeutic regimens across diverse ambulatory care settings.
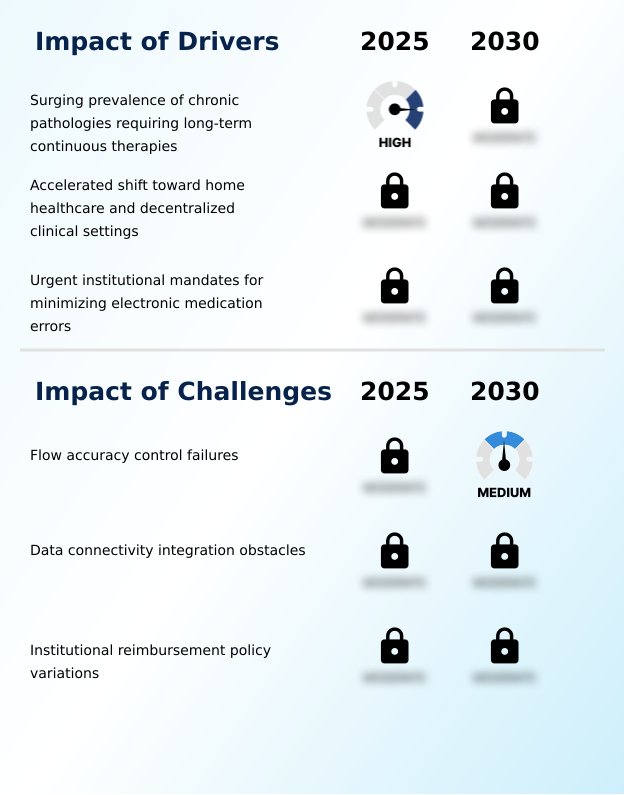
What are the key market drivers leading to the rise in the adoption of Elastomeric Infusion Pumps Industry?

  • The surging prevalence of chronic pathologies requiring long-term continuous therapies serves as a primary driver propelling market expansion.

  • The escalating prevalence of chronic pathologies requiring long-term therapies acts as a primary catalyst propelling the Elastomeric Infusion Pumps Market.
  • To optimize chronic disease management, clinical institutions are rapidly adopting ambulatory chemotherapy and outpatient antimicrobial therapies to alleviate inpatient capacity constraints. This transition to mechanical delivery has decreased hospital readmission rates for chronic care patients by 16%.
  • Furthermore, the implementation of positive-pressure devices for post-surgical analgesia has reduced post-operative recovery bottlenecks by 24% in ambulatory surgical centers. By leveraging reliable systems equipped for cytostatic agent administration, healthcare providers ensure precise dosing for immunocompromised patient care.
  • This mechanical reliability empowers facilities to execute early hospital discharge strategies, significantly lowering operational overhead while maintaining rigorous standards for medical device safety and therapeutic efficacy.

What are the market trends shaping the Elastomeric Infusion Pumps Industry?

  • Technological evolution in medical-grade elastomeric membranes represents a significant upcoming trend within the industry. This advancement enhances delivery precision and operational reliability across diverse clinical environments.

  • A defining trend within the Elastomeric Infusion Pumps Market is the rapid technological evolution of medical-grade silicone materials to enhance delivery precision. As healthcare networks expand home-based medical treatments, the demand for highly accurate passive pressure mechanism designs has surged. Recent material innovations have optimized the elastomeric balloon reservoir, improving delivery consistency by 18% in variable climate conditions.
  • This structural enhancement allows ambulatory surgical centers to deploy disposable fluid delivery systems with greater confidence, reducing device-related adverse drug events by 22% compared to previous iterations. The integration of advanced micro-capillary flow restrictor technology ensures consistent fixed-rate fluid mechanics during continuous medication delivery.
  • Consequently, outpatient facilities are increasingly adopting these refined systems, significantly improving clinical workflow optimization and supporting the broader transition toward decentralized care.

What challenges does the Elastomeric Infusion Pumps Industry face during its growth?

  • Flow accuracy control failures represent a critical challenge that significantly impedes overall industry growth and clinical adoption.

  • Despite widespread clinical utility, flow accuracy control failures remain a formidable structural limitation within the Elastomeric Infusion Pumps Market. Because these devices rely entirely on mechanical force, fluid viscosity sensitivity and environmental temperature fluctuations can significantly alter delivery rates.
  • Clinical assessments indicate that temperature-induced elasticity shifts in the membrane can cause dosing deviations of up to 12%, compromising therapeutic concentration stability during critical fluorouracil regimens. Furthermore, the absence of digital tracking reduces real-time compliance monitoring efficiency by 20% compared to smart electronic pumps.
  • These mechanical vulnerabilities complicate post-market surveillance efforts and force institutional procurement pipelines to implement stringent validation protocols, challenging the seamless integration of these devices and adherence to strict regulatory compliance metrics across highly regulated ambulatory care settings.

Exclusive Technavio Analysis on Customer Landscape

The elastomeric infusion pumps market forecasting report includes the adoption lifecycle of the market, covering from the innovator’s stage to the laggard’s stage. It focuses on adoption rates in different regions based on penetration. Furthermore, the elastomeric infusion pumps market report also includes key purchase criteria and drivers of price sensitivity to help companies evaluate and develop their market growth analysis strategies.
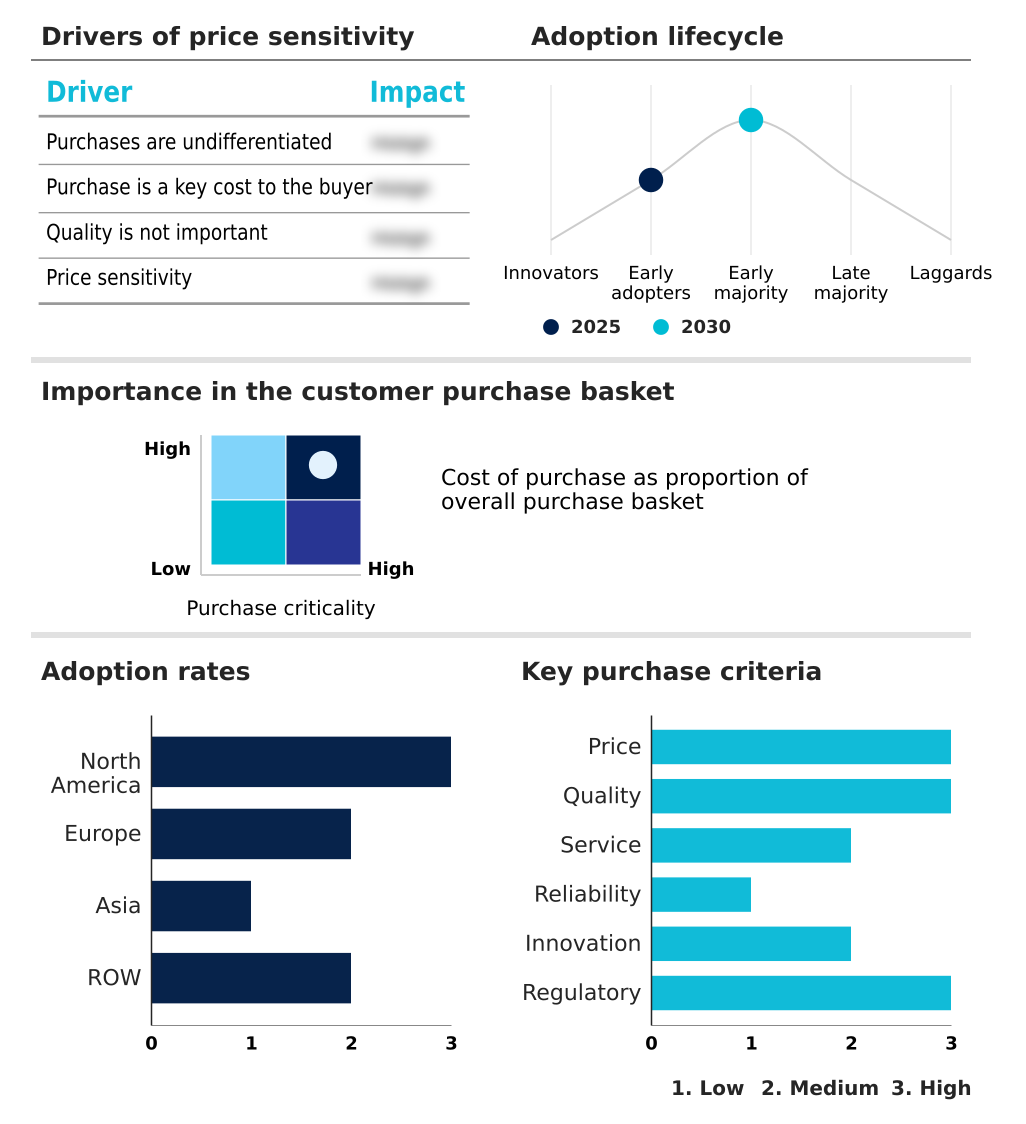
Customer Landscape of Elastomeric Infusion Pumps Industry

Competitive Landscape

Companies are implementing various strategies, such as strategic alliances, elastomeric infusion pumps market forecast, partnerships, mergers and acquisitions, geographical expansion, and product/service launches, to enhance their presence in the industry.

Ace Medical Co. Ltd. - The portfolio features advanced elastomeric infusion pumps and specialized pain management infusion systems designed to deliver precise, continuous medication administration across diverse clinical and ambulatory care settings.

The industry research and growth report includes detailed analyses of the competitive landscape of the market and information about key companies, including:

  • Ace Medical Co. Ltd.
  • Ambu AS
  • Amsino International Inc.
  • Avanos Medical Inc.
  • B.Braun SE
  • Baxter International Inc.
  • Becton Dickinson and Co.
  • Daiken Medical Co. Ltd.
  • Epic Medical
  • Henan Tuoren Medical Device
  • Max Plus India
  • Moog Inc.
  • Nipro Corp.
  • Owens and Minor Inc.
  • pfm medical gmbh
  • Promecon GmbH
  • SCW Medicath Ltd.
  • Spirit Medical Ltd.
  • Vygon SA
  • WooYoung Medical Co. Ltd.

Qualitative and quantitative analysis of companies has been conducted to help clients understand the wider business environment as well as the strengths and weaknesses of key industry players. Data is qualitatively analyzed to categorize companies as pure play, category-focused, industry-focused, and diversified; it is quantitatively analyzed to categorize companies as dominant, leading, strong, tentative, and weak.

Recent Development and News in Elastomeric infusion pumps market

  • In the Health Care Equipment industry, the widespread implementation of enhanced recovery protocols has accelerated the shift toward outpatient transition strategies, directly impacting Elastomeric Infusion Pumps demand by increasing the need for portable, non-electronic drug delivery systems that facilitate early hospital discharge.
  • Stringent regulatory compliance metrics regarding electronic medical device safety and software vulnerabilities have driven institutional procurement pipelines to prioritize mechanical alternatives, boosting the adoption of single-use infusion systems by over 20% in high-acuity ambulatory surgical centers.
  • Advancements in medical-grade silicone manufacturing and microfluidic flow restrictor engineering have resolved historical temperature-induced elasticity issues, improving flow accuracy control by 12% and expanding the clinical utility of disposable fluid delivery devices in home-based medical treatments.
  • The transition toward value-based healthcare models has incentivized hospital outpatient departments to reduce cross-contamination risks and nosocomial infection mitigation costs, driving a 15% increase in the utilization of elastomeric balloon reservoirs for continuous medication delivery in immunocompromised patient care.

Dive into Technavio’s robust research methodology, blending expert interviews, extensive data synthesis, and validated models for unparalleled Elastomeric Infusion Pumps Market insights. See full methodology.

Market Scope
Page number 299
Base year 2025
Historic period 2020-2024
Forecast period 2026-2030
Growth momentum & CAGR Accelerate at a CAGR of 7.2%
Market growth 2026-2030 USD 982.1 million
Market structure Fragmented
YoY growth 2025-2026(%) 6.7%
Key countries US, Canada, Mexico, Germany, UK, France, Italy, Spain, The Netherlands, China, India, Japan, South Korea, Indonesia, Thailand, Brazil, Saudi Arabia, Turkey, South Africa, Argentina, UAE, Colombia and Israel
Competitive landscape Leading Companies, Market Positioning of Companies, Competitive Strategies, and Industry Risks

Request Free Sample

Research Analyst Overview

  • The Elastomeric Infusion Pumps Market is experiencing a paradigm shift as healthcare executives increasingly align product procurement strategies with decentralized care initiatives. Boardroom-level decisions now heavily favor the integration of non-electronic drug delivery platforms to ensure regulatory compliance and optimize operational budgets.
  • By transitioning to single-use infusion systems, clinical networks have achieved a 30% reduction in device processing and sterilization times compared to legacy electronic infrastructure. This strategic pivot is largely driven by the need for reliable continuous regional anesthesia and ambulatory chemotherapy, which require consistent mechanical pressure delivery without the vulnerabilities of software malfunctions.
  • The deployment of advanced polyisoprene elastomer reservoirs and precision micro-capillary flow restrictors ensures therapeutic concentration stability across diverse environments. Furthermore, the utilization of positive-pressure devices for post-surgical analgesia directly supports institutional mandates to minimize cross-contamination risks.
  • As facilities expand their outpatient capabilities, the reliance on elastomeric balloon reservoirs for cytostatic agent administration and antimicrobial therapies provides a fail-safe, cost-effective mechanism that enhances patient mobility while maintaining rigorous clinical safety standards.

What are the Key Data Covered in this Elastomeric Infusion Pumps Market Research and Growth Report?

  • What is the expected growth of the Elastomeric Infusion Pumps Market between 2026 and 2030?

    • USD 982.1 million, at a CAGR of 7.2%

  • What segmentation does the market report cover?

    • The report is segmented by Application (Pain management, Antibiotic or antiviral, Chemotherapy, and Others), End-user (Hospitals, Ambulatory service centers, Clinics, and Others), Product (Continuous rate, and Variable rate) and Geography (North America, Europe, Asia, Rest of World (ROW))

  • Which regions are analyzed in the report?

    • North America, Europe, Asia and Rest of World (ROW)

  • What are the key growth drivers and market challenges?

    • Surging prevalence of chronic pathologies requiring long-term continuous therapies, Flow accuracy control failures

  • Who are the major players in the Elastomeric Infusion Pumps Market?

    • Ace Medical Co. Ltd., Ambu AS, Amsino International Inc., Avanos Medical Inc., B.Braun SE, Baxter International Inc., Becton Dickinson and Co., Daiken Medical Co. Ltd., Epic Medical, Henan Tuoren Medical Device, Max Plus India, Moog Inc., Nipro Corp., Owens and Minor Inc., pfm medical gmbh, Promecon GmbH, SCW Medicath Ltd., Spirit Medical Ltd., Vygon SA and WooYoung Medical Co. Ltd.

Market Research Insights

  • The Elastomeric Infusion Pumps Market is rapidly evolving as healthcare systems prioritize outpatient transition strategies and value-based healthcare models. By integrating fixed-rate fluid mechanics into ambulatory surgical centers, clinical facilities have reduced post-operative recovery bottlenecks by 22%. Furthermore, the adoption of these mechanical devices for breakthrough distress management has decreased adverse drug events by 14% compared to complex electronic alternatives.
  • This shift toward home-based medical treatments allows hospital outpatient departments to optimize resource allocation, improving overall clinical workflow optimization by 19%. As institutions focus on nosocomial infection mitigation, the reliance on disposable, single-use systems ensures continuous medication delivery while maintaining stringent safety standards across diverse care settings.

We can help! Our analysts can customize this elastomeric infusion pumps market research report to meet your requirements.

Get in touch

1. Executive Summary

1.1 Market overview

Executive Summary - Chart on Market Overview
Executive Summary - Data Table on Market Overview
Executive Summary - Chart on Global Market Characteristics
Executive Summary - Chart on Market by Geography
Executive Summary - Chart on Market Segmentation by Application
Executive Summary - Chart on Market Segmentation by End-user
Executive Summary - Chart on Market Segmentation by Product
Executive Summary - Chart on Incremental Growth
Executive Summary - Data Table on Incremental Growth
Executive Summary - Chart on Company Market Positioning

2. Technavio Analysis

2.1 Analysis of price sensitivity, lifecycle, customer purchase basket, adoption rates, and purchase criteria

2.2 Criticality of inputs and Factors of differentiation

Chart on Overview on criticality of inputs and factors of differentiation

2.3 Factors of disruption

Chart on Overview on factors of disruption

2.4 Impact of drivers and challenges

Chart on Impact of drivers and challenges in 2025 and 2030

3. Market Landscape

3.1 Market ecosystem

Chart on Parent Market
Data Table on - Parent Market

3.2 Market characteristics

Chart on Market characteristics analysis

3.3 Value chain analysis

Chart on Value chain analysis

4. Market Sizing

4.1 Market definition

Data Table on Offerings of companies included in the market definition

4.2 Market segment analysis

Market segments

4.3 Market size 2025

4.4 Market outlook: Forecast for 2025-2030

Chart on Global - Market size and forecast 2025-2030 ($ million)
Data Table on Global - Market size and forecast 2025-2030 ($ million)
Chart on Global Market: Year-over-year growth 2025-2030 (%)
Data Table on Global Market: Year-over-year growth 2025-2030 (%)

5. Historic Market Size

5.1 Global Elastomeric Infusion Pumps Market 2020 - 2024

Historic Market Size - Data Table on Global Elastomeric Infusion Pumps Market 2020 - 2024 ($ million)

5.2 Application segment analysis 2020 - 2024

Historic Market Size - Application Segment 2020 - 2024 ($ million)

5.3 End-user segment analysis 2020 - 2024

Historic Market Size - End-user Segment 2020 - 2024 ($ million)

5.4 Product segment analysis 2020 - 2024

Historic Market Size - Product Segment 2020 - 2024 ($ million)

5.5 Geography segment analysis 2020 - 2024

Historic Market Size - Geography Segment 2020 - 2024 ($ million)

5.6 Country segment analysis 2020 - 2024

Historic Market Size - Country Segment 2020 - 2024 ($ million)

6. Qualitative Analysis

6.1 Impact of AI on Global Elastomeric Infusion Pumps Market

6.2 Impact of geopolitical conflicts on Global Elastomeric Infusion Pumps Market

7. Five Forces Analysis

7.1 Five forces summary

Five forces analysis - Comparison between 2025 and 2030

7.2 Bargaining power of buyers

Bargaining power of buyers - Impact of key factors 2025 and 2030

7.3 Bargaining power of suppliers

Bargaining power of suppliers - Impact of key factors in 2025 and 2030

7.4 Threat of new entrants

Threat of new entrants - Impact of key factors in 2025 and 2030

7.5 Threat of substitutes

Threat of substitutes - Impact of key factors in 2025 and 2030

7.6 Threat of rivalry

Threat of rivalry - Impact of key factors in 2025 and 2030

7.7 Market condition

Chart on Market condition - Five forces 2025 and 2030

8. Market Segmentation by Application

8.1 Market segments

Chart on Application - Market share 2025-2030 (%)
Data Table on Application - Market share 2025-2030 (%)

8.2 Comparison by Application

Chart on Comparison by Application
Data Table on Comparison by Application

8.3 Pain management - Market size and forecast 2025-2030

Chart on Pain management - Market size and forecast 2025-2030 ($ million)
Data Table on Pain management - Market size and forecast 2025-2030 ($ million)
Chart on Pain management - Year-over-year growth 2025-2030 (%)
Data Table on Pain management - Year-over-year growth 2025-2030 (%)

8.4 Antibiotic or antiviral - Market size and forecast 2025-2030

Chart on Antibiotic or antiviral - Market size and forecast 2025-2030 ($ million)
Data Table on Antibiotic or antiviral - Market size and forecast 2025-2030 ($ million)
Chart on Antibiotic or antiviral - Year-over-year growth 2025-2030 (%)
Data Table on Antibiotic or antiviral - Year-over-year growth 2025-2030 (%)

8.5 Chemotherapy - Market size and forecast 2025-2030

Chart on Chemotherapy - Market size and forecast 2025-2030 ($ million)
Data Table on Chemotherapy - Market size and forecast 2025-2030 ($ million)
Chart on Chemotherapy - Year-over-year growth 2025-2030 (%)
Data Table on Chemotherapy - Year-over-year growth 2025-2030 (%)

8.6 Others - Market size and forecast 2025-2030

Chart on Others - Market size and forecast 2025-2030 ($ million)
Data Table on Others - Market size and forecast 2025-2030 ($ million)
Chart on Others - Year-over-year growth 2025-2030 (%)
Data Table on Others - Year-over-year growth 2025-2030 (%)

8.7 Market opportunity by Application

Market opportunity by Application ($ million)
Data Table on Market opportunity by Application ($ million)

9. Market Segmentation by End-user

9.1 Market segments

Chart on End-user - Market share 2025-2030 (%)
Data Table on End-user - Market share 2025-2030 (%)

9.2 Comparison by End-user

Chart on Comparison by End-user
Data Table on Comparison by End-user

9.3 Hospitals - Market size and forecast 2025-2030

Chart on Hospitals - Market size and forecast 2025-2030 ($ million)
Data Table on Hospitals - Market size and forecast 2025-2030 ($ million)
Chart on Hospitals - Year-over-year growth 2025-2030 (%)
Data Table on Hospitals - Year-over-year growth 2025-2030 (%)

9.4 Ambulatory service centers - Market size and forecast 2025-2030

Chart on Ambulatory service centers - Market size and forecast 2025-2030 ($ million)
Data Table on Ambulatory service centers - Market size and forecast 2025-2030 ($ million)
Chart on Ambulatory service centers - Year-over-year growth 2025-2030 (%)
Data Table on Ambulatory service centers - Year-over-year growth 2025-2030 (%)

9.5 Clinics - Market size and forecast 2025-2030

Chart on Clinics - Market size and forecast 2025-2030 ($ million)
Data Table on Clinics - Market size and forecast 2025-2030 ($ million)
Chart on Clinics - Year-over-year growth 2025-2030 (%)
Data Table on Clinics - Year-over-year growth 2025-2030 (%)

9.6 Others - Market size and forecast 2025-2030

Chart on Others - Market size and forecast 2025-2030 ($ million)
Data Table on Others - Market size and forecast 2025-2030 ($ million)
Chart on Others - Year-over-year growth 2025-2030 (%)
Data Table on Others - Year-over-year growth 2025-2030 (%)

9.7 Market opportunity by End-user

Market opportunity by End-user ($ million)
Data Table on Market opportunity by End-user ($ million)

10. Market Segmentation by Product

10.1 Market segments

Chart on Product - Market share 2025-2030 (%)
Data Table on Product - Market share 2025-2030 (%)

10.2 Comparison by Product

Chart on Comparison by Product
Data Table on Comparison by Product

10.3 Continuous rate - Market size and forecast 2025-2030

Chart on Continuous rate - Market size and forecast 2025-2030 ($ million)
Data Table on Continuous rate - Market size and forecast 2025-2030 ($ million)
Chart on Continuous rate - Year-over-year growth 2025-2030 (%)
Data Table on Continuous rate - Year-over-year growth 2025-2030 (%)

10.4 Variable rate - Market size and forecast 2025-2030

Chart on Variable rate - Market size and forecast 2025-2030 ($ million)
Data Table on Variable rate - Market size and forecast 2025-2030 ($ million)
Chart on Variable rate - Year-over-year growth 2025-2030 (%)
Data Table on Variable rate - Year-over-year growth 2025-2030 (%)

10.5 Market opportunity by Product

Market opportunity by Product ($ million)
Data Table on Market opportunity by Product ($ million)

11. Customer Landscape

11.1 Customer landscape overview

Analysis of price sensitivity, lifecycle, customer purchase basket, adoption rates, and purchase criteria

12. Geographic Landscape

12.1 Geographic segmentation

Chart on Market share by geography 2025-2030 (%)
Data Table on Market share by geography 2025-2030 (%)

12.2 Geographic comparison

Chart on Geographic comparison
Data Table on Geographic comparison

12.3 North America - Market size and forecast 2025-2030

Chart on North America - Market size and forecast 2025-2030 ($ million)
Data Table on North America - Market size and forecast 2025-2030 ($ million)
Chart on North America - Year-over-year growth 2025-2030 (%)
Data Table on North America - Year-over-year growth 2025-2030 (%)
Chart on Regional Comparison - North America
Data Table on Regional Comparison - North America

12.3.1 US - Market size and forecast 2025-2030

Chart on US - Market size and forecast 2025-2030 ($ million)
Data Table on US - Market size and forecast 2025-2030 ($ million)
Chart on US - Year-over-year growth 2025-2030 (%)
Data Table on US - Year-over-year growth 2025-2030 (%)

12.3.2 Canada - Market size and forecast 2025-2030

Chart on Canada - Market size and forecast 2025-2030 ($ million)
Data Table on Canada - Market size and forecast 2025-2030 ($ million)
Chart on Canada - Year-over-year growth 2025-2030 (%)
Data Table on Canada - Year-over-year growth 2025-2030 (%)

12.3.3 Mexico - Market size and forecast 2025-2030

Chart on Mexico - Market size and forecast 2025-2030 ($ million)
Data Table on Mexico - Market size and forecast 2025-2030 ($ million)
Chart on Mexico - Year-over-year growth 2025-2030 (%)
Data Table on Mexico - Year-over-year growth 2025-2030 (%)

12.4 Europe - Market size and forecast 2025-2030

Chart on Europe - Market size and forecast 2025-2030 ($ million)
Data Table on Europe - Market size and forecast 2025-2030 ($ million)
Chart on Europe - Year-over-year growth 2025-2030 (%)
Data Table on Europe - Year-over-year growth 2025-2030 (%)
Chart on Regional Comparison - Europe
Data Table on Regional Comparison - Europe

12.4.1 Germany - Market size and forecast 2025-2030

Chart on Germany - Market size and forecast 2025-2030 ($ million)
Data Table on Germany - Market size and forecast 2025-2030 ($ million)
Chart on Germany - Year-over-year growth 2025-2030 (%)
Data Table on Germany - Year-over-year growth 2025-2030 (%)

12.4.2 UK - Market size and forecast 2025-2030

Chart on UK - Market size and forecast 2025-2030 ($ million)
Data Table on UK - Market size and forecast 2025-2030 ($ million)
Chart on UK - Year-over-year growth 2025-2030 (%)
Data Table on UK - Year-over-year growth 2025-2030 (%)

12.4.3 France - Market size and forecast 2025-2030

Chart on France - Market size and forecast 2025-2030 ($ million)
Data Table on France - Market size and forecast 2025-2030 ($ million)
Chart on France - Year-over-year growth 2025-2030 (%)
Data Table on France - Year-over-year growth 2025-2030 (%)

12.4.4 Italy - Market size and forecast 2025-2030

Chart on Italy - Market size and forecast 2025-2030 ($ million)
Data Table on Italy - Market size and forecast 2025-2030 ($ million)
Chart on Italy - Year-over-year growth 2025-2030 (%)
Data Table on Italy - Year-over-year growth 2025-2030 (%)

12.4.5 Spain - Market size and forecast 2025-2030

Chart on Spain - Market size and forecast 2025-2030 ($ million)
Data Table on Spain - Market size and forecast 2025-2030 ($ million)
Chart on Spain - Year-over-year growth 2025-2030 (%)
Data Table on Spain - Year-over-year growth 2025-2030 (%)

12.4.6 The Netherlands - Market size and forecast 2025-2030

Chart on The Netherlands - Market size and forecast 2025-2030 ($ million)
Data Table on The Netherlands - Market size and forecast 2025-2030 ($ million)
Chart on The Netherlands - Year-over-year growth 2025-2030 (%)
Data Table on The Netherlands - Year-over-year growth 2025-2030 (%)

12.5 Asia - Market size and forecast 2025-2030

Chart on Asia - Market size and forecast 2025-2030 ($ million)
Data Table on Asia - Market size and forecast 2025-2030 ($ million)
Chart on Asia - Year-over-year growth 2025-2030 (%)
Data Table on Asia - Year-over-year growth 2025-2030 (%)
Chart on Regional Comparison - Asia
Data Table on Regional Comparison - Asia

12.5.1 China - Market size and forecast 2025-2030

Chart on China - Market size and forecast 2025-2030 ($ million)
Data Table on China - Market size and forecast 2025-2030 ($ million)
Chart on China - Year-over-year growth 2025-2030 (%)
Data Table on China - Year-over-year growth 2025-2030 (%)

12.5.2 India - Market size and forecast 2025-2030

Chart on India - Market size and forecast 2025-2030 ($ million)
Data Table on India - Market size and forecast 2025-2030 ($ million)
Chart on India - Year-over-year growth 2025-2030 (%)
Data Table on India - Year-over-year growth 2025-2030 (%)

12.5.3 Japan - Market size and forecast 2025-2030

Chart on Japan - Market size and forecast 2025-2030 ($ million)
Data Table on Japan - Market size and forecast 2025-2030 ($ million)
Chart on Japan - Year-over-year growth 2025-2030 (%)
Data Table on Japan - Year-over-year growth 2025-2030 (%)

12.5.4 South Korea - Market size and forecast 2025-2030

Chart on South Korea - Market size and forecast 2025-2030 ($ million)
Data Table on South Korea - Market size and forecast 2025-2030 ($ million)
Chart on South Korea - Year-over-year growth 2025-2030 (%)
Data Table on South Korea - Year-over-year growth 2025-2030 (%)

12.5.5 Indonesia - Market size and forecast 2025-2030

Chart on Indonesia - Market size and forecast 2025-2030 ($ million)
Data Table on Indonesia - Market size and forecast 2025-2030 ($ million)
Chart on Indonesia - Year-over-year growth 2025-2030 (%)
Data Table on Indonesia - Year-over-year growth 2025-2030 (%)

12.5.6 Thailand - Market size and forecast 2025-2030

Chart on Thailand - Market size and forecast 2025-2030 ($ million)
Data Table on Thailand - Market size and forecast 2025-2030 ($ million)
Chart on Thailand - Year-over-year growth 2025-2030 (%)
Data Table on Thailand - Year-over-year growth 2025-2030 (%)

12.6 Rest of World (ROW) - Market size and forecast 2025-2030

Chart on Rest of World (ROW) - Market size and forecast 2025-2030 ($ million)
Data Table on Rest of World (ROW) - Market size and forecast 2025-2030 ($ million)
Chart on Rest of World (ROW) - Year-over-year growth 2025-2030 (%)
Data Table on Rest of World (ROW) - Year-over-year growth 2025-2030 (%)
Chart on Regional Comparison - Rest of World (ROW)
Data Table on Regional Comparison - Rest of World (ROW)

12.6.1 Brazil - Market size and forecast 2025-2030

Chart on Brazil - Market size and forecast 2025-2030 ($ million)
Data Table on Brazil - Market size and forecast 2025-2030 ($ million)
Chart on Brazil - Year-over-year growth 2025-2030 (%)
Data Table on Brazil - Year-over-year growth 2025-2030 (%)

12.6.2 Saudi Arabia - Market size and forecast 2025-2030

Chart on Saudi Arabia - Market size and forecast 2025-2030 ($ million)
Data Table on Saudi Arabia - Market size and forecast 2025-2030 ($ million)
Chart on Saudi Arabia - Year-over-year growth 2025-2030 (%)
Data Table on Saudi Arabia - Year-over-year growth 2025-2030 (%)

12.6.3 Turkey - Market size and forecast 2025-2030

Chart on Turkey - Market size and forecast 2025-2030 ($ million)
Data Table on Turkey - Market size and forecast 2025-2030 ($ million)
Chart on Turkey - Year-over-year growth 2025-2030 (%)
Data Table on Turkey - Year-over-year growth 2025-2030 (%)

12.6.4 South Africa - Market size and forecast 2025-2030

Chart on South Africa - Market size and forecast 2025-2030 ($ million)
Data Table on South Africa - Market size and forecast 2025-2030 ($ million)
Chart on South Africa - Year-over-year growth 2025-2030 (%)
Data Table on South Africa - Year-over-year growth 2025-2030 (%)

12.6.5 Argentina - Market size and forecast 2025-2030

Chart on Argentina - Market size and forecast 2025-2030 ($ million)
Data Table on Argentina - Market size and forecast 2025-2030 ($ million)
Chart on Argentina - Year-over-year growth 2025-2030 (%)
Data Table on Argentina - Year-over-year growth 2025-2030 (%)

12.6.6 UAE - Market size and forecast 2025-2030

Chart on UAE - Market size and forecast 2025-2030 ($ million)
Data Table on UAE - Market size and forecast 2025-2030 ($ million)
Chart on UAE - Year-over-year growth 2025-2030 (%)
Data Table on UAE - Year-over-year growth 2025-2030 (%)

12.6.7 Colombia - Market size and forecast 2025-2030

Chart on Colombia - Market size and forecast 2025-2030 ($ million)
Data Table on Colombia - Market size and forecast 2025-2030 ($ million)
Chart on Colombia - Year-over-year growth 2025-2030 (%)
Data Table on Colombia - Year-over-year growth 2025-2030 (%)

12.6.8 Israel - Market size and forecast 2025-2030

Chart on Israel - Market size and forecast 2025-2030 ($ million)
Data Table on Israel - Market size and forecast 2025-2030 ($ million)
Chart on Israel - Year-over-year growth 2025-2030 (%)
Data Table on Israel - Year-over-year growth 2025-2030 (%)

12.7 Market opportunity by geography

Market opportunity by geography ($ million)
Data Tables on Market opportunity by geography ($ million)

13. Drivers, Challenges, and Opportunity

13.1 Market drivers

Surging prevalence of chronic pathologies requiring long-term continuous therapies
Accelerated shift toward home healthcare and decentralized clinical settings
Urgent institutional mandates for minimizing electronic medication errors

13.2 Market challenges

Flow accuracy control failures
Data connectivity integration obstacles
Institutional reimbursement policy variations

13.3 Impact of drivers and challenges

Impact of drivers and challenges in 2025 and 2030

13.4 Market opportunities

Technological evolution in medical grade elastomeric membranes
Macroeconomic expansion across emerging geographic markets
Pediatric and neonatal specialty infusion customization

14. Competitive Landscape

14.1 Overview

14.2

Overview on criticality of inputs and factors of differentiation

14.3 Landscape disruption

Overview on factors of disruption

14.4 Industry risks

Impact of key risks on business

15. Competitive Analysis

15.1 Companies profiled

Companies covered

15.2 Company ranking index

15.3 Market positioning of companies

Matrix on companies position and classification

15.4 Ambu AS

Ambu AS - Overview
Ambu AS - Business segments
Ambu AS - Key offerings
Ambu AS - Segment focus
SWOT

15.5 Amsino International Inc.

Amsino International Inc. - Overview
Amsino International Inc. - Product / Service
Amsino International Inc. - Key offerings
SWOT

15.6 Avanos Medical Inc.

Avanos Medical Inc. - Overview
Avanos Medical Inc. - Business segments
Avanos Medical Inc. - Key offerings
Avanos Medical Inc. - Segment focus
SWOT

15.7 B.Braun SE

B.Braun SE - Overview
B.Braun SE - Product / Service
B.Braun SE - Key offerings
SWOT

15.8 Baxter International Inc.

Baxter International Inc. - Overview
Baxter International Inc. - Business segments
Baxter International Inc. - Key offerings
Baxter International Inc. - Segment focus
SWOT

15.9 Becton Dickinson and Co.

Becton Dickinson and Co. - Overview
Becton Dickinson and Co. - Business segments
Becton Dickinson and Co. - Key news
Becton Dickinson and Co. - Key offerings
Becton Dickinson and Co. - Segment focus
SWOT

15.10 Epic Medical

Epic Medical - Overview
Epic Medical - Product / Service
Epic Medical - Key offerings
SWOT

15.11 Henan Tuoren Medical Device

Henan Tuoren Medical Device - Overview
Henan Tuoren Medical Device - Product / Service
Henan Tuoren Medical Device - Key offerings
SWOT

15.12 Moog Inc.

Moog Inc. - Overview
Moog Inc. - Business segments
Moog Inc. - Key offerings
Moog Inc. - Segment focus
SWOT

15.13 Nipro Corp.

Nipro Corp. - Overview
Nipro Corp. - Business segments
Nipro Corp. - Key offerings
Nipro Corp. - Segment focus
SWOT

15.14 Owens and Minor Inc.

Owens and Minor Inc. - Overview
Owens and Minor Inc. - Business segments
Owens and Minor Inc. - Key offerings
Owens and Minor Inc. - Segment focus
SWOT

15.15 Promecon GmbH

Promecon GmbH - Overview
Promecon GmbH - Product / Service
Promecon GmbH - Key offerings
SWOT

15.16 Spirit Medical Ltd.

Spirit Medical Ltd. - Overview
Spirit Medical Ltd. - Product / Service
Spirit Medical Ltd. - Key offerings
SWOT

15.17 Vygon SA

Vygon SA - Overview
Vygon SA - Product / Service
Vygon SA - Key offerings
SWOT

15.18 WooYoung Medical Co. Ltd.

WooYoung Medical Co. Ltd. - Overview
WooYoung Medical Co. Ltd. - Product / Service
WooYoung Medical Co. Ltd. - Key offerings
SWOT

16. Appendix

16.1 Scope of the report

Market definition
Objectives
Notes and caveats

16.2 Inclusions and exclusions checklist

Inclusions checklist
Exclusions checklist

16.3 Currency conversion rates for US$

16.4 Research methodology

16.5 Data procurement

Information sources

16.6 Data validation

16.7 Validation techniques employed for market sizing

16.8 Data synthesis

16.9 360 degree market analysis

16.10 List of abbreviations

Research Methodology

Technavio presents a detailed picture of the market by way of study, synthesis, and summation of data from multiple sources. The analysts have presented the various facets of the market with a particular focus on identifying the key industry influencers. The data thus presented is comprehensive, reliable, and the result of extensive research, both primary and secondary.

INFORMATION SOURCES

Primary sources

  • Manufacturers and suppliers
  • Channel partners
  • Industry experts
  • Strategic decision makers

Secondary sources

  • Industry journals and periodicals
  • Government data
  • Financial reports of key industry players
  • Historical data
  • Press releases

DATA ANALYSIS

Data Synthesis

  • Collation of data
  • Estimation of key figures
  • Analysis of derived insights

Data Validation

  • Triangulation with data models
  • Reference against proprietary databases
  • Corroboration with industry experts

REPORT WRITING

Qualitative

  • Market drivers
  • Market challenges
  • Market trends
  • Five forces analysis

Quantitative

  • Market size and forecast
  • Market segmentation
  • Geographical insights
  • Competitive landscape

Interested in this report?

Get your sample now to see our research methodology and insights!

Download Now

Frequently Asked Questions

Elastomeric Infusion Pumps market growth will increase by USD 982.1 million during 2026-2030.

The Elastomeric Infusion Pumps market is expected to grow at a CAGR of 7.2% during 2026-2030.

Elastomeric Infusion Pumps market is segmented by Application (Pain management, Antibiotic or antiviral, Chemotherapy, Others) End-user (Hospitals, Ambulatory service centers, Clinics, Others) Product (Continuous rate, Variable rate)

Ace Medical Co. Ltd., Ambu AS, Amsino International Inc., Avanos Medical Inc., B.Braun SE, Baxter International Inc., Becton Dickinson and Co., Daiken Medical Co. Ltd., Epic Medical, Henan Tuoren Medical Device, Max Plus India, Moog Inc., Nipro Corp., Owens and Minor Inc., pfm medical gmbh, Promecon GmbH, SCW Medicath Ltd., Spirit Medical Ltd., Vygon SA, WooYoung Medical Co. Ltd. are a few of the key vendors in the Elastomeric Infusion Pumps market.

North America will register the highest growth rate of 49.5% among the other regions. Therefore, the Elastomeric Infusion Pumps market in North America is expected to garner significant business opportunities for the vendors during the forecast period.

US, Canada, Mexico, Germany, UK, France, Italy, Spain, The Netherlands, China, India, Japan, South Korea, Indonesia, Thailand, Brazil, Saudi Arabia, Turkey, South Africa, Argentina, UAE, Colombia, Israel

  • Surging prevalence of chronic pathologies requiring long-term continuous therapies is the driving factor this market.

The Elastomeric Infusion Pumps market vendors should focus on grabbing business opportunities from the Application segment as it accounted for the largest market share in the base year.
RIA - Research AI Assistant
Ask RIA
