Electric Vehicle Remote Diagnostics Market Analysis APAC, Europe, North America, South America, Middle East and Africa - China, US, Germany, France, Japan - Size and Forecast 2024-2028

Electric Vehicle Remote Diagnostics Market Analysis APAC, Europe, North America, South America, Middle East and Africa - China, US, Germany, France, Japan - Size and Forecast 2024-2028

Published: May 2024 178 Pages SKU: IRTNTR72425

Market Overview at a Glance

$4.10 B
Market Opportunity
39.04%
CAGR
29.04
YoY growth 2023-2024(%)

Electric Vehicle Remote Diagnostics Market Size 2024-2028

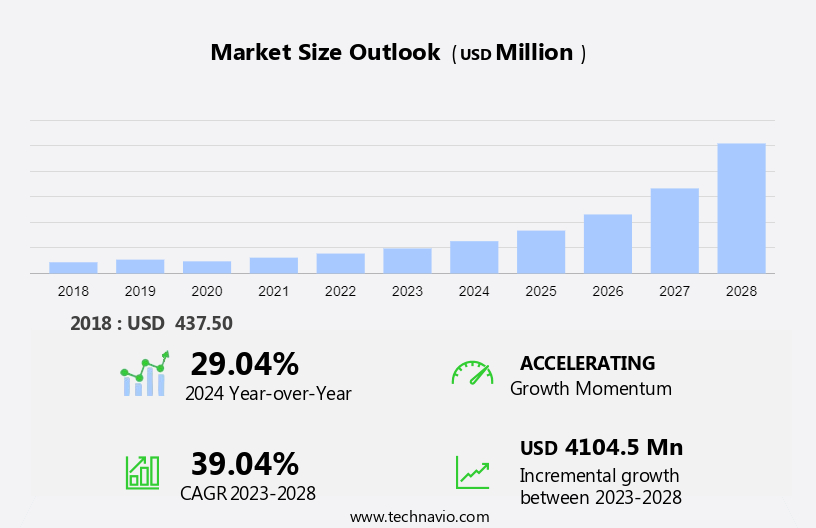
The electric vehicle remote diagnostics market size is forecast to increase by USD 4.1 billion at a CAGR of 39.04% between 2023 and 2028.

  • The market is experiencing significant growth due to several key factors. One of the primary drivers is the decreasing battery pack prices, which is boosting the demand for EVs. Another trend influencing the market is the increasing popularity of remote diagnostics services in electric buses. Automotive remote diagnostics for electric vehicles focus on battery health monitoring, human-machine interface, and cybersecurity risks to minimize downtime and ensure optimal vehicle operation. These services enable real-time monitoring and analysis of vehicle performance, ensuring optimal operation and reducing downtime. However, the subscription cost associated with EV remote diagnostics services may act as a challenge for some consumers, as they may add to the overall cost of EV ownership. Despite this, the benefits of remote diagnostics, such as improved vehicle efficiency and reduced maintenance costs, are expected to outweigh the costs In the long run. Overall, the market for EV remote diagnostics is poised for strong growth In the coming years.

What will be the Size of the Market During the Forecast Period?

Electric Vehicle Remote Diagnostics Market Size

 Request Free Sample

  • The electric vehicle (EV) remote diagnostics market is experiencing significant growth as automakers increasingly prioritize vehicle electrification and the connected-car ecosystem. This market encompasses the use of wireless networks and diagnostic equipment to monitor and analyze real-time vehicle performance data for EVs, enabling proactive maintenance and failure prevention. The market's size is expanding as automakers recognize the benefits of remote diagnostics in managing the complexities of electric vehicle systems. Real-time monitoring and analysis facilitate efficient service time, reduce maintenance costs, and improve overall vehicle reliability.
  • However, challenges such as technology bottlenecks and cybersecurity risks persist, necessitating continuous innovation and investment In the EV remote diagnostics sector. In summary, the market represents a vital component of the automotive industry's transition to electric powertrains. By leveraging wireless networks and advanced diagnostic equipment, automakers can optimize vehicle performance, enhance the customer experience, and address the unique challenges associated with electric vehicle systems.

How is this Industry segmented and which is the largest segment?

The industry research report provides comprehensive data (region-wise segment analysis), with forecasts and estimates in "USD billion" for the period 2024-2028, as well as historical data from 2018-2022 for the following segments.

  • Application
    • Passenger cars
    • Commercial vehicles
  • Type
    • Equipment
    • Software
  • Geography
    • APAC
      • China
      • Japan
    • Europe
      • Germany
      • France
    • North America
      • US
    • South America
    • Middle East and Africa

By Application Insights

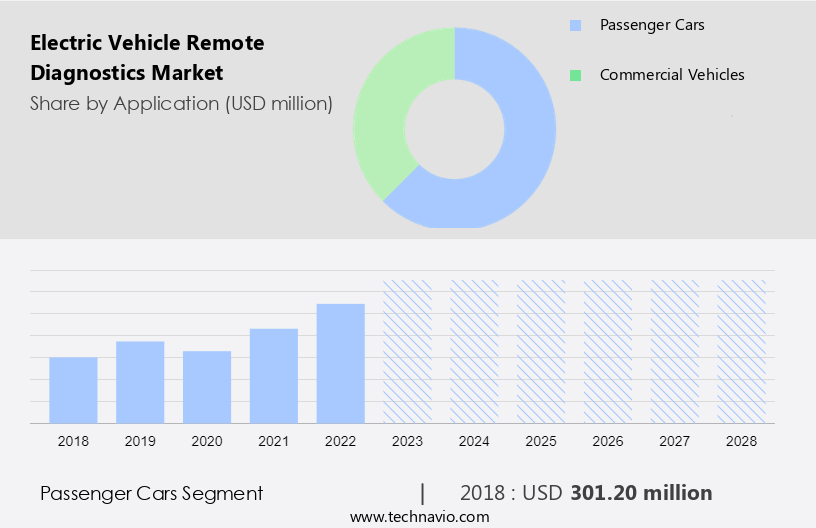
  • The passenger cars segment is estimated to witness significant growth during the forecast period.

The Market is experiencing significant growth, particularly In the passenger cars segment. Driven by the increasing demand for uninterrupted connectivity and telematics services, consumers are seeking vehicles that offer real-time vehicle performance monitoring and diagnostic capabilities. This trend is further fueled by the growing popularity of electric cars, which require effective remote diagnostics for optimal operation. Telematics plays a crucial role in EV production, enabling automatic crash notification, vehicle location tracking, roadside assistance, data collection, and vehicle health alerts. Advanced sensors, communication technologies, and computer software facilitate these services through wireless networks, including 3G, 4G, Wi-Fi, and the emerging 5G technology.

Electric Vehicle Remote Diagnostics Market Size

Get a glance at the market report of share of various segments Request Free Sample

The passenger cars segment was valued at USD 301.20 million in 2018 and showed a gradual increase during the forecast period.

Regional Analysis

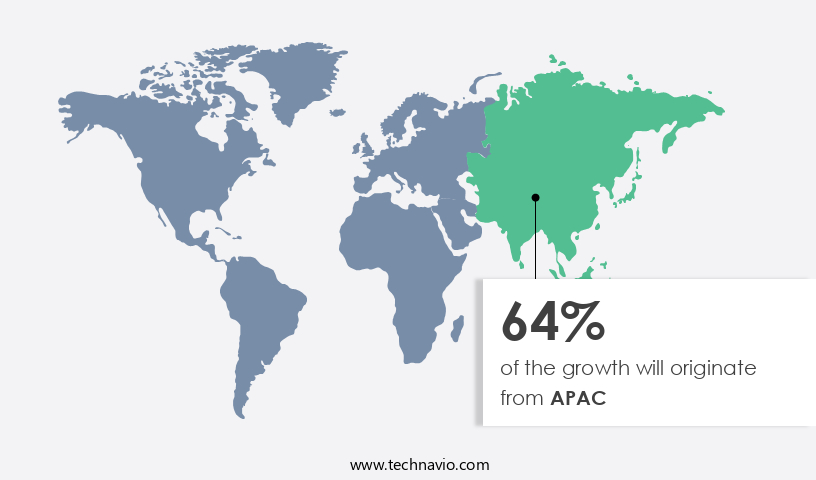
  • APAC is estimated to contribute 64% to the growth of the global market during the forecast period.

Technavio's analysts have elaborately explained the regional trends and drivers that shape the market during the forecast period.

Electric Vehicle Remote Diagnostics Market Share by Geography

For more insights on the market size of various regions, Request Free Sample

The electric vehicle (EV) remote diagnostics market is experiencing significant growth, particularly In the Asia-Pacific (APAC) region. China and Japan are leading contributors to this market due to the high adoption of EVs In these countries. The Chinese market is driven by government initiatives to reduce carbon emissions, the availability of charging infrastructure, and increased participation of OEMs. Japan's market growth can be attributed to its advanced wireless network infrastructure and the prevalence of automotive remote diagnostics technology. This market is underpinned by the integration of advanced sensors, communication technologies, and computer software. Real-time vehicle performance data collection enables predictive maintenance, reducing service downtime and component defects.

Market Dynamics

Our researchers analyzed the data with 2023 as the base year, along with the key drivers, trends, and challenges. A holistic analysis of drivers will help companies refine their marketing strategies to gain a competitive advantage.

What are the key market drivers leading to the rise In the adoption of Electric Vehicle Remote Diagnostics Industry?

Reducing battery pack prices boosting EV demand is the key driver of the market.

  • The electric vehicle (EV) remote diagnostics market is significantly influenced by the advancements in automotive remote diagnostics and the increasing adoption of EVs. The use of wireless networks, such as 3G, 4G, Wi-Fi, and Bluetooth, in diagnostic equipment enables real-time identification of vehicle performance issues. This results in reduced service time and faster resolution of failures in both passenger vehicles and commercial vehicles. Key components of EV remote diagnostics include computer software, advanced sensors, communication technologies, and IoT technologies. These elements facilitate automatic crash notification, vehicle location tracking, roadside assistance, data collection, and vehicle health alerts. Fleet operators and commercial vehicle suppliers benefit from predictive analytics and maintenance services to minimize downtime and component defects.
  • Battery health monitoring is a crucial aspect of EV remote diagnostics, with 5G technology and AI-driven predictive analytics playing essential roles in optimizing battery performance. The connected-car ecosystem, including luxury and sports vehicles, prioritizes safety and security, making real-time diagnostics an indispensable feature. Despite the advantages, challenges such as cybersecurity risks and technology bottlenecks in vehicle electrification remain. Automakers and vehicle owners must address these concerns to ensure a seamless driving experience and maintain the integrity of connected-car ecosystems. Light commercial vehicles are also adopting remote diagnostics to optimize fleet management and improve overall efficiency.

What are the market trends shaping the Electric Vehicle Remote Diagnostics Industry?

Growing popularity of remote diagnostics services in electric buses is the upcoming market trend.

  • The electric vehicle (EV) remote diagnostics market is experiencing substantial growth due to the increasing adoption of automotive remote diagnostics in both passenger and commercial vehicles. This trend is driven by the integration of wireless networks, diagnostic equipment, computer software, and various communication technologies such as 3G, 4G, Wi-Fi, and Bluetooth. These advancements enable real-time monitoring of vehicle performance, service time, failures, and component defects. The Internet of Things (IoT) and telematics are playing a crucial role In the development of connected car ecosystems, which include automatic crash notification, vehicle location tracking, roadside assistance, and data collection. These technologies help minimize service downtime and improve maintenance, particularly for electric vehicles, which require specialized attention due to their battery health monitoring and electrification.
  • Fleet operators and commercial vehicle suppliers are increasingly investing in predictive analytics, artificial intelligence, and human-machine interface technologies to optimize fleet management and enhance the driving experience for luxury and sports vehicles. Safety and security concerns are also driving the adoption of advanced sensors and communication technologies to monitor vehicle health alerts and address cybersecurity risks. Electric buses are gaining popularity In the public transportation sector, with significant investments and initiatives aimed at increasing their operational numbers. To cater to this growing market, bus manufacturers and telematics service providers are offering customized solutions for electric buses, including real-time monitoring, predictive maintenance, and vehicle tracking.

What challenges does the Electric Vehicle Remote Diagnostics Industry face during its growth?

Subscription cost associated with EV remote diagnostics services is a key challenge affecting the industry growth.

  • The market is experiencing significant growth due to the expanding applications and services withIn the realm of EV telematics. This trend is driven by the integration of remote diagnostic services into connected car offerings. The cost-effectiveness of these services is a key factor, as they utilize the same telematics control units and hardware components as other connected car applications. Consequently, subscription pricing strategies will significantly influence the market's expansion. For automakers, bundling remote diagnostics with other connected car services is essential to remain competitive. This market dynamic is fueled by the increasing adoption of advanced sensors, communication technologies, and IoT technologies in electric passenger vehicles and commercial vehicles.
  • Additionally, safety and security concerns, automatic crash notification, vehicle location tracking, roadside assistance, and battery health monitoring are driving the demand for these services. Fleet operators and commercial vehicle suppliers are also leveraging predictive analytics, maintenance, and AI to optimize their operations. The integration of 3G, 4G, Wi-Fi, and potentially 5G wireless networks into electric vehicles further enhances the capabilities of remote diagnostic services. However, cybersecurity risks are a potential bottleneck that must be addressed withIn the connected-car ecosystem.

Exclusive Customer Landscape

The market forecasting report includes the adoption lifecycle of the market, covering from the innovator's stage to the laggard's stage. It focuses on adoption rates in different regions based on penetration. Furthermore, the market report also includes key purchase criteria and drivers of price sensitivity to help companies evaluate and develop their market growth analysis strategies.
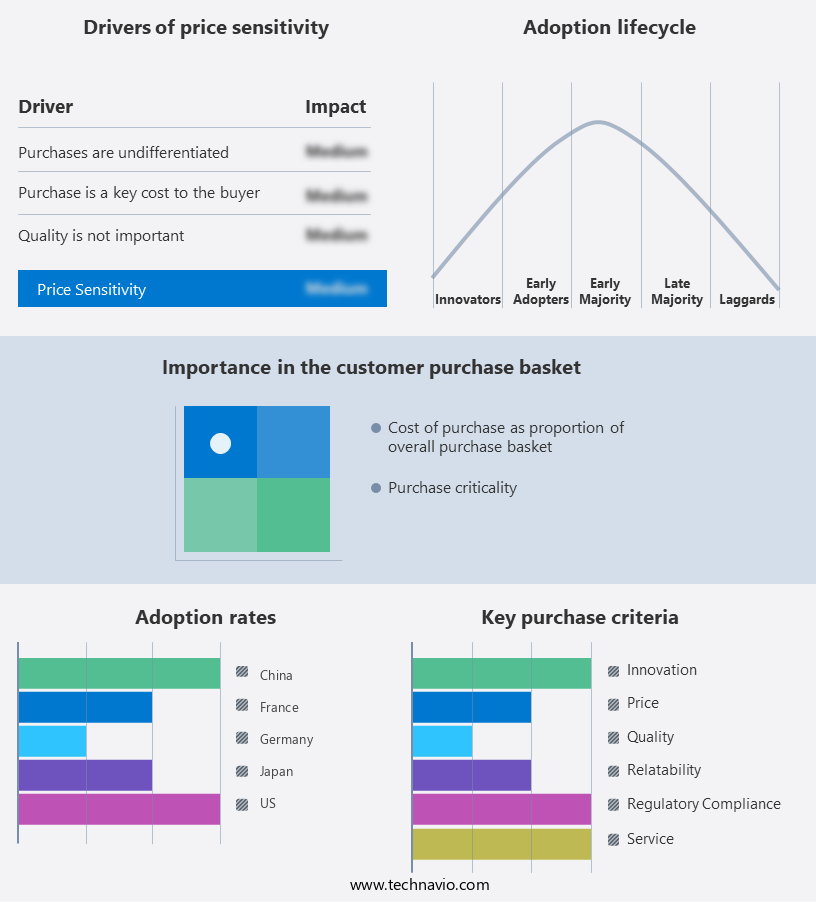
Electric Vehicle Remote Diagnostics Market Share by Geography

 Customer Landscape

Key Companies & Market Insights

Companies are implementing various strategies, such as strategic alliances,market forecast, partnerships, mergers and acquisitions, geographical expansion, and product/service launches, to enhance their presence in the industry.

The industry research and growth report includes detailed analyses of the competitive landscape of the market and information about key companies, including:

  • AB Volvo
  • Beijing Automotive Group Co. Ltd.
  • Bayerische Motoren Werke AG
  • Chongqing Changan Automobile Co. Ltd.
  • Ford Motor Co.
  • General Motors Co.
  • Honda Motor Co. Ltd.
  • Hyundai Motor Co.
  • KIA CORP.
  • Li Auto Inc.
  • Mahindra and Mahindra Ltd.
  • Mercedes Benz Group AG
  • Mitsubishi Motors Corp.
  • Renault SAS
  • Stellantis NV
  • Tata Motors Ltd.
  • Tesla Inc.
  • Toyota Motor Corp.
  • Volkswagen AG

Qualitative and quantitative analysis of companies has been conducted to help clients understand the wider business environment as well as the strengths and weaknesses of key industry players. Data is qualitatively analyzed to categorize companies as pure play, category-focused, industry-focused, and diversified; it is quantitatively analyzed to categorize companies as dominant, leading, strong, tentative, and weak.

Research Analyst Overview

Electric vehicle (EV) remote diagnostics refer to the use of wireless networks, computer software, and advanced sensors to monitor and analyze vehicle performance in real-time. This technology enables automakers and fleet operators to identify component defects, predict failures, and provide vehicle owners with proactive maintenance alerts. The integration of the Internet of Things (IoT) and telematics In the automotive industry has led to the development of connected car ecosystems, enhancing the driving experience for passengers in both luxury and sports vehicles. The use of 3G, 4G, Wi-Fi, and Bluetooth communication technologies facilitates the transmission of data from vehicles to diagnostic equipment.

In addition, this data collection allows for the identification of service downtime and potential safety and security concerns, such as automatic crash notifications and vehicle location tracking. Roadside assistance can also be provided remotely, reducing response time and improving the overall customer experience. The implementation of EV remote diagnostics has become increasingly important as the adoption of electric vehicles grows. With the unique challenges posed by battery health monitoring and vehicle electrification, real-time analysis of vehicle performance is crucial for ensuring optimal vehicle health and minimizing downtime. The integration of artificial intelligence and predictive analytics further enhances the capabilities of remote diagnostics.

Moreover, these technologies enable the identification of patterns and trends in vehicle data, allowing for more accurate and efficient diagnosis and maintenance. However, the implementation of EV remote diagnostics also presents cybersecurity risks. As more data is transmitted wirelessly, it becomes essential to ensure the security of this information to protect against potential breaches and data theft. The use of 5G technology In the automotive industry is expected to further advance the capabilities of remote diagnostics. Faster data transmission speeds will enable more frequent and detailed data collection, leading to more accurate and timely diagnoses and maintenance alerts. The adoption of EV remote diagnostics is not limited to passenger cars but is also gaining popularity among commercial vehicle suppliers and fleet operators.

Furthermore, the ability to monitor the health of their vehicles in real-time allows for more efficient fleet management and reduces downtime, resulting in cost savings and improved productivity. Despite the numerous benefits of EV remote diagnostics, there are still bottlenecks that need to be addressed. The human-machine interface must be user-friendly and accessible to ensure widespread adoption by vehicle owners. Additionally, the cost of implementing and maintaining these systems can be a barrier for some automakers and fleet operators.

Market Scope

Report Coverage

Details

Page number

178

Base year

2023

Historic period

2018-2022

Forecast period

2024-2028

Growth momentum & CAGR

Accelerate at a CAGR of 39.04%

Market growth 2024-2028

USD 4.1 billion

Market structure

Fragmented

YoY growth 2023-2024(%)

29.04

Key countries

China, US, Germany, France, and Japan

Competitive landscape

Leading Companies, market forecast, market growth and forecasting, Market Positioning of Companies, Competitive Strategies, and Industry Risks

Request Free Sample

What are the Key Data Covered in this Market Research and Growth Report?

  • CAGR of the Electric Vehicle Remote Diagnostics industry during the forecast period
  • Detailed information on factors that will drive the growth and forecasting between 2024 and 2028
  • Precise estimation of the size of the market and its contribution of the industry in focus to the parent market
  • Accurate predictions about upcoming growth and trends and changes in consumer behaviour
  • Growth of the market across APAC, Europe, North America, South America, and Middle East and Africa
  • Thorough analysis of the market's competitive landscape and detailed information about companies
  • Comprehensive analysis of factors that will challenge the market growth of industry companies

We can help! Our analysts can customize this market research report to meet your requirements.

Get in touch

1 Executive Summary

  • 1.1 Market overview
    • Executive Summary - Chart on Market Overview
    • Executive Summary - Data Table on Market Overview
    • Executive Summary - Chart on Global Market Characteristics
    • Executive Summary - Chart on Market by Geography
    • Executive Summary - Chart on Market Segmentation by Application
    • Executive Summary - Chart on Market Segmentation by Type
    • Executive Summary - Chart on Incremental Growth
    • Executive Summary - Data Table on Incremental Growth
    • Executive Summary - Chart on Company Market Positioning

2 Market Landscape

  • 2.1 Market ecosystem
    • Parent Market
    • Data Table on - Parent Market
  • 2.2 Market characteristics
    • Market characteristics analysis
  • 2.3 Value chain analysis
    • Value Chain Analysis

3 Market Sizing

  • 3.1 Market definition
    • Offerings of companies included in the market definition
  • 3.2 Market segment analysis
    • Market segments
  • 3.3 Market size 2023
    • 3.4 Market outlook: Forecast for 2023-2028
      • Chart on Global - Market size and forecast 2023-2028 ($ million)
      • Data Table on Global - Market size and forecast 2023-2028 ($ million)
      • Chart on Global Market: Year-over-year growth 2023-2028 (%)
      • Data Table on Global Market: Year-over-year growth 2023-2028 (%)

    4 Historic Market Size

    • 4.1 Global Electric Vehicle Remote Diagnostics Market 2018 - 2022
      • Historic Market Size - Data Table on Global Electric Vehicle Remote Diagnostics Market 2018 - 2022 ($ million)
    • 4.2 Application segment analysis 2018 - 2022
      • Historic Market Size - Application Segment 2018 - 2022 ($ million)
    • 4.3 Type segment analysis 2018 - 2022
      • Historic Market Size - Type Segment 2018 - 2022 ($ million)
    • 4.4 Geography segment analysis 2018 - 2022
      • Historic Market Size - Geography Segment 2018 - 2022 ($ million)
    • 4.5 Country segment analysis 2018 - 2022
      • Historic Market Size - Country Segment 2018 - 2022 ($ million)

    5 Five Forces Analysis

    • 5.1 Five forces summary
      • Five forces analysis - Comparison between 2023 and 2028
    • 5.2 Bargaining power of buyers
      • Bargaining power of buyers - Impact of key factors 2023 and 2028
    • 5.3 Bargaining power of suppliers
      • Bargaining power of suppliers - Impact of key factors in 2023 and 2028
    • 5.4 Threat of new entrants
      • Threat of new entrants - Impact of key factors in 2023 and 2028
    • 5.5 Threat of substitutes
      • Threat of substitutes - Impact of key factors in 2023 and 2028
    • 5.6 Threat of rivalry
      • Threat of rivalry - Impact of key factors in 2023 and 2028
    • 5.7 Market condition
      • Chart on Market condition - Five forces 2023 and 2028

    6 Market Segmentation by Application

    • 6.1 Market segments
      • Chart on Application - Market share 2023-2028 (%)
      • Data Table on Application - Market share 2023-2028 (%)
    • 6.2 Comparison by Application
      • Chart on Comparison by Application
      • Data Table on Comparison by Application
    • 6.3 Passenger cars - Market size and forecast 2023-2028
      • Chart on Passenger cars - Market size and forecast 2023-2028 ($ million)
      • Data Table on Passenger cars - Market size and forecast 2023-2028 ($ million)
      • Chart on Passenger cars - Year-over-year growth 2023-2028 (%)
      • Data Table on Passenger cars - Year-over-year growth 2023-2028 (%)
    • 6.4 Commercial vehicles - Market size and forecast 2023-2028
      • Chart on Commercial vehicles - Market size and forecast 2023-2028 ($ million)
      • Data Table on Commercial vehicles - Market size and forecast 2023-2028 ($ million)
      • Chart on Commercial vehicles - Year-over-year growth 2023-2028 (%)
      • Data Table on Commercial vehicles - Year-over-year growth 2023-2028 (%)
    • 6.5 Market opportunity by Application
      • Market opportunity by Application ($ million)
      • Data Table on Market opportunity by Application ($ million)

    7 Market Segmentation by Type

    • 7.1 Market segments
      • Chart on Type - Market share 2023-2028 (%)
      • Data Table on Type - Market share 2023-2028 (%)
    • 7.2 Comparison by Type
      • Chart on Comparison by Type
      • Data Table on Comparison by Type
    • 7.3 Equipment - Market size and forecast 2023-2028
      • Chart on Equipment - Market size and forecast 2023-2028 ($ million)
      • Data Table on Equipment - Market size and forecast 2023-2028 ($ million)
      • Chart on Equipment - Year-over-year growth 2023-2028 (%)
      • Data Table on Equipment - Year-over-year growth 2023-2028 (%)
    • 7.4 Software - Market size and forecast 2023-2028
      • Chart on Software - Market size and forecast 2023-2028 ($ million)
      • Data Table on Software - Market size and forecast 2023-2028 ($ million)
      • Chart on Software - Year-over-year growth 2023-2028 (%)
      • Data Table on Software - Year-over-year growth 2023-2028 (%)
    • 7.5 Market opportunity by Type
      • Market opportunity by Type ($ million)
      • Data Table on Market opportunity by Type ($ million)

    8 Customer Landscape

    • 8.1 Customer landscape overview
      • Analysis of price sensitivity, lifecycle, customer purchase basket, adoption rates, and purchase criteria

    9 Geographic Landscape

    • 9.1 Geographic segmentation
      • Chart on Market share by geography 2023-2028 (%)
      • Data Table on Market share by geography 2023-2028 (%)
    • 9.2 Geographic comparison
      • Chart on Geographic comparison
      • Data Table on Geographic comparison
    • 9.3 APAC - Market size and forecast 2023-2028
      • Chart on APAC - Market size and forecast 2023-2028 ($ million)
      • Data Table on APAC - Market size and forecast 2023-2028 ($ million)
      • Chart on APAC - Year-over-year growth 2023-2028 (%)
      • Data Table on APAC - Year-over-year growth 2023-2028 (%)
    • 9.4 Europe - Market size and forecast 2023-2028
      • Chart on Europe - Market size and forecast 2023-2028 ($ million)
      • Data Table on Europe - Market size and forecast 2023-2028 ($ million)
      • Chart on Europe - Year-over-year growth 2023-2028 (%)
      • Data Table on Europe - Year-over-year growth 2023-2028 (%)
    • 9.5 North America - Market size and forecast 2023-2028
      • Chart on North America - Market size and forecast 2023-2028 ($ million)
      • Data Table on North America - Market size and forecast 2023-2028 ($ million)
      • Chart on North America - Year-over-year growth 2023-2028 (%)
      • Data Table on North America - Year-over-year growth 2023-2028 (%)
    • 9.6 South America - Market size and forecast 2023-2028
      • Chart on South America - Market size and forecast 2023-2028 ($ million)
      • Data Table on South America - Market size and forecast 2023-2028 ($ million)
      • Chart on South America - Year-over-year growth 2023-2028 (%)
      • Data Table on South America - Year-over-year growth 2023-2028 (%)
    • 9.7 Middle East and Africa - Market size and forecast 2023-2028
      • Chart on Middle East and Africa - Market size and forecast 2023-2028 ($ million)
      • Data Table on Middle East and Africa - Market size and forecast 2023-2028 ($ million)
      • Chart on Middle East and Africa - Year-over-year growth 2023-2028 (%)
      • Data Table on Middle East and Africa - Year-over-year growth 2023-2028 (%)
    • 9.8 China - Market size and forecast 2023-2028
      • Chart on China - Market size and forecast 2023-2028 ($ million)
      • Data Table on China - Market size and forecast 2023-2028 ($ million)
      • Chart on China - Year-over-year growth 2023-2028 (%)
      • Data Table on China - Year-over-year growth 2023-2028 (%)
    • 9.9 Germany - Market size and forecast 2023-2028
      • Chart on Germany - Market size and forecast 2023-2028 ($ million)
      • Data Table on Germany - Market size and forecast 2023-2028 ($ million)
      • Chart on Germany - Year-over-year growth 2023-2028 (%)
      • Data Table on Germany - Year-over-year growth 2023-2028 (%)
    • 9.10 US - Market size and forecast 2023-2028
      • Chart on US - Market size and forecast 2023-2028 ($ million)
      • Data Table on US - Market size and forecast 2023-2028 ($ million)
      • Chart on US - Year-over-year growth 2023-2028 (%)
      • Data Table on US - Year-over-year growth 2023-2028 (%)
    • 9.11 France - Market size and forecast 2023-2028
      • Chart on France - Market size and forecast 2023-2028 ($ million)
      • Data Table on France - Market size and forecast 2023-2028 ($ million)
      • Chart on France - Year-over-year growth 2023-2028 (%)
      • Data Table on France - Year-over-year growth 2023-2028 (%)
    • 9.12 Japan - Market size and forecast 2023-2028
      • Chart on Japan - Market size and forecast 2023-2028 ($ million)
      • Data Table on Japan - Market size and forecast 2023-2028 ($ million)
      • Chart on Japan - Year-over-year growth 2023-2028 (%)
      • Data Table on Japan - Year-over-year growth 2023-2028 (%)
    • 9.13 Market opportunity by geography
      • Market opportunity by geography ($ million)
      • Data Tables on Market opportunity by geography ($ million)

    10 Drivers, Challenges, and Opportunity/Restraints

    • 10.1 Market drivers
      • 10.2 Market challenges
        • 10.3 Impact of drivers and challenges
          • Impact of drivers and challenges in 2023 and 2028
        • 10.4 Market opportunities/restraints

          11 Competitive Landscape

          • 11.1 Overview
            • 11.2 Competitive Landscape
              • Overview on criticality of inputs and factors of differentiation
            • 11.3 Landscape disruption
              • Overview on factors of disruption
            • 11.4 Industry risks
              • Impact of key risks on business

            12 Competitive Analysis

            • 12.1 Companies profiled
              • Companies covered
            • 12.2 Market positioning of companies
              • Matrix on companies position and classification
            • 12.3 AB Volvo
              • AB Volvo - Overview
              • AB Volvo - Business segments
              • AB Volvo - Key news
              • AB Volvo - Key offerings
              • AB Volvo - Segment focus
            • 12.4 Beijing Automotive Group Co. Ltd.
              • Beijing Automotive Group Co. Ltd. - Overview
              • Beijing Automotive Group Co. Ltd. - Product / Service
              • Beijing Automotive Group Co. Ltd. - Key offerings
            • 12.5 Bayerische Motoren Werke AG
              • Bayerische Motoren Werke AG - Overview
              • Bayerische Motoren Werke AG - Business segments
              • Bayerische Motoren Werke AG - Key news
              • Bayerische Motoren Werke AG - Key offerings
              • Bayerische Motoren Werke AG - Segment focus
            • 12.6 Ford Motor Co.
              • Ford Motor Co. - Overview
              • Ford Motor Co. - Business segments
              • Ford Motor Co. - Key news
              • Ford Motor Co. - Key offerings
              • Ford Motor Co. - Segment focus
            • 12.7 General Motors Co.
              • General Motors Co. - Overview
              • General Motors Co. - Business segments
              • General Motors Co. - Key news
              • General Motors Co. - Key offerings
              • General Motors Co. - Segment focus
            • 12.8 Honda Motor Co. Ltd.
              • Honda Motor Co. Ltd. - Overview
              • Honda Motor Co. Ltd. - Business segments
              • Honda Motor Co. Ltd. - Key news
              • Honda Motor Co. Ltd. - Key offerings
              • Honda Motor Co. Ltd. - Segment focus
            • 12.9 Hyundai Motor Co.
              • Hyundai Motor Co. - Overview
              • Hyundai Motor Co. - Business segments
              • Hyundai Motor Co. - Key news
              • Hyundai Motor Co. - Key offerings
              • Hyundai Motor Co. - Segment focus
            • 12.10 Mercedes Benz Group AG
              • Mercedes Benz Group AG - Overview
              • Mercedes Benz Group AG - Business segments
              • Mercedes Benz Group AG - Key news
              • Mercedes Benz Group AG - Key offerings
              • Mercedes Benz Group AG - Segment focus
            • 12.11 Mitsubishi Motors Corp.
              • Mitsubishi Motors Corp. - Overview
              • Mitsubishi Motors Corp. - Business segments
              • Mitsubishi Motors Corp. - Key offerings
              • Mitsubishi Motors Corp. - Segment focus
            • 12.12 Renault SAS
              • Renault SAS - Overview
              • Renault SAS - Product / Service
              • Renault SAS - Key news
              • Renault SAS - Key offerings
            • 12.13 Stellantis NV
              • Stellantis NV - Overview
              • Stellantis NV - Business segments
              • Stellantis NV - Key news
              • Stellantis NV - Key offerings
              • Stellantis NV - Segment focus
            • 12.14 Tata Motors Ltd.
              • Tata Motors Ltd. - Overview
              • Tata Motors Ltd. - Business segments
              • Tata Motors Ltd. - Key news
              • Tata Motors Ltd. - Key offerings
              • Tata Motors Ltd. - Segment focus
            • 12.15 Tesla Inc.
              • Tesla Inc. - Overview
              • Tesla Inc. - Business segments
              • Tesla Inc. - Key news
              • Tesla Inc. - Key offerings
              • Tesla Inc. - Segment focus
            • 12.16 Toyota Motor Corp.
              • Toyota Motor Corp. - Overview
              • Toyota Motor Corp. - Business segments
              • Toyota Motor Corp. - Key news
              • Toyota Motor Corp. - Key offerings
              • Toyota Motor Corp. - Segment focus
            • 12.17 Volkswagen AG
              • Volkswagen AG - Overview
              • Volkswagen AG - Business segments
              • Volkswagen AG - Key news
              • Volkswagen AG - Key offerings
              • Volkswagen AG - Segment focus

            13 Appendix

            • 13.1 Scope of the report
              • 13.2 Inclusions and exclusions checklist
                • Inclusions checklist
                • Exclusions checklist
              • 13.3 Currency conversion rates for US$
                • Currency conversion rates for US$
              • 13.4 Research methodology
                • Research methodology
              • 13.5 Data procurement
                • Information sources
              • 13.6 Data validation
                • Data validation
              • 13.7 Validation techniques employed for market sizing
                • Validation techniques employed for market sizing
              • 13.8 Data synthesis
                • Data synthesis
              • 13.9 360 degree market analysis
                • 360 degree market analysis
              • 13.10 List of abbreviations
                • List of abbreviations

              Research Methodology

              Technavio presents a detailed picture of the market by way of study, synthesis, and summation of data from multiple sources. The analysts have presented the various facets of the market with a particular focus on identifying the key industry influencers. The data thus presented is comprehensive, reliable, and the result of extensive research, both primary and secondary.

              INFORMATION SOURCES

              Primary sources

              • Manufacturers and suppliers
              • Channel partners
              • Industry experts
              • Strategic decision makers

              Secondary sources

              • Industry journals and periodicals
              • Government data
              • Financial reports of key industry players
              • Historical data
              • Press releases

              DATA ANALYSIS

              Data Synthesis

              • Collation of data
              • Estimation of key figures
              • Analysis of derived insights

              Data Validation

              • Triangulation with data models
              • Reference against proprietary databases
              • Corroboration with industry experts

              REPORT WRITING

              Qualitative

              • Market drivers
              • Market challenges
              • Market trends
              • Five forces analysis

              Quantitative

              • Market size and forecast
              • Market segmentation
              • Geographical insights
              • Competitive landscape

              Interested in this report?

              Get your sample now to see our research methodology and insights!

              Download Now

              Frequently Asked Questions

              Electric Vehicle Remote Diagnostics market growth will increase by $ 4104.5 mn during 2024-2028.

              The Electric Vehicle Remote Diagnostics market is expected to grow at a CAGR of 39.04% during 2024-2028.

              Electric Vehicle Remote Diagnostics market is segmented by Application( Passenger cars, Commercial vehicles, Middle East and Africa) Type( Equipment, Software)

              AB Volvo, Beijing Automotive Group Co. Ltd., Bayerische Motoren Werke AG, Chongqing Changan Automobile Co. Ltd., Ford Motor Co., General Motors Co., Honda Motor Co. Ltd., Hyundai Motor Co., KIA CORP., Li Auto Inc., Mahindra and Mahindra Ltd., Mercedes Benz Group AG, Mitsubishi Motors Corp., Renault SAS, Stellantis NV, Tata Motors Ltd., Tesla Inc., Toyota Motor Corp., Volkswagen AG are a few of the key vendors in the Electric Vehicle Remote Diagnostics market.

              APAC will register the highest growth rate of 64% among the other regions. Therefore, the Electric Vehicle Remote Diagnostics market in APAC is expected to garner significant business opportunities for the vendors during the forecast period.

              China, US, Germany, France, Japan

              • Reducing battery pack prices boosting EV demandThe global electric vehicle remote diagnostics market is highly dependent on the adoption of EVs. Hence is the driving factor this market.
              • factors supporting the adoption of EVs are crucial for the market. Since EVs function on battery-powered systems is the driving factor this market.
              • battery costs are critical contributors to the upfront cost of EVs. Several improvements have been achieved in the technology of batteries used in EVs to raise their appeal among consumers. For example is the driving factor this market.
              • Li-ion batteries are now more lightweight and with longer lifespans compared to conventional lead-acid and VRLA (valve-regulated lead-acid) batteries.At present is the driving factor this market.
              • the upfront cost of EVs is higher than conventional vehicles is the driving factor this market.
              • with battery costs making the biggest difference. However is the driving factor this market.
              • battery costs are declining steadily amid major battery manufacturers leveraging economies of scale and shifting their manufacturing bases to low-cost locations. Declining battery costs are expected to allow EVs to achieve price parity with conventional vehicles during the forecast period. For instance is the driving factor this market.
              • a battery pack cost of $100 per kWh is essential for electric cars to achieve price parity. The Chevrolet Bolt EV has a 57-kWh battery pack is the driving factor this market.
              • the cost of which can be as low as $10 is the driving factor this market.
              • 830 (considering the $190 per kWh battery pack cost). Hence is the driving factor this market.
              • the declining prices of battery packs are expected to reduce the price of EVs during the forecast period. The lower price of EVs will allow providers of remote diagnostics services to push the adoption of advanced telematics services is the driving factor this market.
              • as the high upfront cost of EVs acts as a barrier for customers to opt for advanced packages of telematics services. A crucial factor for the decline in Li-ion battery costs is the relocation of manufacturing bases from Japan to China. This has encouraged Chinese manufacturers to develop Li-ion batteries for EVs at prices competitive to lead-acid batteries. Thus is the driving factor this market.
              • reducing battery pack prices boosting EV demand will drive the growth of the global electric vehicle remote diagnostics market during the forecast period. is the driving factor this market.

              The Electric Vehicle Remote Diagnostics market vendors should focus on grabbing business opportunities from the Passenger cars segment as it accounted for the largest market share in the base year.