Electrical Conductors Market For Power Industry Analysis, Size, and Forecast 2025-2029: APAC (China, India, Japan), Europe (France, Germany, Italy, Spain, UK), North America (US and Canada), South America , and Middle East and Africa

Electrical Conductors Market For Power Industry Analysis, Size, and Forecast 2025-2029:
APAC (China, India, Japan), Europe (France, Germany, Italy, Spain, UK), North America (US and Canada), South America , and Middle East and Africa

Published: Mar 2025 243 Pages SKU: IRTNTR71664

Market Overview at a Glance

$14.83 B
Market Opportunity
6.9%
CAGR
6.3
YoY growth 2024-2025(%)

Electrical Conductors Market For Power Industry Size 2025-2029

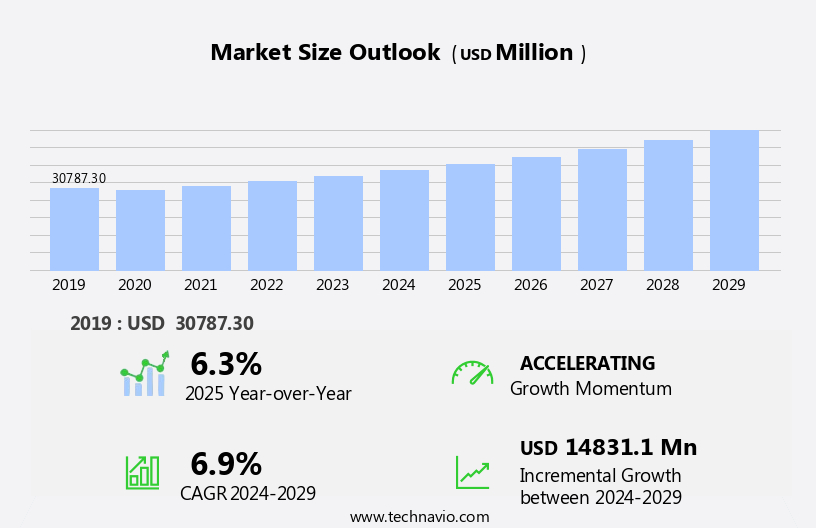
The electrical conductors market for power industry size is forecast to increase by USD 14.83 billion, at a CAGR of 6.9% between 2024 and 2029.

  • The Electrical Conductors Market for the Power Industry is witnessing significant growth, driven by the increasing investment in power transmission and distribution infrastructure. This trend is further fueled by the rising sales of power cables due to the expanding power generation capacity and the growing demand for electricity in various industries and residential sectors. The market is evolving with the integration of superconductors, which enhance the efficiency of power transmission by reducing energy loss and enabling more sustainable electrical grids. However, the market faces challenges in laying and maintaining electrical power cables. These challenges include the high cost of installation and maintenance, the need for complex permitting processes, and the increasing demand for longer cable lengths to transmit power over greater distances.
  • To capitalize on the market opportunities and navigate these challenges effectively, companies must focus on innovations in cable technology, such as the use of smart cables and advanced materials, to improve efficiency, reduce costs, and enhance durability. Additionally, collaborations and partnerships with regulatory bodies and industry associations can help streamline permitting processes and ensure compliance with safety regulations. Overall, the Electrical Conductors Market for the Power Industry presents significant growth potential, with companies that can address the challenges of installation and maintenance while delivering advanced cable solutions poised to gain a competitive edge.

What will be the Size of the Electrical Conductors Market For Power Industry during the forecast period?

Electrical Conductors Market For Power Industry Size

Explore in-depth regional segment analysis with market size data - historical 2019-2023 and forecasts 2025-2029 - in the full report.  
Request Free Sample

The electrical conductors market in the power industry continues to evolve, driven by the dynamic nature of power generation and distribution. Power quality is a significant concern, with voltage regulation and IEC standards playing crucial roles in ensuring consistent electricity supply. Electrical grids incorporate various power sources, including hydroelectric, wind, and solar, necessitating the use of different types of conductors. Bundled conductors, AAC conductors, and aluminum conductors are employed in power transmission lines, while copper conductors are preferred for their electrical resistance and current carrying capacity in power distribution networks. High-frequency conductors and insulated conductors are essential components of smart grids, enabling efficient power flow and energy storage.

Power loss is a persistent issue, with corrosion protection, conductor splices, and insulation materials playing vital roles in minimizing it. Conductor installation, ANSI and IEEE standards compliance, and conductor testing are essential for maintaining the integrity of power distribution networks. Power plants require various types of conductors, including ACSR conductors, for voltage regulation and current carrying capacity. High-temperature conductors and superconducting conductors are used in specific applications for enhanced performance. Grounding systems, strain relief, electrical connectors, and termination hardware ensure electrical safety and power quality. Skin effect, proximity effect, and power loss are ongoing concerns in power transmission, necessitating continuous research and development in material science and insulation materials.

Renewable energy sources, such as solar power, require specialized conductors and insulation materials for optimal performance. Grid modernization and environmental impact are significant trends, with vibration dampers and cross-linked polyethylene (XLPE) insulation materials playing crucial roles in enhancing the performance and sustainability of power distribution networks. Conductor maintenance and energy efficiency are essential considerations for reducing operational costs and minimizing environmental impact.

How is this Electrical Conductors For Power Industry Industry segmented?

The electrical conductors for power industry industry research report provides comprehensive data (region-wise segment analysis), with forecasts and estimates in "USD million" for the period 2025-2029, as well as historical data from 2019-2023 for the following segments.

  • Application
    • Power transmission
    • Power distribution
    • Others
  • Type
    • Power cables
    • Transformer
    • Busbar
    • Submarine power cables
  • End-user
    • Utilities
    • Industrial
    • Commercial
    • Residential
  • Material
    • Copper conductors
    • Aluminum conductors
    • Others
  • Geography
    • North America
      • US
      • Canada
    • Europe
      • France
      • Germany
      • Italy
      • Spain
      • UK
    • APAC
      • China
      • India
      • Japan
    • Rest of World (ROW)

By Application Insights

The power transmission segment is estimated to witness significant growth during the forecast period.

Electric conductors play a crucial role in power transmission by enabling the transfer of electrical energy from generation sources to end-users. The selection of conductors depends on various factors such as voltage regulation, transmission distance, environmental conditions, and cost considerations. IEC and ANSI standards guide the design and installation of electrical grids, ensuring compliance with safety and efficiency requirements. Power generation sources include hydroelectric, wind, solar, nuclear, and power plants, each requiring specific conductor types. For instance, hydroelectric power and high-voltage transmission lines often use bundled aluminum or copper conductors, while wind power employs ACSR or AAAC conductors.

Smart grids, which integrate renewable energy sources and energy storage, require high-frequency and high-temperature conductors, as well as insulated and cross-linked polyethylene (XLPE) insulation. Voltage regulation is essential for maintaining power quality and preventing power loss due to the proximity effect and corrosion. Conductor splices and termination hardware ensure proper connection and electrical safety. Grounding systems and strain relief protect against electrical surges and mechanical stress. Power transmission lines are subjected to environmental conditions, including temperature, humidity, and vibration, necessitating corrosion protection and vibration dampers. Grid modernization focuses on enhancing power distribution networks by integrating advanced technologies like superconducting conductors and conductor testing.

In the context of renewable energy sources, material science plays a significant role in developing advanced conductors with improved electrical resistance, current carrying capacity, and environmental impact. Conductor maintenance is essential for ensuring reliable power transmission and minimizing power loss. In conclusion, the power transmission industry is evolving to meet the growing global energy demand, driven by population growth, urbanization, and industrialization. Electric conductors, as the backbone of electrical grids, must adapt to these changes by offering improved performance, safety, and sustainability.

Electrical Conductors Market For Power Industry Size

Request Free Sample

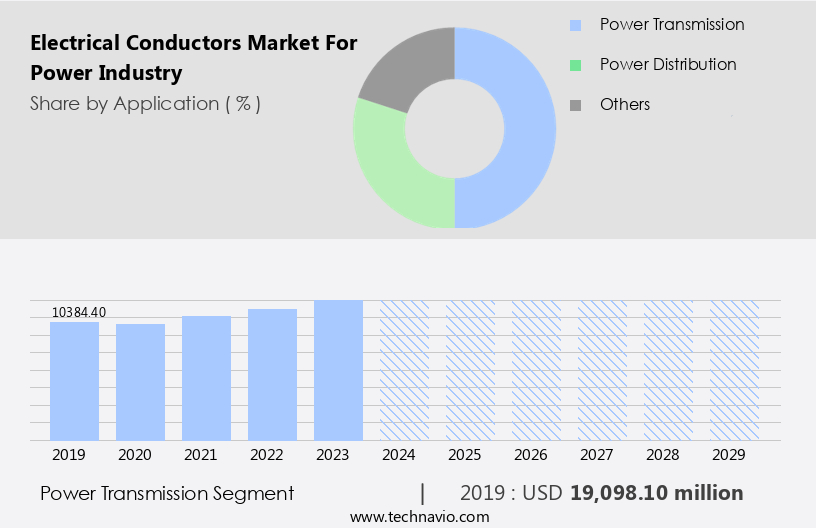
The Power transmission segment was valued at USD 19.1 billion in 2019 and showed a gradual increase during the forecast period.

Regional Analysis

APAC is estimated to contribute 39% to the growth of the global market during the forecast period.Technavio's analysts have elaborately explained the regional trends and drivers that shape the market during the forecast period.

Electrical Conductors Market For Power Industry Share by Geography

 Request Free Sample

In the power industry, APAC is witnessing significant demand for electrical conductors due to the region's increasing electricity consumption. The growing population and rising standards of living have made electricity a necessity in many major countries. This trend has led several of these nations to allow private participation in the power sector. The need for electricity continues to escalate in response to population growth and rural electrification initiatives in developing countries. China holds a dominant position in the APAC the market, accounting for over half of the market share. IEC and ANSI standards guide the manufacturing and installation of various conductors, including copper, aluminum, and ACSR, for applications such as voltage regulation, power transmission, and distribution.

Hydroelectric power, wind power, and solar power are driving the adoption of smart grids and advanced conductor technologies like high-temperature, high-frequency, and superconducting conductors. Corrosion protection, conductor splices, and insulation materials like XLPE are crucial considerations in conductor design. Voltage regulation, power loss, and electrical safety are critical factors influencing conductor selection. Power plants, electrical grids, and power distribution networks require regular maintenance and upkeep, including conductor testing and termination hardware installation. Renewable energy sources like hydroelectric, wind, and solar power are subject to environmental impact assessments, and conductor materials must comply with relevant standards. Conductors play a vital role in power quality, power transmission, and energy efficiency, making them indispensable in the power industry's ongoing modernization efforts.

Market Dynamics

The Electrical Conductors Market is thriving, driven by demand for copper conductors and aluminum conductors in power cables and EV charging cables. Data center cabling supports high-performance computing, while high-conductivity alloys and fire-resistant cables enhance efficiency and safety. Sustainable conductor materials align with eco-conscious trends, boosting the power transmission market and EV charging infrastructure market. Key long-tail keywords like copper conductors for power transmission, aluminum conductors for EV charging, fire-resistant cables for data centers, eco-friendly conductor materials 2025, high-conductivity alloys for renewable energy, sustainable conductor materials for infrastructure, ACSR conductors for high-voltage lines, halogen-free insulation for power cables, lightweight conductor materials for industrial use, and smart grid conductors for energy efficiency drive innovation and market visibility.

Our researchers analyzed the data with 2024 as the base year, along with the key drivers, trends, and challenges. A holistic analysis of drivers will help companies refine their marketing strategies to gain a competitive advantage.

What are the key market drivers leading to the rise in the adoption of Electrical Conductors For Power Industry Industry?

  • The significant increase in investment towards power transmission and distribution infrastructure serves as the primary catalyst for market growth. 
  • The electrical conductors market for the power industry is experiencing significant growth due to increasing investments in transmission and distribution networks. This trend is driven by the need to effectively transmit power to various electrical equipment throughout the network. Global investments in the transmission and distribution sectors create profitable opportunities for key players in the market. Furthermore, technological advancements and government investments in research and development for expanding transmission and distribution networks to facilitate power generation from renewable energy sources are opening new avenues for market expansion. Material science plays a crucial role in the development of electrical conductors, with advancements leading to the production of high-performance conductors such as AAAC conductors, ACSR conductors, underground conductors, superconducting conductors, and aluminum conductors.
  • These conductors offer improved current carrying capacity, sag and tension resistance, and environmental impact reduction through the use of cross-linked polyethylene (XLPE) insulation and vibration dampers, termination hardware, and other advanced technologies. Ensuring compliance with industry standards is essential for electrical safety and market acceptance. Overall, the electrical conductors market for the power industry is poised for growth as the world transitions to a more sustainable energy future.

What are the market trends shaping the Electrical Conductors For Power Industry Industry?

  • The power cables market is experiencing a significant growth trend. Sales of power cables are projected to increase in the upcoming period.
  • The European energy market has witnessed significant growth in recent years, with a focus on improving energy security and increasing the use of renewable energy sources. In 2015, the European Commission invested € 530 million to establish a more integrated energy market and enhance energy security. By 2024, over half of the electricity generated in the EU is expected to come from renewable sources. To facilitate the transmission of large quantities of electricity across borders, high-voltage power cables are becoming a preferred choice. Power quality is a crucial factor in the selection of electrical conductors for power distribution networks. Skin effect and insulation materials play significant roles in ensuring efficient power transmission.
  • Conductor maintenance is essential to ensure the longevity and reliability of power systems. Both bare conductors and insulated conductors have their advantages, with the choice depending on the specific application. HVDC power systems are economically viable for long-distance bulk power delivery. The European projects aim to remove hindrances to the growth of the internal energy market, including the implementation of HVDC power systems and upgrading existing power distribution networks. Solar power is another growing sector in the power industry, with energy storage solutions becoming increasingly important for efficient energy management. Insulated conductors are widely used in overhead power lines due to their ability to reduce power losses and improve power quality.
  • Conductor testing is crucial to ensure the reliability and safety of power systems. The power industry is continuously evolving, with a focus on energy efficiency, power quality, and the integration of renewable energy sources. Nuclear power remains an essential part of the power mix, with ongoing research and development aimed at improving safety and efficiency.

What challenges does the Electrical Conductors For Power Industry Industry face during its growth?

  • The growth of the electrical power industry is significantly impacted by the complexities and challenges inherent in installing and maintaining electrical power cables. These challenges, which include factors such as extreme weather conditions, terrain difficulties, and the need for continuous maintenance, present significant hurdles that must be addressed in order to ensure the reliable and efficient delivery of power to consumers. 
  • Electrical conductors play a crucial role in the power industry, particularly in the transmission and distribution of electricity from power plants to electrical grids. The selection and installation of conductors, such as bundled conductors and AAC conductors, are essential for optimal voltage regulation and minimizing power loss. However, the process is capital-intensive and complex, involving the careful consideration of various factors. The selection of a cable laying path is a significant challenge due to the need for minimal risk and easy access for maintenance. This process is especially important as cables are expected to last for at least 25 years.
  • Obtaining permission from authorities to lay cables through different territories is also a complex and time-consuming process. Moreover, conductors must meet various standards, including IEC standards, for voltage regulation, lightning protection, and corrosion protection. In the context of renewable energy sources like hydroelectric power, wind power, and smart grids, conductors must also be designed to withstand harsh environments and extreme weather conditions. The installation process also requires the use of conductor splices and addressing issues like the proximity effect to ensure efficient power transfer. A life cycle assessment is necessary to evaluate the environmental impact of conductor selection and installation, making it a critical consideration for sustainable power generation.

Exclusive Customer Landscape

The electrical conductors market for power industry forecasting report includes the adoption lifecycle of the market, covering from the innovator's stage to the laggard's stage. It focuses on adoption rates in different regions based on penetration. Furthermore, the electrical conductors market for power industry report also includes key purchase criteria and drivers of price sensitivity to help companies evaluate and develop their market growth analysis strategies.

Electrical Conductors Market For Power Industry Share by Geography

 Customer Landscape

Key Companies & Market Insights

Companies are implementing various strategies, such as strategic alliances, electrical conductors market for power industry forecast, partnerships, mergers and acquisitions, geographical expansion, and product/service launches, to enhance their presence in the industry.

3M Co. - The company specializes in advanced electrical conductors, specifically the ACCR high capacity transmission conductor. This innovative product features a robust aluminum matrix core, delivering high strength and lightweight advantages for efficient power transmission.

The industry research and growth report includes detailed analyses of the competitive landscape of the market and information about key companies, including:

  • 3M Co.
  • Apar Industries Ltd.
  • Cabelte SA
  • Calmont Wire and Cable Inc.
  • CMI Ltd.
  • CTC Global Inc.
  • Diamond Power Infrastructure Ltd.
  • Finolex Cables Ltd.
  • Furukawa Electric Co. Ltd.
  • Gupta Power Infrastructure Ltd.
  • HELUKABEL Romania Srl
  • Hi tech Conductors (p) Ltd.
  • KEI Industries Ltd.
  • Lamifil NV
  • Nexans SA
  • Prysmian SpA
  • Saudi Cable Co.
  • Sterlite Power Transmission Ltd.
  • Sumitomo Electric Industries Ltd.
  • Taihan Cable and Solution Co. Ltd.

Qualitative and quantitative analysis of companies has been conducted to help clients understand the wider business environment as well as the strengths and weaknesses of key industry players. Data is qualitatively analyzed to categorize companies as pure play, category-focused, industry-focused, and diversified; it is quantitatively analyzed to categorize companies as dominant, leading, strong, tentative, and weak.

Recent Development and News in Electrical Conductors Market For Power Industry

  • In January 2024, ABB, a leading technology provider, launched its new high-performance aluminum conductor aluminum alloy (ACA) product, Alumacon Alfa, designed for high-voltage power transmission. This innovation is expected to reduce energy losses and improve the overall efficiency of power transmission networks (ABB Press Release).
  • In March 2024, Siemens Energy and Enel Green Power signed a strategic partnership agreement to collaborate on the development, manufacturing, and installation of high-voltage direct current (HVDC) transmission lines. This collaboration aims to accelerate the transition to renewable energy sources and decarbonize power grids (Siemens Energy Press Release).
  • In May 2024, Prysmian Group, a global leader in energy and telecom cable systems, announced the acquisition of General Cable Corporation, a significant player in the electrical wire and cable industry. This merger is expected to strengthen Prysmian's position in the North American market and expand its product portfolio (Prysmian Group Press Release).
  • In April 2025, the European Union approved the new regulations for the Circular Economy Action Plan, which includes a target to recycle 85% of used electrical cables by 2030. This initiative is expected to boost the demand for recycled electrical conductors and contribute to the reduction of electronic waste (European Commission Press Release).

Research Analyst Overview

  • The electrical conductors market in the power industry is experiencing significant advancements, driven by the integration of technology and data-driven solutions. Smart sensors and IoT sensors are increasingly being used for fault location and detection, enhancing grid stability and improving energy management systems. Power electronics and fiber optics play a crucial role in data transmission and network optimization, enabling real-time monitoring and analysis of power grids. Mechanical strength and fatigue resistance are essential considerations in conductor manufacturing, ensuring reliable performance under various operating conditions. Quality control and supply chain management are key focus areas for ensuring consistent product standards and timely delivery.
  • 5G networks and big data are transforming the power industry, enabling advanced applications such as demand response, network security, and load balancing. Data analytics and artificial intelligence are being used to optimize conductor design and insulator materials for improved thermal stability and creep resistance. Remote monitoring and wireless communication are essential for digital twins and network security, allowing for real-time fault detection and network optimization. Network security is becoming increasingly important as power grids become more interconnected and digitized. In conclusion, the electrical conductors market for the power industry is undergoing significant changes, driven by advancements in technology, data analytics, and network optimization.
  • Smart sensors, power electronics, fiber optics, and data transmission are key areas of focus, along with mechanical strength, quality control, and supply chain management. The integration of 5G networks, big data, and artificial intelligence is transforming the industry, enabling new applications and improving grid stability and efficiency.

Dive into Technavio's robust research methodology, blending expert interviews, extensive data synthesis, and validated models for unparalleled Electrical Conductors Market For Power Industry insights. See full methodology.

Market Scope

Report Coverage

Details

Page number

243

Base year

2024

Historic period

2019-2023

Forecast period

2025-2029

Growth momentum & CAGR

Accelerate at a CAGR of 6.9%

Market growth 2025-2029

USD 14831.1 million

Market structure

Fragmented

YoY growth 2024-2025(%)

6.3

Key countries

US, China, India, Germany, Japan, France, UK, Canada, Italy, and Spain

Competitive landscape

Leading Companies, Market Positioning of Companies, Competitive Strategies, and Industry Risks

Request Free Sample

What are the Key Data Covered in this Electrical Conductors Market For Power Industry Research and Growth Report?

  • CAGR of the Electrical Conductors For Power Industry industry during the forecast period
  • Detailed information on factors that will drive the growth and forecasting between 2025 and 2029
  • Precise estimation of the size of the market and its contribution of the industry in focus to the parent market
  • Accurate predictions about upcoming growth and trends and changes in consumer behaviour
  • Growth of the market across APAC, Europe, North America, South America, and Middle East and Africa
  • Thorough analysis of the market's competitive landscape and detailed information about companies
  • Comprehensive analysis of factors that will challenge the electrical conductors market for power industry growth of industry companies

We can help! Our analysts can customize this electrical conductors market for power industry research report to meet your requirements.

Get in touch

1 Executive Summary

  • 1.1 Market overview
    • Executive Summary - Chart on Market Overview
    • Executive Summary - Data Table on Market Overview
    • Executive Summary - Chart on Global Market Characteristics
    • Executive Summary - Chart on Market by Geography
    • Executive Summary - Chart on Market Segmentation by Application
    • Executive Summary - Chart on Market Segmentation by Type
    • Executive Summary - Chart on Market Segmentation by End-user
    • Executive Summary - Chart on Market Segmentation by Material
    • Executive Summary - Chart on Incremental Growth
    • Executive Summary - Data Table on Incremental Growth
    • Executive Summary - Chart on Company Market Positioning

2 Technavio Analysis

  • 2.1 Analysis of price sensitivity, lifecycle, customer purchase basket, adoption rates, and purchase criteria
    • Analysis of price sensitivity, lifecycle, customer purchase basket, adoption rates, and purchase criteria
  • 2.2 Criticality of inputs and Factors of differentiation
    • Overview on criticality of inputs and factors of differentiation
  • 2.3 Factors of disruption
    • Overview on factors of disruption
  • 2.4 Impact of drivers and challenges
    • Impact of drivers and challenges in 2024 and 2029

3 Market Landscape

  • 3.1 Market ecosystem
    • Parent Market
    • Data Table on - Parent Market
  • 3.2 Market characteristics
    • Market characteristics analysis
  • 3.3 Value chain analysis
    • Value chain analysis

4 Market Sizing

  • 4.1 Market definition
    • Offerings of companies included in the market definition
  • 4.2 Market segment analysis
    • Market segments
  • 4.3 Market size 2024
    • 4.4 Market outlook: Forecast for 2024-2029
      • Chart on Global - Market size and forecast 2024-2029 ($ million)
      • Data Table on Global - Market size and forecast 2024-2029 ($ million)
      • Chart on Global Market: Year-over-year growth 2024-2029 (%)
      • Data Table on Global Market: Year-over-year growth 2024-2029 (%)

    5 Historic Market Size

    • 5.1 Global Electrical Conductors Market For Power Industry 2019 - 2023
      • Historic Market Size - Data Table on Global Electrical Conductors Market For Power Industry 2019 - 2023 ($ million)
    • 5.2 Application segment analysis 2019 - 2023
      • Historic Market Size - Application Segment 2019 - 2023 ($ million)
    • 5.3 Type segment analysis 2019 - 2023
      • Historic Market Size - Type Segment 2019 - 2023 ($ million)
    • 5.4 End-user segment analysis 2019 - 2023
      • Historic Market Size - End-user Segment 2019 - 2023 ($ million)
    • 5.5 Material segment analysis 2019 - 2023
      • Historic Market Size - Material Segment 2019 - 2023 ($ million)
    • 5.6 Geography segment analysis 2019 - 2023
      • Historic Market Size - Geography Segment 2019 - 2023 ($ million)
    • 5.7 Country segment analysis 2019 - 2023
      • Historic Market Size - Country Segment 2019 - 2023 ($ million)

    6 Qualitative Analysis

    • 6.1 Impact of AI on the Global Electrical Conductors Market for Power Industry

      7 Five Forces Analysis

      • 7.1 Five forces summary
        • Five forces analysis - Comparison between 2024 and 2029
      • 7.2 Bargaining power of buyers
        • Bargaining power of buyers - Impact of key factors 2024 and 2029
      • 7.3 Bargaining power of suppliers
        • Bargaining power of suppliers - Impact of key factors in 2024 and 2029
      • 7.4 Threat of new entrants
        • Threat of new entrants - Impact of key factors in 2024 and 2029
      • 7.5 Threat of substitutes
        • Threat of substitutes - Impact of key factors in 2024 and 2029
      • 7.6 Threat of rivalry
        • Threat of rivalry - Impact of key factors in 2024 and 2029
      • 7.7 Market condition
        • Chart on Market condition - Five forces 2024 and 2029

      8 Market Segmentation by Application

      • 8.1 Market segments
        • Chart on Application - Market share 2024-2029 (%)
        • Data Table on Application - Market share 2024-2029 (%)
      • 8.2 Comparison by Application
        • Chart on Comparison by Application
        • Data Table on Comparison by Application
      • 8.3 Power transmission - Market size and forecast 2024-2029
        • Chart on Power transmission - Market size and forecast 2024-2029 ($ million)
        • Data Table on Power transmission - Market size and forecast 2024-2029 ($ million)
        • Chart on Power transmission - Year-over-year growth 2024-2029 (%)
        • Data Table on Power transmission - Year-over-year growth 2024-2029 (%)
      • 8.4 Power distribution - Market size and forecast 2024-2029
        • Chart on Power distribution - Market size and forecast 2024-2029 ($ million)
        • Data Table on Power distribution - Market size and forecast 2024-2029 ($ million)
        • Chart on Power distribution - Year-over-year growth 2024-2029 (%)
        • Data Table on Power distribution - Year-over-year growth 2024-2029 (%)
      • 8.5 Others - Market size and forecast 2024-2029
        • Chart on Others - Market size and forecast 2024-2029 ($ million)
        • Data Table on Others - Market size and forecast 2024-2029 ($ million)
        • Chart on Others - Year-over-year growth 2024-2029 (%)
        • Data Table on Others - Year-over-year growth 2024-2029 (%)
      • 8.6 Market opportunity by Application
        • Market opportunity by Application ($ million)
        • Data Table on Market opportunity by Application ($ million)

      9 Market Segmentation by Type

      • 9.1 Market segments
        • Chart on Type - Market share 2024-2029 (%)
        • Data Table on Type - Market share 2024-2029 (%)
      • 9.2 Comparison by Type
        • Chart on Comparison by Type
        • Data Table on Comparison by Type
      • 9.3 Power cables - Market size and forecast 2024-2029
        • Chart on Power cables - Market size and forecast 2024-2029 ($ million)
        • Data Table on Power cables - Market size and forecast 2024-2029 ($ million)
        • Chart on Power cables - Year-over-year growth 2024-2029 (%)
        • Data Table on Power cables - Year-over-year growth 2024-2029 (%)
      • 9.4 Transformer - Market size and forecast 2024-2029
        • Chart on Transformer - Market size and forecast 2024-2029 ($ million)
        • Data Table on Transformer - Market size and forecast 2024-2029 ($ million)
        • Chart on Transformer - Year-over-year growth 2024-2029 (%)
        • Data Table on Transformer - Year-over-year growth 2024-2029 (%)
      • 9.5 Busbar - Market size and forecast 2024-2029
        • Chart on Busbar - Market size and forecast 2024-2029 ($ million)
        • Data Table on Busbar - Market size and forecast 2024-2029 ($ million)
        • Chart on Busbar - Year-over-year growth 2024-2029 (%)
        • Data Table on Busbar - Year-over-year growth 2024-2029 (%)
      • 9.6 Submarine power cables - Market size and forecast 2024-2029
        • Chart on Submarine power cables - Market size and forecast 2024-2029 ($ million)
        • Data Table on Submarine power cables - Market size and forecast 2024-2029 ($ million)
        • Chart on Submarine power cables - Year-over-year growth 2024-2029 (%)
        • Data Table on Submarine power cables - Year-over-year growth 2024-2029 (%)
      • 9.7 Market opportunity by Type
        • Market opportunity by Type ($ million)
        • Data Table on Market opportunity by Type ($ million)

      10 Market Segmentation by End-user

      • 10.1 Market segments
        • Chart on End-user - Market share 2024-2029 (%)
        • Data Table on End-user - Market share 2024-2029 (%)
      • 10.2 Comparison by End-user
        • Chart on Comparison by End-user
        • Data Table on Comparison by End-user
      • 10.3 Utilities - Market size and forecast 2024-2029
        • Chart on Utilities - Market size and forecast 2024-2029 ($ million)
        • Data Table on Utilities - Market size and forecast 2024-2029 ($ million)
        • Chart on Utilities - Year-over-year growth 2024-2029 (%)
        • Data Table on Utilities - Year-over-year growth 2024-2029 (%)
      • 10.4 Industrial - Market size and forecast 2024-2029
        • Chart on Industrial - Market size and forecast 2024-2029 ($ million)
        • Data Table on Industrial - Market size and forecast 2024-2029 ($ million)
        • Chart on Industrial - Year-over-year growth 2024-2029 (%)
        • Data Table on Industrial - Year-over-year growth 2024-2029 (%)
      • 10.5 Commercial - Market size and forecast 2024-2029
        • Chart on Commercial - Market size and forecast 2024-2029 ($ million)
        • Data Table on Commercial - Market size and forecast 2024-2029 ($ million)
        • Chart on Commercial - Year-over-year growth 2024-2029 (%)
        • Data Table on Commercial - Year-over-year growth 2024-2029 (%)
      • 10.6 Residential - Market size and forecast 2024-2029
        • Chart on Residential - Market size and forecast 2024-2029 ($ million)
        • Data Table on Residential - Market size and forecast 2024-2029 ($ million)
        • Chart on Residential - Year-over-year growth 2024-2029 (%)
        • Data Table on Residential - Year-over-year growth 2024-2029 (%)
      • 10.7 Market opportunity by End-user
        • Market opportunity by End-user ($ million)
        • Data Table on Market opportunity by End-user ($ million)

      11 Market Segmentation by Material

      • 11.1 Market segments
        • Chart on Material - Market share 2024-2029 (%)
        • Data Table on Material - Market share 2024-2029 (%)
      • 11.2 Comparison by Material
        • Chart on Comparison by Material
        • Data Table on Comparison by Material
      • 11.3 Copper conductors - Market size and forecast 2024-2029
        • Chart on Copper conductors - Market size and forecast 2024-2029 ($ million)
        • Data Table on Copper conductors - Market size and forecast 2024-2029 ($ million)
        • Chart on Copper conductors - Year-over-year growth 2024-2029 (%)
        • Data Table on Copper conductors - Year-over-year growth 2024-2029 (%)
      • 11.4 Aluminum conductors - Market size and forecast 2024-2029
        • Chart on Aluminum conductors - Market size and forecast 2024-2029 ($ million)
        • Data Table on Aluminum conductors - Market size and forecast 2024-2029 ($ million)
        • Chart on Aluminum conductors - Year-over-year growth 2024-2029 (%)
        • Data Table on Aluminum conductors - Year-over-year growth 2024-2029 (%)
      • 11.5 Others - Market size and forecast 2024-2029
        • Chart on Others - Market size and forecast 2024-2029 ($ million)
        • Data Table on Others - Market size and forecast 2024-2029 ($ million)
        • Chart on Others - Year-over-year growth 2024-2029 (%)
        • Data Table on Others - Year-over-year growth 2024-2029 (%)
      • 11.6 Market opportunity by Material
        • Market opportunity by Material ($ million)
        • Data Table on Market opportunity by Material ($ million)

      12 Customer Landscape

      • 12.1 Customer landscape overview
        • Analysis of price sensitivity, lifecycle, customer purchase basket, adoption rates, and purchase criteria

      13 Geographic Landscape

      • 13.1 Geographic segmentation
        • Chart on Market share by geography 2024-2029 (%)
        • Data Table on Market share by geography 2024-2029 (%)
      • 13.2 Geographic comparison
        • Chart on Geographic comparison
        • Data Table on Geographic comparison
      • 13.3 APAC - Market size and forecast 2024-2029
        • Chart on APAC - Market size and forecast 2024-2029 ($ million)
        • Data Table on APAC - Market size and forecast 2024-2029 ($ million)
        • Chart on APAC - Year-over-year growth 2024-2029 (%)
        • Data Table on APAC - Year-over-year growth 2024-2029 (%)
      • 13.4 Europe - Market size and forecast 2024-2029
        • Chart on Europe - Market size and forecast 2024-2029 ($ million)
        • Data Table on Europe - Market size and forecast 2024-2029 ($ million)
        • Chart on Europe - Year-over-year growth 2024-2029 (%)
        • Data Table on Europe - Year-over-year growth 2024-2029 (%)
      • 13.5 North America - Market size and forecast 2024-2029
        • Chart on North America - Market size and forecast 2024-2029 ($ million)
        • Data Table on North America - Market size and forecast 2024-2029 ($ million)
        • Chart on North America - Year-over-year growth 2024-2029 (%)
        • Data Table on North America - Year-over-year growth 2024-2029 (%)
      • 13.6 South America - Market size and forecast 2024-2029
        • Chart on South America - Market size and forecast 2024-2029 ($ million)
        • Data Table on South America - Market size and forecast 2024-2029 ($ million)
        • Chart on South America - Year-over-year growth 2024-2029 (%)
        • Data Table on South America - Year-over-year growth 2024-2029 (%)
      • 13.7 Middle East and Africa - Market size and forecast 2024-2029
        • Chart on Middle East and Africa - Market size and forecast 2024-2029 ($ million)
        • Data Table on Middle East and Africa - Market size and forecast 2024-2029 ($ million)
        • Chart on Middle East and Africa - Year-over-year growth 2024-2029 (%)
        • Data Table on Middle East and Africa - Year-over-year growth 2024-2029 (%)
      • 13.8 US - Market size and forecast 2024-2029
        • Chart on US - Market size and forecast 2024-2029 ($ million)
        • Data Table on US - Market size and forecast 2024-2029 ($ million)
        • Chart on US - Year-over-year growth 2024-2029 (%)
        • Data Table on US - Year-over-year growth 2024-2029 (%)
      • 13.9 China - Market size and forecast 2024-2029
        • Chart on China - Market size and forecast 2024-2029 ($ million)
        • Data Table on China - Market size and forecast 2024-2029 ($ million)
        • Chart on China - Year-over-year growth 2024-2029 (%)
        • Data Table on China - Year-over-year growth 2024-2029 (%)
      • 13.10 India - Market size and forecast 2024-2029
        • Chart on India - Market size and forecast 2024-2029 ($ million)
        • Data Table on India - Market size and forecast 2024-2029 ($ million)
        • Chart on India - Year-over-year growth 2024-2029 (%)
        • Data Table on India - Year-over-year growth 2024-2029 (%)
      • 13.11 Germany - Market size and forecast 2024-2029
        • Chart on Germany - Market size and forecast 2024-2029 ($ million)
        • Data Table on Germany - Market size and forecast 2024-2029 ($ million)
        • Chart on Germany - Year-over-year growth 2024-2029 (%)
        • Data Table on Germany - Year-over-year growth 2024-2029 (%)
      • 13.12 Japan - Market size and forecast 2024-2029
        • Chart on Japan - Market size and forecast 2024-2029 ($ million)
        • Data Table on Japan - Market size and forecast 2024-2029 ($ million)
        • Chart on Japan - Year-over-year growth 2024-2029 (%)
        • Data Table on Japan - Year-over-year growth 2024-2029 (%)
      • 13.13 France - Market size and forecast 2024-2029
        • Chart on France - Market size and forecast 2024-2029 ($ million)
        • Data Table on France - Market size and forecast 2024-2029 ($ million)
        • Chart on France - Year-over-year growth 2024-2029 (%)
        • Data Table on France - Year-over-year growth 2024-2029 (%)
      • 13.14 Canada - Market size and forecast 2024-2029
        • Chart on Canada - Market size and forecast 2024-2029 ($ million)
        • Data Table on Canada - Market size and forecast 2024-2029 ($ million)
        • Chart on Canada - Year-over-year growth 2024-2029 (%)
        • Data Table on Canada - Year-over-year growth 2024-2029 (%)
      • 13.15 UK - Market size and forecast 2024-2029
        • Chart on UK - Market size and forecast 2024-2029 ($ million)
        • Data Table on UK - Market size and forecast 2024-2029 ($ million)
        • Chart on UK - Year-over-year growth 2024-2029 (%)
        • Data Table on UK - Year-over-year growth 2024-2029 (%)
      • 13.16 Italy - Market size and forecast 2024-2029
        • Chart on Italy - Market size and forecast 2024-2029 ($ million)
        • Data Table on Italy - Market size and forecast 2024-2029 ($ million)
        • Chart on Italy - Year-over-year growth 2024-2029 (%)
        • Data Table on Italy - Year-over-year growth 2024-2029 (%)
      • 13.17 Spain - Market size and forecast 2024-2029
        • Chart on Spain - Market size and forecast 2024-2029 ($ million)
        • Data Table on Spain - Market size and forecast 2024-2029 ($ million)
        • Chart on Spain - Year-over-year growth 2024-2029 (%)
        • Data Table on Spain - Year-over-year growth 2024-2029 (%)
      • 13.18 Market opportunity by geography
        • Market opportunity by geography ($ million)
        • Data Tables on Market opportunity by geography ($ million)

      14 Drivers, Challenges, and Opportunity/Restraints

      • 14.1 Market drivers
        • 14.2 Market challenges
          • 14.3 Impact of drivers and challenges
            • Impact of drivers and challenges in 2024 and 2029
          • 14.4 Market opportunities/restraints

            15 Competitive Landscape

            • 15.1 Overview
              • 15.2 Competitive Landscape
                • Overview on criticality of inputs and factors of differentiation
              • 15.3 Landscape disruption
                • Overview on factors of disruption
              • 15.4 Industry risks
                • Impact of key risks on business

              16 Competitive Analysis

              • 16.1 Companies profiled
                • Companies covered
              • 16.2 Company ranking index
                • Company ranking index
              • 16.3 Market positioning of companies
                • Matrix on companies position and classification
              • 3M Co.
                • 3M Co. - Overview
                • 3M Co. - Business segments
                • 3M Co. - Key news
                • 3M Co. - Key offerings
                • 3M Co. - Segment focus
                • SWOT
              • 16.5 Apar Industries Ltd.
                • Apar Industries Ltd. - Overview
                • Apar Industries Ltd. - Business segments
                • Apar Industries Ltd. - Key offerings
                • Apar Industries Ltd. - Segment focus
                • SWOT
              • 16.6 Cabelte SA
                • Cabelte SA - Overview
                • Cabelte SA - Product / Service
                • Cabelte SA - Key offerings
                • SWOT
              • 16.7 CTC Global Inc.
                • CTC Global Inc. - Overview
                • CTC Global Inc. - Product / Service
                • CTC Global Inc. - Key offerings
                • SWOT
              • 16.8 Diamond Power Infrastructure Ltd.
                • Diamond Power Infrastructure Ltd. - Overview
                • Diamond Power Infrastructure Ltd. - Product / Service
                • Diamond Power Infrastructure Ltd. - Key offerings
                • SWOT
              • 16.9 Furukawa Electric Co. Ltd.
                • Furukawa Electric Co. Ltd. - Overview
                • Furukawa Electric Co. Ltd. - Business segments
                • Furukawa Electric Co. Ltd. - Key offerings
                • Furukawa Electric Co. Ltd. - Segment focus
                • SWOT
              • 16.10 Gupta Power Infrastructure Ltd.
                • Gupta Power Infrastructure Ltd. - Overview
                • Gupta Power Infrastructure Ltd. - Product / Service
                • Gupta Power Infrastructure Ltd. - Key offerings
                • SWOT
              • 16.11 Hi tech Conductors (p) Ltd.
                • Hi tech Conductors (p) Ltd. - Overview
                • Hi tech Conductors (p) Ltd. - Product / Service
                • Hi tech Conductors (p) Ltd. - Key offerings
                • SWOT
              • 16.12 KEI Industries Ltd.
                • KEI Industries Ltd. - Overview
                • KEI Industries Ltd. - Business segments
                • KEI Industries Ltd. - Key offerings
                • KEI Industries Ltd. - Segment focus
                • SWOT
              • 16.13 Lamifil NV
                • Lamifil NV - Overview
                • Lamifil NV - Product / Service
                • Lamifil NV - Key offerings
                • SWOT
              • 16.14 Nexans SA
                • Nexans SA - Overview
                • Nexans SA - Business segments
                • Nexans SA - Key news
                • Nexans SA - Key offerings
                • Nexans SA - Segment focus
                • SWOT
              • 16.15 Prysmian SpA
                • Prysmian SpA - Overview
                • Prysmian SpA - Business segments
                • Prysmian SpA - Key news
                • Prysmian SpA - Key offerings
                • Prysmian SpA - Segment focus
                • SWOT
              • 16.16 Sterlite Power Transmission Ltd.
                • Sterlite Power Transmission Ltd. - Overview
                • Sterlite Power Transmission Ltd. - Product / Service
                • Sterlite Power Transmission Ltd. - Key offerings
                • SWOT
              • 16.17 Sumitomo Electric Industries Ltd.
                • Sumitomo Electric Industries Ltd. - Overview
                • Sumitomo Electric Industries Ltd. - Product / Service
                • Sumitomo Electric Industries Ltd. - Key offerings
                • SWOT
              • 16.18 Taihan Cable and Solution Co. Ltd.
                • Taihan Cable and Solution Co. Ltd. - Overview
                • Taihan Cable and Solution Co. Ltd. - Product / Service
                • Taihan Cable and Solution Co. Ltd. - Key offerings
                • SWOT

              17 Appendix

              • 17.1 Scope of the report
                • 17.2 Inclusions and exclusions checklist
                  • Inclusions checklist
                  • Exclusions checklist
                • 17.3 Currency conversion rates for US$
                  • Currency conversion rates for US$
                • 17.4 Research methodology
                  • Research methodology
                • 17.5 Data procurement
                  • Information sources
                • 17.6 Data validation
                  • Data validation
                • 17.7 Validation techniques employed for market sizing
                  • Validation techniques employed for market sizing
                • 17.8 Data synthesis
                  • Data synthesis
                • 17.9 360 degree market analysis
                  • 360 degree market analysis
                • 17.10 List of abbreviations
                  • List of abbreviations

                Research Methodology

                Technavio presents a detailed picture of the market by way of study, synthesis, and summation of data from multiple sources. The analysts have presented the various facets of the market with a particular focus on identifying the key industry influencers. The data thus presented is comprehensive, reliable, and the result of extensive research, both primary and secondary.

                INFORMATION SOURCES

                Primary sources

                • Manufacturers and suppliers
                • Channel partners
                • Industry experts
                • Strategic decision makers

                Secondary sources

                • Industry journals and periodicals
                • Government data
                • Financial reports of key industry players
                • Historical data
                • Press releases

                DATA ANALYSIS

                Data Synthesis

                • Collation of data
                • Estimation of key figures
                • Analysis of derived insights

                Data Validation

                • Triangulation with data models
                • Reference against proprietary databases
                • Corroboration with industry experts

                REPORT WRITING

                Qualitative

                • Market drivers
                • Market challenges
                • Market trends
                • Five forces analysis

                Quantitative

                • Market size and forecast
                • Market segmentation
                • Geographical insights
                • Competitive landscape

                Interested in this report?

                Get your sample now to see our research methodology and insights!

                Download Now

                Frequently Asked Questions

                Electrical Conductors For Power Industry market growth will increase by $ 14831.1 mn during 2025-2029.

                The Electrical Conductors For Power Industry market is expected to grow at a CAGR of 6.9% during 2025-2029.

                Electrical Conductors For Power Industry market is segmented by Application( Power transmission, Power distribution, Others, Submarine power cables) Type( Power cables, Transformer, Busbar, Submarine power cables, MEA) End-user( Utilities, Industrial, Commercial, Residential, Middle East and Africa)

                3M Co., Apar Industries Ltd., Cabelte SA, Calmont Wire and Cable Inc., CMI Ltd., CTC Global Inc., Diamond Power Infrastructure Ltd., Finolex Cables Ltd., Furukawa Electric Co. Ltd., Gupta Power Infrastructure Ltd., HELUKABEL Romania Srl, Hi tech Conductors (p) Ltd., KEI Industries Ltd., Lamifil NV, Nexans SA, Prysmian SpA, Saudi Cable Co., Sterlite Power Transmission Ltd., Sumitomo Electric Industries Ltd., Taihan Cable and Solution Co. Ltd. are a few of the key vendors in the Electrical Conductors For Power Industry market.

                APAC will register the highest growth rate of 39% among the other regions. Therefore, the Electrical Conductors For Power Industry market in APAC is expected to garner significant business opportunities for the vendors during the forecast period.

                US, China, India, Germany, Japan, France, UK, Canada, Italy, Spain

                • Rising investment in power transmission and distributionThe major factor contributing to the growth of the electrical conductor market for the power industry is rising investment in the transmission and distribution network for the effective transmission of power to various electrical equipment at different stages of the network. The global investments in the transmission and distribution sectors also create profit pools for key customers globally. As a result of this is the driving factor this market.
                • the transmission and distribution market has a lot of room for expansion is the driving factor this market.
                • given the rising need to replace the installed base of aging transformers. Also is the driving factor this market.
                • the increasing technological advancements and an increase in government investments in research and development globally to expand transmission and distribution networks for power generation from renewable energy resources are expected to open up new opportunities in the electrical conductors market for power industry. Furthermore is the driving factor this market.
                • the installation of underground transmission systems is driving the demand for electrical conductors. The growth in the transmission and distribution network and the increase in the demand for renewable sources will drive the growth of the global electrical conductors market for power industry during the forecast period. is the driving factor this market.

                The Electrical Conductors For Power Industry market vendors should focus on grabbing business opportunities from the Power transmission segment as it accounted for the largest market share in the base year.