Electrochromic Storage Devices Market Analysis North America, Europe, APAC, Middle East and Africa, South America - US, Canada, China, Germany, UK - Size and Forecast 2024-2028

Electrochromic Storage Devices Market Analysis North America, Europe, APAC, Middle East and Africa, South America - US, Canada, China, Germany, UK - Size and Forecast 2024-2028

Published: Apr 2024 169 Pages SKU: IRTNTR77875

Market Overview at a Glance

$4.21 B
Market Opportunity
12.93%
CAGR
11.4
YoY growth 2023-2024(%)

Electrochromic Storage Devices Market Size 2024-2028

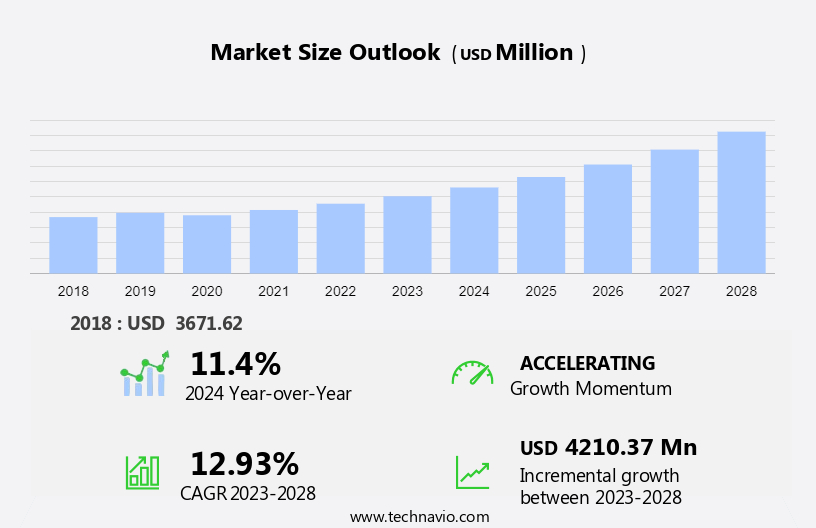
The electrochromic storage devices market size is forecast to increase by USD 4.21 billion at a CAGR of 12.93% between 2023 and 2028.

  • Electrochromic storage devices (ECDs) are gaining significant traction In the energy storage market due to the increasing demand for energy-efficient solutions. These devices offer several advantages, including high power density, long cycle life, and fast charge-discharge rates. The market is witnessing technological advancements, leading to the development of more efficient and cost-effective ECDs. However, the high initial costs associated with these devices remain a significant challenge, limiting their widespread adoption. To address this challenge, manufacturers are focusing on reducing the material costs and improving the manufacturing processes. Furthermore, government initiatives and incentives to promote the adoption of renewable energy and energy storage solutions are expected to drive the market growth. In summary, the market is poised for growth due to the increasing demand for energy-efficient solutions, technological advancements, and government initiatives, despite the high initial costs.

What will be the Size of the Electrochromic Storage Devices Market During the Forecast Period?

Electrochromic Storage Devices Market Size

 Request Free Sample

  • The market encompasses a range of energy storage technologies, including electrochromic batteries and supercapacitors, which utilize electrochromic materials to modify their optical properties in response to electrical stimulation. These materials, often composed of conductive polymers or transition metal oxides, undergo redox reactions that result in changes in color, opacity, and reflectance. Electrochromic storage devices find applications in various sectors, such as electrochromic windows for heat gain and glare reduction, electrochromic mirrors for automobile rearview mirrors, and electrochromic displays for signage and advertising. The market's growth is driven by the increasing demand for energy-efficient and smart technologies, as well as advancements in electrochromic materials and manufacturing processes.
  • Moreover, ionic conductive electrolytes and conductive glass are key components In the development of these devices, enabling faster response times and improved performance. The market is expected to grow significantly In the coming years, offering opportunities for innovation and technological advancements In the field of energy storage and optoelectronics.

How is this Electrochromic Storage Devices Industry segmented and which is the largest segment?

The electrochromic storage devices industry research report provides comprehensive data (region-wise segment analysis), with forecasts and estimates in "USD billion" for the period 2024-2028, as well as historical data from 2018-2022 for the following segments.
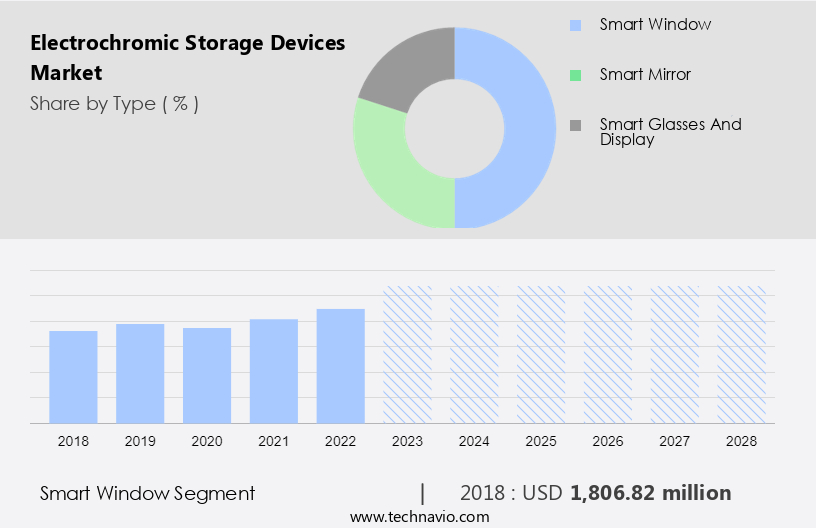
  • Type
    • Smart window
    • Smart mirror
    • Smart glasses and display
  • Application
    • Automotive and transportation
    • Building and construction
    • Electric and electronic devices and eyewear
  • Geography
    • North America
      • Canada
      • US
    • Europe
      • Germany
      • UK
    • APAC
      • China
    • Middle East and Africa
    • South America

By Type Insights

  • The smart window segment is estimated to witness significant growth during the forecast period.

Electrochromic storage devices, specifically smart windows, represent an advanced solution for controlling natural light and enhancing energy efficiency in commercial buildings. These devices employ electrochromic technology, which enables the glass to alter its optical properties in response to electrical voltage. By adjusting the tint level, smart windows regulate sunlight penetration, mitigating glare and heat gain during peak hours while maximizing daylight utilization. This dynamic control empowers occupants to create personalized environments, fostering productivity, well-being, and sustainability. Electrochromic materials, such as metal oxides and conductive polymers, play a crucial role in this technology. Ionic conductive electrolytes and ion layers facilitate voltage-driven redox reactions, altering the material's optical properties.

Electrochromic Storage Devices Market Size

Get a glance at the Electrochromic Storage Devices Industry report of share of various segments Request Free Sample

The smart window segment was valued at USD 1.81 billion in 2018 and showed a gradual increase during the forecast period.

Regional Analysis

  • North America is estimated to contribute 33% to the growth of the global market during the forecast period.

Technavio's analysts have elaborately explained the regional trends and drivers that shape the market during the forecast period.

Electrochromic Storage Devices Market Share by Geography

For more insights on the market share of various regions, Request Free Sample

The market is experiencing significant growth, particularly In the automotive industry in North America. Driven by increasing per capita income and consumer awareness, there is a rising demand for advanced technologies in vehicles, including electrochromic storage devices. These devices, which use smart glass for applications such as sunroofs and moonroofs, are becoming increasingly popular due to their ability to provide comfort and safety features. The adoption of electrochromic storage devices is also being driven by the growing demand for luxury and premium vehicles in Canada and Mexico. The technology behind these devices involves the use of electrodes, battery, supercapacitor, and electrochromic materials, which undergo redox reactions when electric voltage is applied.

Market Dynamics

Our  researchers analyzed the data with 2023 as the base year, along with the key drivers, trends, and challenges. A holistic analysis of drivers will help companies refine their marketing strategies to gain a competitive advantage.

What are the key market drivers leading to the rise In the adoption of Electrochromic Storage Devices Industry?

Increasing demand for energy-efficient solutions is the key driver of the market.

  • The market is experiencing significant growth due to the increasing demand for energy-efficient solutions. These devices, including smart windows and dynamic glass, enable users to regulate light and heat transmission, thereby reducing the need for artificial lighting, heating, and cooling systems. This leads to substantial energy savings and contributes to a more sustainable indoor environment. Electrochromic storage devices function through electrodes and an ionic conductive electrolyte, which facilitate ion intercalations in electrochromic materials, such as metal oxides and conductive polymers. The material properties and device structures determine the kinetics of these redox reactions, influencing the optical properties, such as voltage-controlled light transmission, reflectance, color, and opacity.
  • Furthermore, applications of electrochromic storage devices extend beyond buildings to include smart glasses, mirrors, and displays in automobiles, consumer electronics, HVAC systems, and wearable electronics. The integration of nanotechnology further enhances the performance and functionality of these devices, making them an attractive solution for energy efficiency and sustainability.

What are the market trends shaping the Electrochromic Storage Devices Industry?

Technological advancements in electrochromic storage devices is the upcoming market trend.

  • The market is experiencing significant advancements, propelling the industry forward with innovative solutions. Notable progress includes the development of superior electrochromic materials, such as those using suspended particle devices (SPDs) by companies like Research Frontiers Inc. SPDs consist of microscopic particles suspended in a liquid or polymer matrix, which adjust their orientation in response to an electric field, altering the material's opacity or tint. This technology is revolutionizing smart glass applications, with potential uses in various industries. Electrochromic materials are essential components of these devices, with key properties including optical properties, voltage, and material composition. Metal oxides, such as tungsten oxide and cathode electrochromic oxide, are commonly used as active layers in electrochromic windows and displays.
  • Moreover, ionic conductive electrolytes and ion layers play crucial roles in facilitating redox reactions, which enable the electrochromic effect. Electrochromic storage devices offer numerous benefits, including energy efficiency, dynamic control of light transmission, heat gain reduction, and glare reduction. These advantages make them suitable for various applications, including smart windows, solar radiation management in commercial buildings, automobile mirrors, displays, and wearable electronics. Nanotechnology is also contributing to advancements In the field, enabling the development of thinner, lighter, and more cost-effective devices. The market dynamics are driven by factors such as the increasing demand for energy efficiency, the growing adoption of smart windows and displays, and the development of new materials and device structures.

What challenges does the Electrochromic Storage Devices Industry face during its growth?

High initial costs associated with electrochromic storage devices is a key challenge affecting the industry growth.

  • Electrochromic storage devices, which utilize electrodes and an ionic conductive electrolyte to change the optical properties of materials through redox reactions, offer advantages such as energy efficiency, solar radiation management, and dynamic control of light transmission and reflectance. Applications include smart windows, electrochromic mirrors, and displays. However, the high initial costs, which can range from USD 50 to USD 100 per square foot for residential properties and escalate significantly for commercial buildings, pose a challenge to market growth. Factors influencing cost include window size, installation complexity, and additional features like connectivity and automation. In commercial applications, costs can reach hundreds of thousands to millions of dollars for large-scale projects.
  • Furthermore, materials used in electrochromic devices include conductive polymers, transition metal oxides, and ion layer structures, which impact device structures, kinetics, and voltage performance. Applications include energy efficiency improvements in HVAC systems, solar heat gain reduction, and smart displays for consumer electronics, automobile mirrors, and wearable electronics. Nanotechnology advancements offer potential cost savings and performance enhancements.

Exclusive Customer Landscape

The electrochromic storage devices market forecasting report includes the adoption lifecycle of the market, covering from the innovator's stage to the laggard's stage. It focuses on adoption rates in different regions based on penetration. Furthermore, the electrochromic storage devices market report also includes key purchase criteria and drivers of price sensitivity to help companies evaluate and develop their market growth analysis strategies.

Electrochromic Storage Devices Market Share by Geography

 Customer Landscape

Key Companies & Market Insights

Companies are implementing various strategies, such as strategic alliances, electrochromic storage devices market forecast, partnerships, mergers and acquisitions, geographical expansion, and product/service launches, to enhance their presence In the industry.

The industry research and growth report includes detailed analyses of the competitive landscape of the market and information about key companies, including:

  • AGC Inc.
  • Apogee Enterprises Inc.
  • ChromoGenics AB
  • Compagnie de Saint Gobain
  • EssilorLuxottica
  • FlexEnable
  • Gauzy Ltd.
  • Gentex Corp.
  • Huichi Industrial Development Co. Ltd.
  • Innovative Glass Corp.
  • Intelligent Glass
  • Plansee SE
  • Polytronix Inc.
  • PPG Industries Inc.
  • Prelonic technologies
  • RavenWindow
  • Research frontiers Inc
  • Schneider Electric SE
  • Siemens AG
  • Smart Films International
  • SMART GLASS
  • Smart Glass Technologies, LLC
  • Smart Window Co. Inc.
  • View Inc
  • YFY Inc.
  • Zhuhai Shuifa Singyes New Materials Technology Co. Ltd.

Qualitative and quantitative analysis of companies has been conducted to help clients understand the wider business environment as well as the strengths and weaknesses of key industry players. Data is qualitatively analyzed to categorize companies as pure play, category-focused, industry-focused, and diversified; it is quantitatively analyzed to categorize companies as dominant, leading, strong, tentative, and weak.

Research Analyst Overview

Electrochromic storage devices represent an innovative class of energy storage technologies that offer unique advantages in various applications. These devices utilize electrochromic materials, which are capable of undergoing reversible redox reactions in response to electrical stimulation. The resulting changes in material properties lead to modifications in optical properties such as reflectance, color, opacity, and transmittance. The fundamental principle behind electrochromic devices relies on the intercalation of ions into the electrode material. The ionic conductive electrolyte facilitates the ionic transport between the electrodes, enabling the electrochromic effect. Conductive glass, a common electrode material, is often used due to its excellent ionic conductivity and optical properties.

In addition, electrochromic devices find extensive applications in various sectors, including smart windows and dynamic glass. In commercial buildings, these devices can significantly reduce energy consumption by controlling solar radiation, heat gain, and glare. The ability to modulate light transmission and reflectance in response to electrical signals offers substantial benefits in terms of energy efficiency and occupant comfort. Smart windows, incorporating electrochromic materials, can be used to create various device structures, such as electrochromic mirrors and displays. These devices can be employed in a wide range of applications, from automotive mirrors to consumer electronics. For instance, electrochromic displays can be used in HVAC systems to optimize energy usage based on solar heat gain.

Moreover, the integration of nanotechnology in electrochromic materials has led to advancements in electrochromic storage devices. This technology enables the development of high-performance materials with improved optical properties and faster kinetics. Transition metal oxides, such as tungsten oxide, have been extensively studied for their electrochromic properties due to their excellent stability and high coloration efficiency. The electrochromic effect is not limited to windows and displays. It can also be applied to various other applications, such as solar radiation management in buildings, privacy screens for wearable electronics, and auto-dimming rearview mirrors for automobiles. The potential applications of electrochromic storage devices are vast, making them an exciting area of research and development In the energy storage sector.

In summary, electrochromic storage devices offer significant advantages in energy storage and management through their unique electrochromic effect. The ability to modulate optical properties in response to electrical stimulation makes them suitable for various applications, from smart windows and displays to HVAC systems and automotive components. The ongoing research and development in this field, particularly In the area of nanotechnology, are expected to lead to further advancements and improvements In the performance and applicability of electrochromic storage devices.

Market Scope

Report Coverage

Details

Page number

169

Base year

2023

Historic period

2018-2022

Forecast period

2024-2028

Growth momentum & CAGR

Accelerate at a CAGR of 12.93%

Market growth 2024-2028

USD 4.21 billion

Market structure

Fragmented

YoY growth 2023-2024(%)

11.4

Key countries

US, Canada, China, Germany, and UK

Competitive landscape

Leading Companies, market growth and forecasting , Market Positioning of Companies, Competitive Strategies, and Industry Risks

Request Free Sample

What are the Key Data Covered in this Electrochromic Storage Devices Market Research and Growth Report?

  • CAGR of the Electrochromic Storage Devices industry during the forecast period
  • Detailed information on factors that will drive the growth and forecasting between 2024 and 2028
  • Precise estimation of the size of the market and its contribution of the industry in focus to the parent market
  • Accurate predictions about upcoming growth and trends and changes in consumer behaviour
  • Growth of the market across North America, Europe, APAC, Middle East and Africa, and South America
  • Thorough analysis of the market's competitive landscape and detailed information about companies
  • Comprehensive analysis of factors that will challenge the electrochromic storage devices market growth of industry companies

We can help! Our analysts can customize this electrochromic storage devices market research report to meet your requirements.

Get in touch

1 Executive Summary

  • 1.1 Market overview
    • Exhibit 01: Executive Summary – Chart on Market Overview
    • Exhibit 02: Executive Summary – Data Table on Market Overview
    • Exhibit 03: Executive Summary – Chart on Global Market Characteristics
    • Exhibit 04: Executive Summary – Chart on Market by Geography
    • Exhibit 05: Executive Summary – Chart on Market Segmentation by Type
    • Exhibit 06: Executive Summary – Chart on Market Segmentation by Application
    • Exhibit 07: Executive Summary – Chart on Incremental Growth
    • Exhibit 08: Executive Summary – Data Table on Incremental Growth
    • Exhibit 09: Executive Summary – Chart on Vendor Market Positioning

2 Market Landscape

  • 2.1 Market ecosystem
    • Exhibit 10: Parent market
    • Exhibit 11: Market Characteristics

3 Market Sizing

  • 3.1 Market definition
    • Exhibit 12: Offerings of vendors included in the market definition
  • 3.2 Market segment analysis
    • Exhibit 13: Market segments
  • 3.3 Market size 2023
    • 3.4 Market outlook: Forecast for 2023-2028
      • Exhibit 14: Chart on Global - Market size and forecast 2023-2028 ($ million)
      • Exhibit 15: Data Table on Global - Market size and forecast 2023-2028 ($ million)
      • Exhibit 16: Chart on Global Market: Year-over-year growth 2023-2028 (%)
      • Exhibit 17: Data Table on Global Market: Year-over-year growth 2023-2028 (%)

    4 Historic Market Size

    • 4.1 Global electrochromic storage devices market 2018 - 2022
      • Exhibit 18: Historic Market Size – Data Table on global electrochromic storage devices market 2018 - 2022 ($ million)
    • 4.2 Type Segment Analysis 2018 - 2022
      • Exhibit 19: Historic Market Size – Type Segment 2018 - 2022 ($ million)
    • 4.3 Application Segment Analysis 2018 - 2022
      • Exhibit 20: Historic Market Size – Application Segment 2018 - 2022 ($ million)
    • 4.4 Geography Segment Analysis 2018 - 2022
      • Exhibit 21: Historic Market Size – Geography Segment 2018 - 2022 ($ million)
    • 4.5 Country Segment Analysis 2018 - 2022
      • Exhibit 22: Historic Market Size – Country Segment 2018 - 2022 ($ million)

    5 Five Forces Analysis

    • 5.1 Five forces summary
      • Exhibit 23: Five forces analysis - Comparison between 2023 and 2028
    • 5.2 Bargaining power of buyers
      • Exhibit 24: Chart on Bargaining power of buyers – Impact of key factors 2023 and 2028
    • 5.3 Bargaining power of suppliers
      • Exhibit 25: Bargaining power of suppliers – Impact of key factors in 2023 and 2028
    • 5.4 Threat of new entrants
      • Exhibit 26: Threat of new entrants – Impact of key factors in 2023 and 2028
    • 5.5 Threat of substitutes
      • Exhibit 27: Threat of substitutes – Impact of key factors in 2023 and 2028
    • 5.6 Threat of rivalry
      • Exhibit 28: Threat of rivalry – Impact of key factors in 2023 and 2028
    • 5.7 Market condition
      • Exhibit 29: Chart on Market condition - Five forces 2023 and 2028

    6 Market Segmentation by Type

    • 6.1 Market segments
      • Exhibit 30: Chart on Type - Market share 2023-2028 (%)
      • Exhibit 31: Data Table on Type - Market share 2023-2028 (%)
    • 6.2 Comparison by Type
      • Exhibit 32: Chart on Comparison by Type
      • Exhibit 33: Data Table on Comparison by Type
    • 6.3 Smart window - Market size and forecast 2023-2028
      • Exhibit 34: Chart on Smart window - Market size and forecast 2023-2028 ($ million)
      • Exhibit 35: Data Table on Smart window - Market size and forecast 2023-2028 ($ million)
      • Exhibit 36: Chart on Smart window - Year-over-year growth 2023-2028 (%)
      • Exhibit 37: Data Table on Smart window - Year-over-year growth 2023-2028 (%)
    • 6.4 Smart mirror - Market size and forecast 2023-2028
      • Exhibit 38: Chart on Smart mirror - Market size and forecast 2023-2028 ($ million)
      • Exhibit 39: Data Table on Smart mirror - Market size and forecast 2023-2028 ($ million)
      • Exhibit 40: Chart on Smart mirror - Year-over-year growth 2023-2028 (%)
      • Exhibit 41: Data Table on Smart mirror - Year-over-year growth 2023-2028 (%)
    • 6.5 Smart glasses and display - Market size and forecast 2023-2028
      • Exhibit 42: Chart on Smart glasses and display - Market size and forecast 2023-2028 ($ million)
      • Exhibit 43: Data Table on Smart glasses and display - Market size and forecast 2023-2028 ($ million)
      • Exhibit 44: Chart on Smart glasses and display - Year-over-year growth 2023-2028 (%)
      • Exhibit 45: Data Table on Smart glasses and display - Year-over-year growth 2023-2028 (%)
    • 6.6 Market opportunity by Type
      • Exhibit 46: Market opportunity by Type ($ million)
      • Exhibit 47: Data Table on Market opportunity by Type ($ million)

    7 Market Segmentation by Application

    • 7.1 Market segments
      • Exhibit 48: Chart on Application - Market share 2023-2028 (%)
      • Exhibit 49: Data Table on Application - Market share 2023-2028 (%)
    • 7.2 Comparison by Application
      • Exhibit 50: Chart on Comparison by Application
      • Exhibit 51: Data Table on Comparison by Application
    • 7.3 Automotive and transportation - Market size and forecast 2023-2028
      • Exhibit 52: Chart on Automotive and transportation - Market size and forecast 2023-2028 ($ million)
      • Exhibit 53: Data Table on Automotive and transportation - Market size and forecast 2023-2028 ($ million)
      • Exhibit 54: Chart on Automotive and transportation - Year-over-year growth 2023-2028 (%)
      • Exhibit 55: Data Table on Automotive and transportation - Year-over-year growth 2023-2028 (%)
    • 7.4 Building and construction - Market size and forecast 2023-2028
      • Exhibit 56: Chart on Building and construction - Market size and forecast 2023-2028 ($ million)
      • Exhibit 57: Data Table on Building and construction - Market size and forecast 2023-2028 ($ million)
      • Exhibit 58: Chart on Building and construction - Year-over-year growth 2023-2028 (%)
      • Exhibit 59: Data Table on Building and construction - Year-over-year growth 2023-2028 (%)
    • 7.5 Electric and electronic devices and eyewear - Market size and forecast 2023-2028
      • Exhibit 60: Chart on Electric and electronic devices and eyewear - Market size and forecast 2023-2028 ($ million)
      • Exhibit 61: Data Table on Electric and electronic devices and eyewear - Market size and forecast 2023-2028 ($ million)
      • Exhibit 62: Chart on Electric and electronic devices and eyewear - Year-over-year growth 2023-2028 (%)
      • Exhibit 63: Data Table on Electric and electronic devices and eyewear - Year-over-year growth 2023-2028 (%)
    • 7.6 Market opportunity by Application
      • Exhibit 64: Market opportunity by Application ($ million)
      • Exhibit 65: Data Table on Market opportunity by Application ($ million)

    8 Customer Landscape

    • 8.1 Customer landscape overview
      • Exhibit 66: Analysis of price sensitivity, lifecycle, customer purchase basket, adoption rates, and purchase criteria

    9 Geographic Landscape

    • 9.1 Geographic segmentation
      • Exhibit 67: Chart on Market share by geography 2023-2028 (%)
      • Exhibit 68: Data Table on Market share by geography 2023-2028 (%)
    • 9.2 Geographic comparison
      • Exhibit 69: Chart on Geographic comparison
      • Exhibit 70: Data Table on Geographic comparison
    • 9.3 North America - Market size and forecast 2023-2028
      • Exhibit 71: Chart on North America - Market size and forecast 2023-2028 ($ million)
      • Exhibit 72: Data Table on North America - Market size and forecast 2023-2028 ($ million)
      • Exhibit 73: Chart on North America - Year-over-year growth 2023-2028 (%)
      • Exhibit 74: Data Table on North America - Year-over-year growth 2023-2028 (%)
    • 9.4 Europe - Market size and forecast 2023-2028
      • Exhibit 75: Chart on Europe - Market size and forecast 2023-2028 ($ million)
      • Exhibit 76: Data Table on Europe - Market size and forecast 2023-2028 ($ million)
      • Exhibit 77: Chart on Europe - Year-over-year growth 2023-2028 (%)
      • Exhibit 78: Data Table on Europe - Year-over-year growth 2023-2028 (%)
    • 9.5 APAC - Market size and forecast 2023-2028
      • Exhibit 79: Chart on APAC - Market size and forecast 2023-2028 ($ million)
      • Exhibit 80: Data Table on APAC - Market size and forecast 2023-2028 ($ million)
      • Exhibit 81: Chart on APAC - Year-over-year growth 2023-2028 (%)
      • Exhibit 82: Data Table on APAC - Year-over-year growth 2023-2028 (%)
    • 9.6 Middle East and Africa - Market size and forecast 2023-2028
      • Exhibit 83: Chart on Middle East and Africa - Market size and forecast 2023-2028 ($ million)
      • Exhibit 84: Data Table on Middle East and Africa - Market size and forecast 2023-2028 ($ million)
      • Exhibit 85: Chart on Middle East and Africa - Year-over-year growth 2023-2028 (%)
      • Exhibit 86: Data Table on Middle East and Africa - Year-over-year growth 2023-2028 (%)
    • 9.7 South America - Market size and forecast 2023-2028
      • Exhibit 87: Chart on South America - Market size and forecast 2023-2028 ($ million)
      • Exhibit 88: Data Table on South America - Market size and forecast 2023-2028 ($ million)
      • Exhibit 89: Chart on South America - Year-over-year growth 2023-2028 (%)
      • Exhibit 90: Data Table on South America - Year-over-year growth 2023-2028 (%)
    • 9.8 US - Market size and forecast 2023-2028
      • Exhibit 91: Chart on US - Market size and forecast 2023-2028 ($ million)
      • Exhibit 92: Data Table on US - Market size and forecast 2023-2028 ($ million)
      • Exhibit 93: Chart on US - Year-over-year growth 2023-2028 (%)
      • Exhibit 94: Data Table on US - Year-over-year growth 2023-2028 (%)
    • 9.9 China - Market size and forecast 2023-2028
      • Exhibit 95: Chart on China - Market size and forecast 2023-2028 ($ million)
      • Exhibit 96: Data Table on China - Market size and forecast 2023-2028 ($ million)
      • Exhibit 97: Chart on China - Year-over-year growth 2023-2028 (%)
      • Exhibit 98: Data Table on China - Year-over-year growth 2023-2028 (%)
    • 9.10 Germany - Market size and forecast 2023-2028
      • Exhibit 99: Chart on Germany - Market size and forecast 2023-2028 ($ million)
      • Exhibit 100: Data Table on Germany - Market size and forecast 2023-2028 ($ million)
      • Exhibit 101: Chart on Germany - Year-over-year growth 2023-2028 (%)
      • Exhibit 102: Data Table on Germany - Year-over-year growth 2023-2028 (%)
    • 9.11 UK - Market size and forecast 2023-2028
      • Exhibit 103: Chart on UK - Market size and forecast 2023-2028 ($ million)
      • Exhibit 104: Data Table on UK - Market size and forecast 2023-2028 ($ million)
      • Exhibit 105: Chart on UK - Year-over-year growth 2023-2028 (%)
      • Exhibit 106: Data Table on UK - Year-over-year growth 2023-2028 (%)
    • 9.12 Canada - Market size and forecast 2023-2028
      • Exhibit 107: Chart on Canada - Market size and forecast 2023-2028 ($ million)
      • Exhibit 108: Data Table on Canada - Market size and forecast 2023-2028 ($ million)
      • Exhibit 109: Chart on Canada - Year-over-year growth 2023-2028 (%)
      • Exhibit 110: Data Table on Canada - Year-over-year growth 2023-2028 (%)
    • 9.13 Market opportunity by geography
      • Exhibit 111: Market opportunity by geography ($ million)
      • Exhibit 112: Data Tables on Market opportunity by geography ($ million)

    10 Drivers, Challenges, and Trends

    • 10.1 Market drivers
      • 10.2 Market challenges
        • 10.3 Impact of drivers and challenges
          • Exhibit 113: Impact of drivers and challenges in 2023 and 2028
        • 10.4 Market trends

          11 Vendor Landscape

          • 11.1 Overview
            • 11.2 Vendor landscape
              • Exhibit 114: Overview on Criticality of inputs and Factors of differentiation
            • 11.3 Landscape disruption
              • Exhibit 115: Overview on factors of disruption
            • 11.4 Industry risks
              • Exhibit 116: Impact of key risks on business

            12 Vendor Analysis

            • 12.1 Vendors covered
              • Exhibit 117: Vendors covered
            • 12.2 Market positioning of vendors
              • Exhibit 118: Matrix on vendor position and classification
            • 12.3 Apogee Enterprises Inc.
              • Exhibit 119: Apogee Enterprises Inc. - Overview
              • Exhibit 120: Apogee Enterprises Inc. - Business segments
              • Exhibit 121: Apogee Enterprises Inc. - Key offerings
              • Exhibit 122: Apogee Enterprises Inc. - Segment focus
            • 12.4 ChromoGenics AB
              • Exhibit 123: ChromoGenics AB - Overview
              • Exhibit 124: ChromoGenics AB - Product / Service
              • Exhibit 125: ChromoGenics AB - Key offerings
            • 12.5 Compagnie de Saint Gobain
              • Exhibit 126: Compagnie de Saint Gobain - Overview
              • Exhibit 127: Compagnie de Saint Gobain - Business segments
              • Exhibit 128: Compagnie de Saint Gobain - Key news
              • Exhibit 129: Compagnie de Saint Gobain - Key offerings
              • Exhibit 130: Compagnie de Saint Gobain - Segment focus
            • 12.6 Gentex Corp.
              • Exhibit 131: Gentex Corp. - Overview
              • Exhibit 132: Gentex Corp. - Business segments
              • Exhibit 133: Gentex Corp. - Key news
              • Exhibit 134: Gentex Corp. - Key offerings
              • Exhibit 135: Gentex Corp. - Segment focus
            • 12.7 Innovative Glass Corp.
              • Exhibit 136: Innovative Glass Corp. - Overview
              • Exhibit 137: Innovative Glass Corp. - Product / Service
              • Exhibit 138: Innovative Glass Corp. - Key offerings
            • 12.8 Intelligent Glass
              • Exhibit 139: Intelligent Glass - Overview
              • Exhibit 140: Intelligent Glass - Product / Service
              • Exhibit 141: Intelligent Glass - Key offerings
            • 12.9 Plansee SE
              • Exhibit 142: Plansee SE - Overview
              • Exhibit 143: Plansee SE - Product / Service
              • Exhibit 144: Plansee SE - Key offerings
            • 12.10 Polytronix Inc.
              • Exhibit 145: Polytronix Inc. - Overview
              • Exhibit 146: Polytronix Inc. - Product / Service
              • Exhibit 147: Polytronix Inc. - Key offerings
            • 12.11 PPG Industries Inc.
              • Exhibit 148: PPG Industries Inc. - Overview
              • Exhibit 149: PPG Industries Inc. - Business segments
              • Exhibit 150: PPG Industries Inc. - Key news
              • Exhibit 151: PPG Industries Inc. - Key offerings
              • Exhibit 152: PPG Industries Inc. - Segment focus
            • 12.12 Prelonic technologies
              • Exhibit 153: Prelonic technologies - Overview
              • Exhibit 154: Prelonic technologies - Product / Service
              • Exhibit 155: Prelonic technologies - Key offerings
            • 12.13 RavenWindow
              • Exhibit 156: RavenWindow - Overview
              • Exhibit 157: RavenWindow - Product / Service
              • Exhibit 158: RavenWindow - Key offerings
            • 12.14 Smart Films International
              • Exhibit 159: Smart Films International - Overview
              • Exhibit 160: Smart Films International - Product / Service
              • Exhibit 161: Smart Films International - Key offerings
            • 12.15 Smart Glass Technologies, LLC
              • Exhibit 162: Smart Glass Technologies, LLC - Overview
              • Exhibit 163: Smart Glass Technologies, LLC - Product / Service
              • Exhibit 164: Smart Glass Technologies, LLC - Key offerings
            • 12.16 Smart Window Co. Inc.
              • Exhibit 165: Smart Window Co. Inc. - Overview
              • Exhibit 166: Smart Window Co. Inc. - Product / Service
              • Exhibit 167: Smart Window Co. Inc. - Key offerings
            • 12.17 View Inc
              • Exhibit 168: View Inc - Overview
              • Exhibit 169: View Inc - Product / Service
              • Exhibit 170: View Inc - Key offerings

            13 Appendix

            • 13.1 Scope of the report
              • 13.2 Inclusions and exclusions checklist
                • Exhibit 171: Inclusions checklist
                • Exhibit 172: Exclusions checklist
              • 13.3 Currency conversion rates for US$
                • Exhibit 173: Currency conversion rates for US$
              • 13.4 Research methodology
                • Exhibit 174: Research methodology
                • Exhibit 175: Validation techniques employed for market sizing
                • Exhibit 176: Information sources
              • 13.5 List of abbreviations
                • Exhibit 177: List of abbreviations

              Research Methodology

              Technavio presents a detailed picture of the market by way of study, synthesis, and summation of data from multiple sources. The analysts have presented the various facets of the market with a particular focus on identifying the key industry influencers. The data thus presented is comprehensive, reliable, and the result of extensive research, both primary and secondary.

              INFORMATION SOURCES

              Primary sources

              • Manufacturers and suppliers
              • Channel partners
              • Industry experts
              • Strategic decision makers

              Secondary sources

              • Industry journals and periodicals
              • Government data
              • Financial reports of key industry players
              • Historical data
              • Press releases

              DATA ANALYSIS

              Data Synthesis

              • Collation of data
              • Estimation of key figures
              • Analysis of derived insights

              Data Validation

              • Triangulation with data models
              • Reference against proprietary databases
              • Corroboration with industry experts

              REPORT WRITING

              Qualitative

              • Market drivers
              • Market challenges
              • Market trends
              • Five forces analysis

              Quantitative

              • Market size and forecast
              • Market segmentation
              • Geographical insights
              • Competitive landscape

              Interested in this report?

              Get your sample now to see our research methodology and insights!

              Download Now

              Frequently Asked Questions

              Electrochromic Storage Devices market growth will increase by $ 4210.37 mn during 2024-2028.

              The Electrochromic Storage Devices market is expected to grow at a CAGR of 12.93% during 2024-2028.

              Electrochromic Storage Devices market is segmented by Type( Smart window, Smart mirror, Smart glasses and display) Application( Automotive and transportation, Building and construction, Electric and electronic devices and eyewear)

              AGC Inc., Apogee Enterprises Inc., ChromoGenics AB, Compagnie de Saint Gobain, EssilorLuxottica, FlexEnable, Gauzy Ltd., Gentex Corp., Huichi Industrial Development Co. Ltd., Innovative Glass Corp., Intelligent Glass, Plansee SE, Polytronix Inc., PPG Industries Inc., Prelonic technologies, RavenWindow, Research frontiers Inc, Schneider Electric SE, Siemens AG, Smart Films International, SMART GLASS, Smart Glass Technologies, LLC, Smart Window Co. Inc., View Inc, YFY Inc., Zhuhai Shuifa Singyes New Materials Technology Co. Ltd. are a few of the key vendors in the Electrochromic Storage Devices market.

              North America will register the highest growth rate of 33% among the other regions. Therefore, the Electrochromic Storage Devices market in North America is expected to garner significant business opportunities for the vendors during the forecast period.

              US, Canada, China, Germany, UK

              • Increasing demand for energy-efficient solutionsThe increasing demand for energy-efficient solutions is a primary driver fueling the growth of the global electrochromic storage devices market. With sustainability becoming a key priority for consumers is the driving factor this market.
              • businesses is the driving factor this market.
              • and governments alike is the driving factor this market.
              • there is a growing emphasis on adopting technologies that minimize energy consumption and the environmental impact. Electrochromic storage devices is the driving factor this market.
              • such as smart windows and dynamic glass is the driving factor this market.
              • offer a promising solution by allowing users to control the amount of light and heat entering a building is the driving factor this market.
              • thereby reducing the reliance on artificial lighting is the driving factor this market.
              • heating is the driving factor this market.
              • and cooling systems. This not only results in significant energy savings but also contributes to a more comfortable and sustainable indoor environment. Furthermore is the driving factor this market.
              • as energy costs continue to rise and regulations aimed at reducing carbon emissions become more stringent is the driving factor this market.
              • there is a heightened awareness of the importance of energy efficiency in both residential and commercial buildings. Electrochromic storage devices enable building owners and operators to optimize energy consumption by dynamically adjusting tint levels based on external conditions is the driving factor this market.
              • occupancy patterns is the driving factor this market.
              • and user preferences. By harnessing the power of electrochromic technology is the driving factor this market.
              • stakeholders in the construction industry can achieve higher levels of energy efficiency is the driving factor this market.
              • improve building performance is the driving factor this market.
              • and meet their sustainability goals is the driving factor this market.
              • thus driving the adoption of electrochromic storage devices on a global scale. Therefore is the driving factor this market.
              • the increasing demand for energy-efficient solutions will drive the growth of the global electrochromic storage devices market during the forecast period. is the driving factor this market.

              The Electrochromic Storage Devices market vendors should focus on grabbing business opportunities from the Smart window segment as it accounted for the largest market share in the base year.