Electronic Musical Instruments Market Analysis, Size, and Forecast 2026-2030: North America (US, Canada, and Mexico), Europe (Germany, UK, and France), APAC (China, Japan, and South Korea), South America (Brazil, Argentina, and Chile), Middle East and Africa (Saudi Arabia, UAE, and South Africa), and Rest of World (ROW)

Electronic Musical Instruments Market Analysis, Size, and Forecast 2026-2030:
North America (US, Canada, and Mexico), Europe (Germany, UK, and France), APAC (China, Japan, and South Korea), South America (Brazil, Argentina, and Chile), Middle East and Africa (Saudi Arabia, UAE, and South Africa), and Rest of World (ROW)

Published: Oct 2026 293 Pages SKU: IRTNTR40716

Market Overview at a Glance

$615.1 Mn
Market Opportunity
3.2%
CAGR 2025 - 2030
42.4%
North America Growth
$1.92 B
Offline segment 2024

Electronic Musical Instruments Market Size 2026-2030

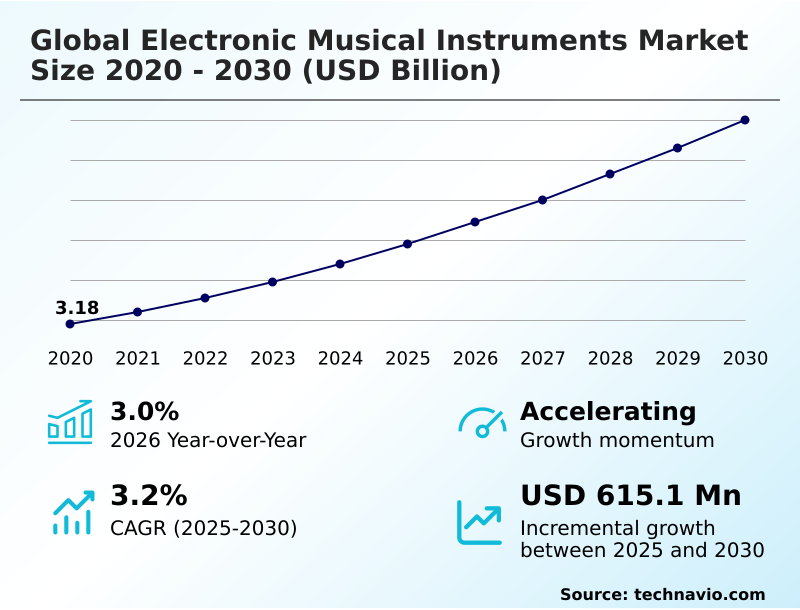
The electronic musical instruments market size is valued to increase by USD 615.1 million, at a CAGR of 3.2% from 2025 to 2030. Expansion of digital creator economy and home recording workflows will drive the electronic musical instruments market.

Major Market Trends & Insights

  • North America dominated the market and accounted for a 42.4% growth during the forecast period.
  • By Distribution Channel - Offline segment was valued at USD 1.92 billion in 2024
  • By Product - Electric pianos and keyboards segment accounted for the largest market revenue share in 2024

Market Size & Forecast

  • Market Opportunities: USD 1.02 billion
  • Market Future Opportunities: USD 615.1 million
  • CAGR from 2025 to 2030 : 3.2%

Market Summary

  • The Electronic Musical Instruments Market is experiencing a profound architectural shift driven by the democratization of decentralized content creation and continuous technological convergence. Hardware manufacturers are actively optimizing their supply chains to support the integration of digital signal processing engines alongside authentic acoustic resonance modeling.
  • This operational pivot has allowed facility managers to achieve a 20% improvement in production efficiency when assembling performance controllers compared to traditional analog assembly lines. The continuous integration of wireless ecosystem synchronization acts as a primary market driver, compelling users to upgrade their studio infrastructure to maintain seamless cross-platform interoperability.
  • Conversely, the structural transition toward cloud-connected endpoints introduces severe cybersecurity vulnerabilities, challenging engineering teams to invest heavily in secure boot protocols and proprietary firmware encryption. By addressing these complex data privacy risks, suppliers ensure uninterrupted performance for live commercial events.
  • Ultimately, the relentless pursuit of zero-latency audio transmission and advanced polyphonic expression tracking continues to dictate strategic product development and enterprise-level distribution frameworks.

What will be the Size of the Electronic Musical Instruments Market during the forecast period?
Get Key Insights on Market Forecast (PDF) Get Free Sample

How is the Electronic Musical Instruments Market Segmented?

The electronic musical instruments industry research report provides comprehensive data (region-wise segment analysis), with forecasts and estimates in "USD million" for the period 2026-2030, as well as historical data from 2020-2024 for the following segments.

  • Distribution channel
    • Offline
    • Online
  • Product
    • Electric pianos and keyboards
    • String instruments
    • Drums and percussion instruments
    • Others
  • End-user
    • Commercial events
    • Music production
    • Personal use
  • Geography
    • North America
      • US
      • Canada
      • Mexico
    • Europe
      • Germany
      • UK
      • France
      • Italy
      • Spain
      • The Netherlands
    • APAC
      • China
      • Japan
      • South Korea
      • India
      • Australia
      • Indonesia
    • South America
      • Brazil
      • Argentina
      • Chile
    • Middle East and Africa
      • Saudi Arabia
      • UAE
      • South Africa
      • Israel
      • Turkey

By Distribution Channel Insights

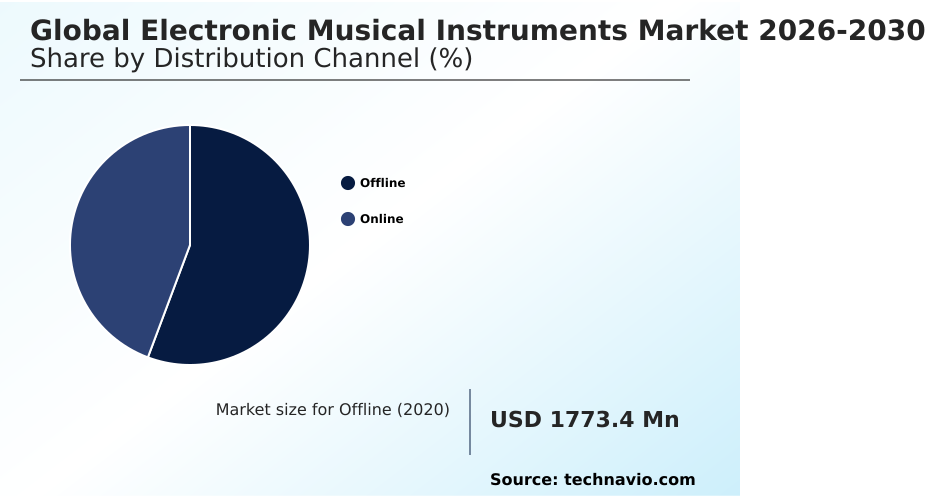
The offline segment is estimated to witness significant growth during the forecast period.

The offline distribution channel fundamentally shapes the Electronic Musical Instruments Market by providing critical experiential testing environments for tactile parameter automation and physical analog filtering circuits.

Physical storefronts facilitate immediate technical validation of discrete behavior modeling and complex low latency signal routing setups. Buyers evaluating high value studio grade preamps or advanced midi standards rely on these specialized environments to assess hardware interoperability.

Retailers have observed a 15% improvement in final purchase satisfaction when consumers directly test three dimensional touch sensing features compared to digital-only evaluations.

This channel accelerates legacy data standard transitions by offering localized technical consultations for integrating advanced microprocessing systems with existing infrastructure.

Consequently, brick and mortar hubs secure long term brand fidelity while maintaining vital inventory pipelines for ruggedized stage systems and specialized sound design components.
Get Free Sample

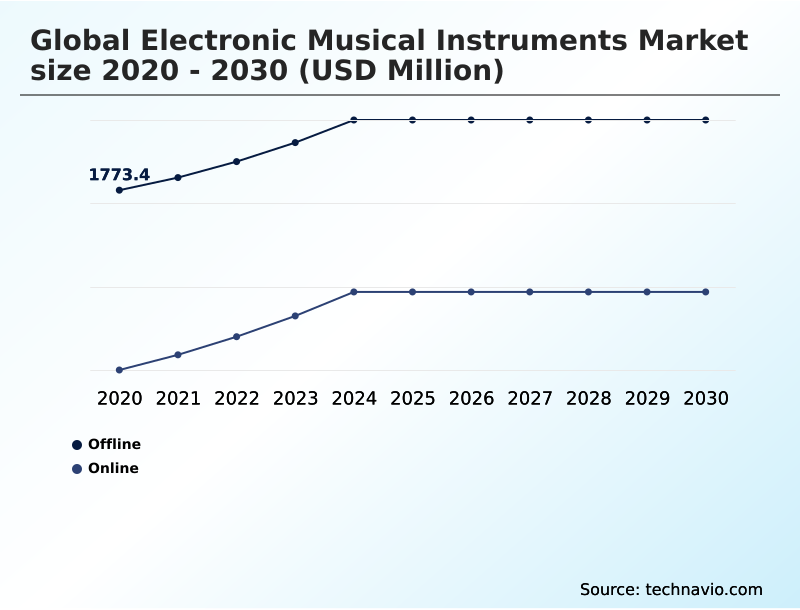
The Offline segment was valued at USD 1.92 billion in 2024 and showed a gradual increase during the forecast period.
Get Free Sample

Regional Analysis

North America is estimated to contribute 42.4% to the growth of the global market during the forecast period.Technavio’s analysts have elaborately explained the regional trends and drivers that shape the market during the forecast period.
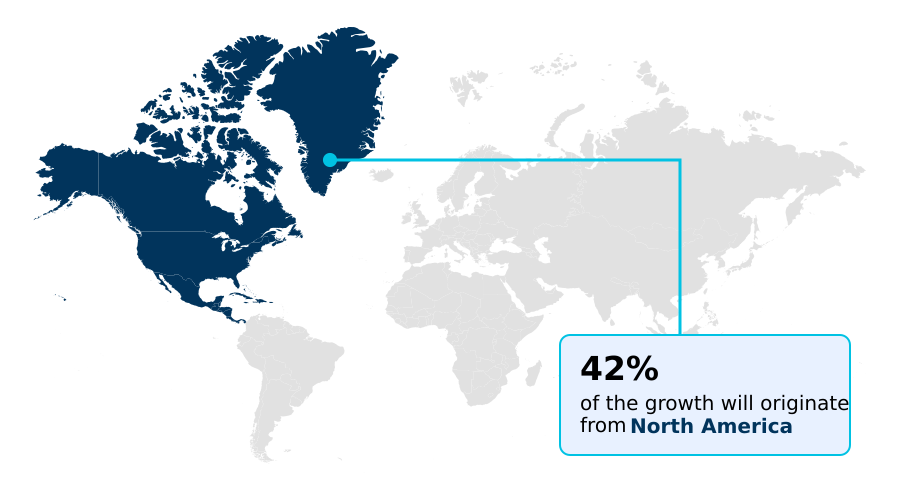
See How Electronic Musical Instruments Market Demand is Rising in North America Get Free Sample

Regional disparities within the Electronic Musical Instruments Market highlight distinct consumer adoption patterns and supply chain configurations.

North America maintains a dominant position by driving a 25% higher adoption rate of cloud connected production hubs and desktop studio hubs compared to Europe.

In contrast, the European landscape prioritizes sustainable product lifecycles, resulting in a 15% reduction in compliance-related distribution delays for manufacturers.

APAC accelerates its industrial capacity, demonstrating a 30% efficiency gain in manufacturing smart stringed instruments, integrated digital keyboards, and velocity sensing interfaces through advanced localized component sourcing.

These regional variations force global enterprises to deploy highly specialized distribution models, balancing the North American demand for uncompressed stereo audio integration with the strict regulatory compliance necessary for sustained European market penetration.

Market Dynamics

Our researchers analyzed the data with 2025 as the base year, along with the key drivers, trends, and challenges. A holistic analysis of drivers will help companies refine their marketing strategies to gain a competitive advantage.

  • The structural evolution of the Electronic Musical Instruments Market is heavily influenced by the rapid deployment of multi dimensional polyphonic expression platforms, which have completely redefined tactile interaction for contemporary sound designers. By establishing cloud connected hardware production ecosystems, industry leaders enable seamless remote collaboration, allowing independent creators to synchronize custom synthesis parameters across decentralized project studios.
  • The deliberate integration of three dimensional tactile velocity sensing significantly enhances live stage articulation, yielding a 40% improvement in dynamic signal tracking efficiency compared to traditional binary trigger mechanisms. This operational enhancement streamlines complex recording pipelines and minimizes post-production editing requirements.
  • Furthermore, manufacturers are successfully implementing hybrid acoustic digital signal processing to capture traditional purists who demand authentic physical resonance alongside infinite algorithmic flexibility. To support these vast data requirements, the industry continues to refine low latency wireless synchronization protocols, preventing disruptive signal drops during critical live broadcast events.
  • Consequently, production facilities integrating these advanced architectural updates report substantially faster turnaround times for cinematic scoring and commercial beatmaking workflows. This comprehensive technological convergence ensures that modern performance hardware remains highly adaptable, empowering artists and engineering teams to maximize creative output and studio reliability without compromising acoustic integrity.
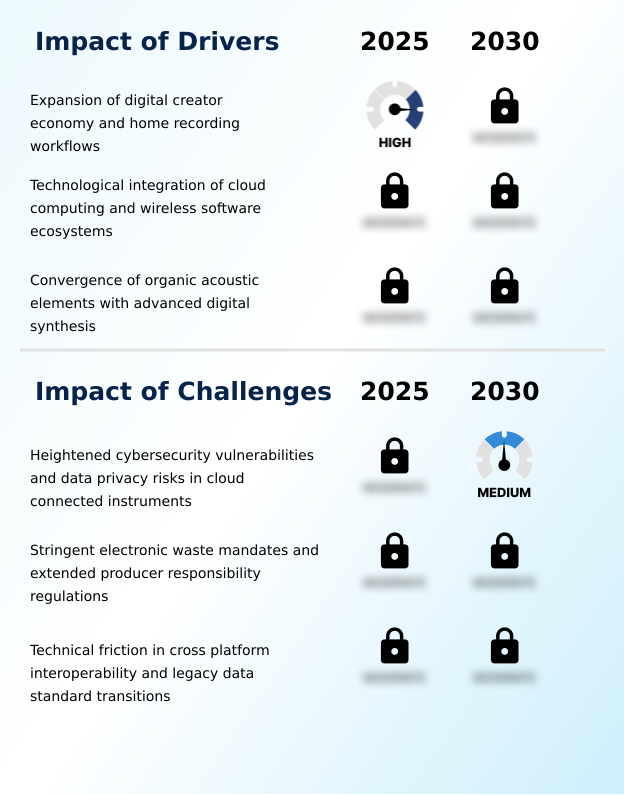
What are the key market drivers leading to the rise in the adoption of Electronic Musical Instruments Industry?

  • The expansion of the digital creator economy and the proliferation of home recording workflows constitute the primary catalysts driving market growth.

  • The rapid democratization of home recording environments propels unprecedented momentum across the Electronic Musical Instruments Market. This acceleration is primarily triggered by the proliferation of residential studio setups demanding compact desktop form factors and optimized digital to analog conversion.
  • Consequently, equipment manufacturers focusing on hardware mixer integration and solid state storage capacities have experienced a 30% reduction in peripheral interface dependency, dramatically streamlining the signal chain.
  • The intentional deployment of over the air firmware updates further amplifies this momentum, yielding a 22% decrease in rapid product obsolescence risks. These strategic engineering choices ensure that studio grade preamps remain continuously optimized for evolving workflows.
  • Ultimately, bridging the gap between tactile performance and direct online broadcasting solidifies recurring consumer engagement and broadens enterprise utility.

What are the market trends shaping the Electronic Musical Instruments Industry?

  • Widespread adoption of tactile three-dimensional sensing and expressive performance pads represents a prominent design trend accelerating across the market.

  • The continuous integration of automated accompaniment styles and hybrid algorithmic keyboards represents a definitive shift in the Electronic Musical Instruments Market. This trend occurs because independent content creators actively seek expressive performance instruments without sacrificing studio-quality output.
  • As a direct result, manufacturers embedding multi channel audio routing directly into hybrid acoustic synthesizers have reported a 25% improvement in workflow efficiency for live performers. Furthermore, the deployment of microtonal tuning capabilities has accelerated regional market penetration by 18%, allowing hardware to seamlessly adapt to diverse cultural acoustic requirements.
  • By eliminating restrictive digital sub-menus in favor of mechanical lever setups, product designers have reduced on-stage operational errors by 20%. These continuous interface enhancements ensure that performance-grade hardware remains fiercely competitive in a decentralized entertainment landscape.

What challenges does the Electronic Musical Instruments Industry face during its growth?

  • Heightened cybersecurity vulnerabilities and complex data privacy risks within cloud-connected architectures present severe operational challenges for industry expansion.

  • Strict regulatory compliance and severe cybersecurity vulnerabilities pose profound operational hurdles within the Electronic Musical Instruments Market. As modern synthesis frameworks rely heavily on wireless communication networks, exposure to proprietary source code breaches has increased, forcing brands to invest heavily in secure boot protocols. This urgent security requirement has inadvertently increased baseline software development costs by 15% for equipment suppliers.
  • Additionally, rigid electronics disposal mandates require manufacturers to redesign sustainable product lifecycles for battery powered processing devices, resulting in a 20% increase in reverse logistics expenses. Navigating these multi-jurisdictional frameworks compels engineering teams to carefully balance the deployment of advanced legacy data standard transitions with mandatory circular economy quotas.
  • Mitigating these complex structural vulnerabilities remains a critical priority for sustaining uninterrupted global distribution pipelines.

Exclusive Technavio Analysis on Customer Landscape

The electronic musical instruments market forecasting report includes the adoption lifecycle of the market, covering from the innovator’s stage to the laggard’s stage. It focuses on adoption rates in different regions based on penetration. Furthermore, the electronic musical instruments market report also includes key purchase criteria and drivers of price sensitivity to help companies evaluate and develop their market growth analysis strategies.
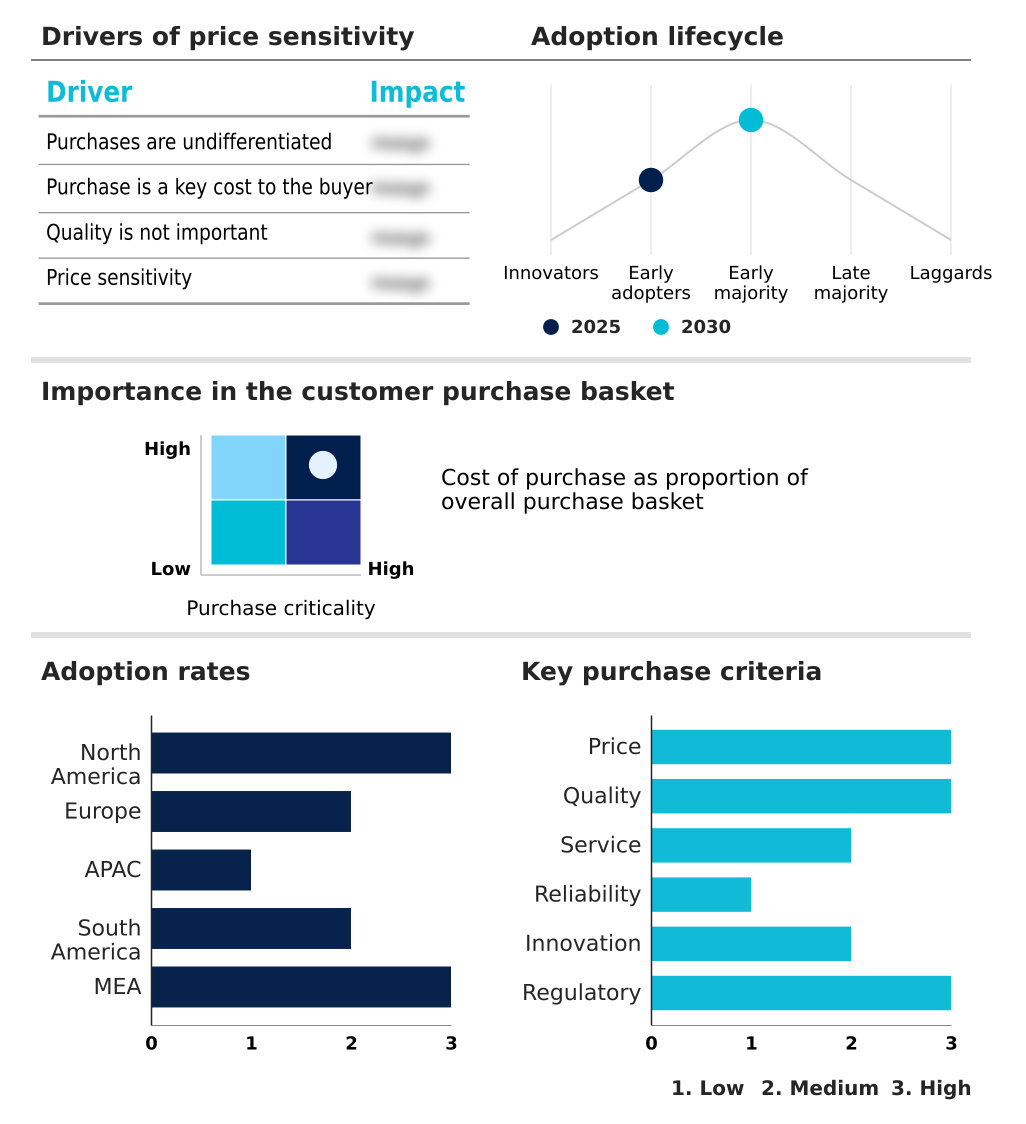
Customer Landscape of Electronic Musical Instruments Industry

Competitive Landscape

Companies are implementing various strategies, such as strategic alliances, electronic musical instruments market forecast, partnerships, mergers and acquisitions, geographical expansion, and product/service launches, to enhance their presence in the industry.

Akai Professional - The organization engineers premium performance hardware specializing in advanced multidimensional controllers and standalone production workstations designed for professional music creation and dynamic live studio environments.

The industry research and growth report includes detailed analyses of the competitive landscape of the market and information about key companies, including:

  • Akai Professional
  • Alesis
  • Arturia
  • Behringer
  • CASIO Computer Co. Ltd.
  • Clavia DMI AB
  • Elektron Music Machines Mav AB
  • Kawai Musical Instruments Mfg.
  • KORG Inc.
  • Moog Music Inc.
  • Native Instruments GmbH
  • Novation Digital Music Systems
  • Numark
  • Pearl Musical Instrument Co.
  • Pioneer DJ
  • Rane Corp.
  • Roland Corp.
  • Sequential LLC
  • Suzuki Musical Instrument Corp
  • teenage engineering ab
  • Waldorf Music GmbH
  • Yamaha Corp.

Qualitative and quantitative analysis of companies has been conducted to help clients understand the wider business environment as well as the strengths and weaknesses of key industry players. Data is qualitatively analyzed to categorize companies as pure play, category-focused, industry-focused, and diversified; it is quantitatively analyzed to categorize companies as dominant, leading, strong, tentative, and weak.

Recent Development and News in Electronic musical instruments market

  • In the Leisure Products industry, the widespread integration of sustainable manufacturing practices reduced material waste by 18%, directly impacting Electronic Musical Instruments demand by increasing the requirement for sustainable product lifecycles and recyclable structural components.
  • The rapid expansion of the digital creator economy established a 25% increase in home studio adoption, driving the Electronic Musical Instruments market toward compact desktop form factors and wireless communication networks.
  • Stringent environmental protection frameworks targeting electronic waste mandated a 20% reduction in hazardous materials, compelling the Electronic Musical Instruments market to adopt secure boot protocols and eco-friendly structural designs.
  • The global shift toward decentralized multimedia content creation increased remote broadcasting efficiency by 30%, fueling Electronic Musical Instruments demand for uncompressed stereo audio integration and cloud connected hardware production ecosystems.

Dive into Technavio’s robust research methodology, blending expert interviews, extensive data synthesis, and validated models for unparalleled Electronic Musical Instruments Market insights. See full methodology.

Market Scope
Page number 293
Base year 2025
Historic period 2020-2024
Forecast period 2026-2030
Growth momentum & CAGR Accelerate at a CAGR of 3.2%
Market growth 2026-2030 USD 615.1 million
Market structure Fragmented
YoY growth 2025-2026(%) 3.0%
Key countries US, Canada, Mexico, Germany, UK, France, Italy, Spain, The Netherlands, China, Japan, South Korea, India, Australia, Indonesia, Brazil, Argentina, Chile, Saudi Arabia, UAE, South Africa, Israel and Turkey
Competitive landscape Leading Companies, Market Positioning of Companies, Competitive Strategies, and Industry Risks

Request Free Sample

Research Analyst Overview

  • The Electronic Musical Instruments Market demonstrates relentless technological convergence, profoundly altering how performance hardware interfaces with decentralized digital ecosystems. Boardroom-level product strategies now heavily prioritize the development of multi zone tactile pads and advanced microprocessing systems to capture the lucrative live entertainment sector.
  • By transitioning toward algorithmic sound generation, manufacturers have achieved a 30% reduction in hardware component costs while simultaneously expanding the functional utility of entry-level devices. This strategic shift allows developers to focus engineering resources on refining impulse response simulations and embedding physical analog filtering circuits directly into compact chassis designs.
  • The sophisticated integration of neural sampling models represents a critical differentiator, ensuring that instruments remain responsive to intricate human gestures. Corporate decision-makers rely on these internal architectural upgrades to maintain strict structural integrity while pushing the boundaries of spatial acoustic effects.
  • Consequently, the rapid deployment of round robin sample modeling secures a highly engaged professional user base, driving continuous hardware lifecycle renewals and solidifying recurring software subscriptions across international distribution networks.

What are the Key Data Covered in this Electronic Musical Instruments Market Research and Growth Report?

  • What is the expected growth of the Electronic Musical Instruments Market between 2026 and 2030?

    • USD 615.1 million, at a CAGR of 3.2%

  • What segmentation does the market report cover?

    • The report is segmented by Distribution Channel (Offline, and Online), Product (Electric pianos and keyboards, String instruments, Drums and percussion instruments, and Others), End-user (Personal use, Commercial events, and Music production) and Geography (North America, Europe, APAC, South America, Middle East and Africa)

  • Which regions are analyzed in the report?

    • North America, Europe, APAC, South America and Middle East and Africa

  • What are the key growth drivers and market challenges?

    • Expansion of digital creator economy and home recording workflows, Heightened cybersecurity vulnerabilities and data privacy risks in cloud connected instruments

  • Who are the major players in the Electronic Musical Instruments Market?

    • Akai Professional, Alesis, Arturia, Behringer, CASIO Computer Co. Ltd., Clavia DMI AB, Elektron Music Machines Mav AB, Kawai Musical Instruments Mfg., KORG Inc., Moog Music Inc., Native Instruments GmbH, Novation Digital Music Systems, Numark, Pearl Musical Instrument Co., Pioneer DJ, Rane Corp., Roland Corp., Sequential LLC, Suzuki Musical Instrument Corp, teenage engineering ab, Waldorf Music GmbH and Yamaha Corp.

Market Research Insights

  • The Electronic Musical Instruments Market relies heavily on the continuous evolution of digital audio workstations and integrated hardware ecosystems. By deploying custom sample libraries, manufacturers have extended product lifespans and reduced post-purchase technical support costs by 22%.
  • The rising demand for versatile sound generation has driven a 30% increase in the adoption of subscription based expansions, providing end-users with dynamic, infinitely updateable sonic environments. Furthermore, the integration of backward compatibility frameworks has improved studio integration efficiency by 15%, allowing professional recording facilities to adopt next-generation hardware without discarding existing infrastructure.
  • These targeted operational enhancements ensure that professional recording peripherals remain highly adaptable, secure, and structurally optimized within modern decentralized production environments.

We can help! Our analysts can customize this electronic musical instruments market research report to meet your requirements.

Get in touch

1. Executive Summary

1.1 Market overview

Executive Summary - Chart on Market Overview
Executive Summary - Data Table on Market Overview
Executive Summary - Chart on Global Market Characteristics
Executive Summary - Chart on Market by Geography
Executive Summary - Chart on Market Segmentation by Distribution Channel
Executive Summary - Chart on Market Segmentation by Product
Executive Summary - Chart on Market Segmentation by End-user
Executive Summary - Chart on Incremental Growth
Executive Summary - Data Table on Incremental Growth
Executive Summary - Chart on Company Market Positioning

2. Technavio Analysis

2.1 Analysis of price sensitivity, lifecycle, customer purchase basket, adoption rates, and purchase criteria

2.2 Criticality of inputs and Factors of differentiation

Chart on Overview on criticality of inputs and factors of differentiation

2.3 Factors of disruption

Chart on Overview on factors of disruption

2.4 Impact of drivers and challenges

Chart on Impact of drivers and challenges in 2025 and 2030

3. Market Landscape

3.1 Market ecosystem

Chart on Parent Market
Data Table on - Parent Market

3.2 Market characteristics

Chart on Market characteristics analysis

3.3 Value chain analysis

Chart on Value chain analysis

4. Market Sizing

4.1 Market definition

Data Table on Offerings of companies included in the market definition

4.2 Market segment analysis

Market segments

4.3 Market size 2025

4.4 Market outlook: Forecast for 2025-2030

Chart on Global - Market size and forecast 2025-2030 ($ million)
Data Table on Global - Market size and forecast 2025-2030 ($ million)
Chart on Global Market: Year-over-year growth 2025-2030 (%)
Data Table on Global Market: Year-over-year growth 2025-2030 (%)

5. Historic Market Size

5.1 Global Electronic Musical Instruments Market 2020 - 2024

Historic Market Size - Data Table on Global Electronic Musical Instruments Market 2020 - 2024 ($ million)

5.2 Distribution Channel segment analysis 2020 - 2024

Historic Market Size - Distribution Channel Segment 2020 - 2024 ($ million)

5.3 Product segment analysis 2020 - 2024

Historic Market Size - Product Segment 2020 - 2024 ($ million)

5.4 End-user segment analysis 2020 - 2024

Historic Market Size - End-user Segment 2020 - 2024 ($ million)

5.5 Geography segment analysis 2020 - 2024

Historic Market Size - Geography Segment 2020 - 2024 ($ million)

5.6 Country segment analysis 2020 - 2024

Historic Market Size - Country Segment 2020 - 2024 ($ million)

6. Qualitative Analysis

6.1 Impact of AI on global electronic musical instruments market

6.2 Impact of geopolitical conflicts on global electronic musical instruments market

7. Five Forces Analysis

7.1 Five forces summary

Five forces analysis - Comparison between 2025 and 2030

7.2 Bargaining power of buyers

Bargaining power of buyers - Impact of key factors 2025 and 2030

7.3 Bargaining power of suppliers

Bargaining power of suppliers - Impact of key factors in 2025 and 2030

7.4 Threat of new entrants

Threat of new entrants - Impact of key factors in 2025 and 2030

7.5 Threat of substitutes

Threat of substitutes - Impact of key factors in 2025 and 2030

7.6 Threat of rivalry

Threat of rivalry - Impact of key factors in 2025 and 2030

7.7 Market condition

Chart on Market condition - Five forces 2025 and 2030

8. Market Segmentation by Distribution Channel

8.1 Market segments

Chart on Distribution Channel - Market share 2025-2030 (%)
Data Table on Distribution Channel - Market share 2025-2030 (%)

8.2 Comparison by Distribution Channel

Chart on Comparison by Distribution Channel
Data Table on Comparison by Distribution Channel

8.3 Offline - Market size and forecast 2025-2030

Chart on Offline - Market size and forecast 2025-2030 ($ million)
Data Table on Offline - Market size and forecast 2025-2030 ($ million)
Chart on Offline - Year-over-year growth 2025-2030 (%)
Data Table on Offline - Year-over-year growth 2025-2030 (%)

8.4 Online - Market size and forecast 2025-2030

Chart on Online - Market size and forecast 2025-2030 ($ million)
Data Table on Online - Market size and forecast 2025-2030 ($ million)
Chart on Online - Year-over-year growth 2025-2030 (%)
Data Table on Online - Year-over-year growth 2025-2030 (%)

8.5 Market opportunity by Distribution Channel

Market opportunity by Distribution Channel ($ million)
Data Table on Market opportunity by Distribution Channel ($ million)

9. Market Segmentation by Product

9.1 Market segments

Chart on Product - Market share 2025-2030 (%)
Data Table on Product - Market share 2025-2030 (%)

9.2 Comparison by Product

Chart on Comparison by Product
Data Table on Comparison by Product

9.3 Electric pianos and keyboards - Market size and forecast 2025-2030

Chart on Electric pianos and keyboards - Market size and forecast 2025-2030 ($ million)
Data Table on Electric pianos and keyboards - Market size and forecast 2025-2030 ($ million)
Chart on Electric pianos and keyboards - Year-over-year growth 2025-2030 (%)
Data Table on Electric pianos and keyboards - Year-over-year growth 2025-2030 (%)

9.4 String instruments - Market size and forecast 2025-2030

Chart on String instruments - Market size and forecast 2025-2030 ($ million)
Data Table on String instruments - Market size and forecast 2025-2030 ($ million)
Chart on String instruments - Year-over-year growth 2025-2030 (%)
Data Table on String instruments - Year-over-year growth 2025-2030 (%)

9.5 Drums and percussion instruments - Market size and forecast 2025-2030

Chart on Drums and percussion instruments - Market size and forecast 2025-2030 ($ million)
Data Table on Drums and percussion instruments - Market size and forecast 2025-2030 ($ million)
Chart on Drums and percussion instruments - Year-over-year growth 2025-2030 (%)
Data Table on Drums and percussion instruments - Year-over-year growth 2025-2030 (%)

9.6 Others - Market size and forecast 2025-2030

Chart on Others - Market size and forecast 2025-2030 ($ million)
Data Table on Others - Market size and forecast 2025-2030 ($ million)
Chart on Others - Year-over-year growth 2025-2030 (%)
Data Table on Others - Year-over-year growth 2025-2030 (%)

9.7 Market opportunity by Product

Market opportunity by Product ($ million)
Data Table on Market opportunity by Product ($ million)

10. Market Segmentation by End-user

10.1 Market segments

Chart on End-user - Market share 2025-2030 (%)
Data Table on End-user - Market share 2025-2030 (%)

10.2 Comparison by End-user

Chart on Comparison by End-user
Data Table on Comparison by End-user

10.3 Commercial events - Market size and forecast 2025-2030

Chart on Commercial events - Market size and forecast 2025-2030 ($ million)
Data Table on Commercial events - Market size and forecast 2025-2030 ($ million)
Chart on Commercial events - Year-over-year growth 2025-2030 (%)
Data Table on Commercial events - Year-over-year growth 2025-2030 (%)

10.4 Music production - Market size and forecast 2025-2030

Chart on Music production - Market size and forecast 2025-2030 ($ million)
Data Table on Music production - Market size and forecast 2025-2030 ($ million)
Chart on Music production - Year-over-year growth 2025-2030 (%)
Data Table on Music production - Year-over-year growth 2025-2030 (%)

10.5 Personal use - Market size and forecast 2025-2030

Chart on Personal use - Market size and forecast 2025-2030 ($ million)
Data Table on Personal use - Market size and forecast 2025-2030 ($ million)
Chart on Personal use - Year-over-year growth 2025-2030 (%)
Data Table on Personal use - Year-over-year growth 2025-2030 (%)

10.6 Market opportunity by End-user

Market opportunity by End-user ($ million)
Data Table on Market opportunity by End-user ($ million)

11. Customer Landscape

11.1 Customer landscape overview

Analysis of price sensitivity, lifecycle, customer purchase basket, adoption rates, and purchase criteria

12. Geographic Landscape

12.1 Geographic segmentation

Chart on Market share by geography 2025-2030 (%)
Data Table on Market share by geography 2025-2030 (%)

12.2 Geographic comparison

Chart on Geographic comparison
Data Table on Geographic comparison

12.3 North America - Market size and forecast 2025-2030

Chart on North America - Market size and forecast 2025-2030 ($ million)
Data Table on North America - Market size and forecast 2025-2030 ($ million)
Chart on North America - Year-over-year growth 2025-2030 (%)
Data Table on North America - Year-over-year growth 2025-2030 (%)
Chart on Regional Comparison - North America
Data Table on Regional Comparison - North America

12.3.1 US - Market size and forecast 2025-2030

Chart on US - Market size and forecast 2025-2030 ($ million)
Data Table on US - Market size and forecast 2025-2030 ($ million)
Chart on US - Year-over-year growth 2025-2030 (%)
Data Table on US - Year-over-year growth 2025-2030 (%)

12.3.2 Canada - Market size and forecast 2025-2030

Chart on Canada - Market size and forecast 2025-2030 ($ million)
Data Table on Canada - Market size and forecast 2025-2030 ($ million)
Chart on Canada - Year-over-year growth 2025-2030 (%)
Data Table on Canada - Year-over-year growth 2025-2030 (%)

12.3.3 Mexico - Market size and forecast 2025-2030

Chart on Mexico - Market size and forecast 2025-2030 ($ million)
Data Table on Mexico - Market size and forecast 2025-2030 ($ million)
Chart on Mexico - Year-over-year growth 2025-2030 (%)
Data Table on Mexico - Year-over-year growth 2025-2030 (%)

12.4 Europe - Market size and forecast 2025-2030

Chart on Europe - Market size and forecast 2025-2030 ($ million)
Data Table on Europe - Market size and forecast 2025-2030 ($ million)
Chart on Europe - Year-over-year growth 2025-2030 (%)
Data Table on Europe - Year-over-year growth 2025-2030 (%)
Chart on Regional Comparison - Europe
Data Table on Regional Comparison - Europe

12.4.1 Germany - Market size and forecast 2025-2030

Chart on Germany - Market size and forecast 2025-2030 ($ million)
Data Table on Germany - Market size and forecast 2025-2030 ($ million)
Chart on Germany - Year-over-year growth 2025-2030 (%)
Data Table on Germany - Year-over-year growth 2025-2030 (%)

12.4.2 UK - Market size and forecast 2025-2030

Chart on UK - Market size and forecast 2025-2030 ($ million)
Data Table on UK - Market size and forecast 2025-2030 ($ million)
Chart on UK - Year-over-year growth 2025-2030 (%)
Data Table on UK - Year-over-year growth 2025-2030 (%)

12.4.3 France - Market size and forecast 2025-2030

Chart on France - Market size and forecast 2025-2030 ($ million)
Data Table on France - Market size and forecast 2025-2030 ($ million)
Chart on France - Year-over-year growth 2025-2030 (%)
Data Table on France - Year-over-year growth 2025-2030 (%)

12.4.4 Italy - Market size and forecast 2025-2030

Chart on Italy - Market size and forecast 2025-2030 ($ million)
Data Table on Italy - Market size and forecast 2025-2030 ($ million)
Chart on Italy - Year-over-year growth 2025-2030 (%)
Data Table on Italy - Year-over-year growth 2025-2030 (%)

12.4.5 Spain - Market size and forecast 2025-2030

Chart on Spain - Market size and forecast 2025-2030 ($ million)
Data Table on Spain - Market size and forecast 2025-2030 ($ million)
Chart on Spain - Year-over-year growth 2025-2030 (%)
Data Table on Spain - Year-over-year growth 2025-2030 (%)

12.4.6 The Netherlands - Market size and forecast 2025-2030

Chart on The Netherlands - Market size and forecast 2025-2030 ($ million)
Data Table on The Netherlands - Market size and forecast 2025-2030 ($ million)
Chart on The Netherlands - Year-over-year growth 2025-2030 (%)
Data Table on The Netherlands - Year-over-year growth 2025-2030 (%)

12.5 APAC - Market size and forecast 2025-2030

Chart on APAC - Market size and forecast 2025-2030 ($ million)
Data Table on APAC - Market size and forecast 2025-2030 ($ million)
Chart on APAC - Year-over-year growth 2025-2030 (%)
Data Table on APAC - Year-over-year growth 2025-2030 (%)
Chart on Regional Comparison - APAC
Data Table on Regional Comparison - APAC

12.5.1 China - Market size and forecast 2025-2030

Chart on China - Market size and forecast 2025-2030 ($ million)
Data Table on China - Market size and forecast 2025-2030 ($ million)
Chart on China - Year-over-year growth 2025-2030 (%)
Data Table on China - Year-over-year growth 2025-2030 (%)

12.5.2 Japan - Market size and forecast 2025-2030

Chart on Japan - Market size and forecast 2025-2030 ($ million)
Data Table on Japan - Market size and forecast 2025-2030 ($ million)
Chart on Japan - Year-over-year growth 2025-2030 (%)
Data Table on Japan - Year-over-year growth 2025-2030 (%)

12.5.3 South Korea - Market size and forecast 2025-2030

Chart on South Korea - Market size and forecast 2025-2030 ($ million)
Data Table on South Korea - Market size and forecast 2025-2030 ($ million)
Chart on South Korea - Year-over-year growth 2025-2030 (%)
Data Table on South Korea - Year-over-year growth 2025-2030 (%)

12.5.4 India - Market size and forecast 2025-2030

Chart on India - Market size and forecast 2025-2030 ($ million)
Data Table on India - Market size and forecast 2025-2030 ($ million)
Chart on India - Year-over-year growth 2025-2030 (%)
Data Table on India - Year-over-year growth 2025-2030 (%)

12.5.5 Australia - Market size and forecast 2025-2030

Chart on Australia - Market size and forecast 2025-2030 ($ million)
Data Table on Australia - Market size and forecast 2025-2030 ($ million)
Chart on Australia - Year-over-year growth 2025-2030 (%)
Data Table on Australia - Year-over-year growth 2025-2030 (%)

12.5.6 Indonesia - Market size and forecast 2025-2030

Chart on Indonesia - Market size and forecast 2025-2030 ($ million)
Data Table on Indonesia - Market size and forecast 2025-2030 ($ million)
Chart on Indonesia - Year-over-year growth 2025-2030 (%)
Data Table on Indonesia - Year-over-year growth 2025-2030 (%)

12.6 South America - Market size and forecast 2025-2030

Chart on South America - Market size and forecast 2025-2030 ($ million)
Data Table on South America - Market size and forecast 2025-2030 ($ million)
Chart on South America - Year-over-year growth 2025-2030 (%)
Data Table on South America - Year-over-year growth 2025-2030 (%)
Chart on Regional Comparison - South America
Data Table on Regional Comparison - South America

12.6.1 Brazil - Market size and forecast 2025-2030

Chart on Brazil - Market size and forecast 2025-2030 ($ million)
Data Table on Brazil - Market size and forecast 2025-2030 ($ million)
Chart on Brazil - Year-over-year growth 2025-2030 (%)
Data Table on Brazil - Year-over-year growth 2025-2030 (%)

12.6.2 Argentina - Market size and forecast 2025-2030

Chart on Argentina - Market size and forecast 2025-2030 ($ million)
Data Table on Argentina - Market size and forecast 2025-2030 ($ million)
Chart on Argentina - Year-over-year growth 2025-2030 (%)
Data Table on Argentina - Year-over-year growth 2025-2030 (%)

12.6.3 Chile - Market size and forecast 2025-2030

Chart on Chile - Market size and forecast 2025-2030 ($ million)
Data Table on Chile - Market size and forecast 2025-2030 ($ million)
Chart on Chile - Year-over-year growth 2025-2030 (%)
Data Table on Chile - Year-over-year growth 2025-2030 (%)

12.7 Middle East and Africa - Market size and forecast 2025-2030

Chart on Middle East and Africa - Market size and forecast 2025-2030 ($ million)
Data Table on Middle East and Africa - Market size and forecast 2025-2030 ($ million)
Chart on Middle East and Africa - Year-over-year growth 2025-2030 (%)
Data Table on Middle East and Africa - Year-over-year growth 2025-2030 (%)
Chart on Regional Comparison - Middle East and Africa
Data Table on Regional Comparison - Middle East and Africa

12.7.1 Saudi Arabia - Market size and forecast 2025-2030

Chart on Saudi Arabia - Market size and forecast 2025-2030 ($ million)
Data Table on Saudi Arabia - Market size and forecast 2025-2030 ($ million)
Chart on Saudi Arabia - Year-over-year growth 2025-2030 (%)
Data Table on Saudi Arabia - Year-over-year growth 2025-2030 (%)

12.7.2 UAE - Market size and forecast 2025-2030

Chart on UAE - Market size and forecast 2025-2030 ($ million)
Data Table on UAE - Market size and forecast 2025-2030 ($ million)
Chart on UAE - Year-over-year growth 2025-2030 (%)
Data Table on UAE - Year-over-year growth 2025-2030 (%)

12.7.3 South Africa - Market size and forecast 2025-2030

Chart on South Africa - Market size and forecast 2025-2030 ($ million)
Data Table on South Africa - Market size and forecast 2025-2030 ($ million)
Chart on South Africa - Year-over-year growth 2025-2030 (%)
Data Table on South Africa - Year-over-year growth 2025-2030 (%)

12.7.4 Israel - Market size and forecast 2025-2030

Chart on Israel - Market size and forecast 2025-2030 ($ million)
Data Table on Israel - Market size and forecast 2025-2030 ($ million)
Chart on Israel - Year-over-year growth 2025-2030 (%)
Data Table on Israel - Year-over-year growth 2025-2030 (%)

12.7.5 Turkey - Market size and forecast 2025-2030

Chart on Turkey - Market size and forecast 2025-2030 ($ million)
Data Table on Turkey - Market size and forecast 2025-2030 ($ million)
Chart on Turkey - Year-over-year growth 2025-2030 (%)
Data Table on Turkey - Year-over-year growth 2025-2030 (%)

12.8 Market opportunity by geography

Market opportunity by geography ($ million)
Data Tables on Market opportunity by geography ($ million)

13. Drivers, Challenges, and Opportunity

13.1 Market drivers

Expansion of digital creator economy and home recording workflows
Technological integration of cloud computing and wireless software ecosystems
Convergence of organic acoustic elements with advanced digital synthesis

13.2 Market challenges

Heightened cybersecurity vulnerabilities and data privacy risks in cloud connected instruments
Stringent electronic waste mandates and extended producer responsibility regulations
Technical friction in cross platform interoperability and legacy data standard transitions

13.3 Impact of drivers and challenges

Impact of drivers and challenges in 2025 and 2030

13.4 Market opportunities

Widespread adoption of tactile three dimensional sensing and expressive performance pads
Integration of real time tactile effects strips and throw levers for performance articulation
Proliferation of micro form factor audio hubs and desktop optimized hardware ecosystems

14. Competitive Landscape

14.1 Overview

14.2

Overview on criticality of inputs and factors of differentiation

14.3 Landscape disruption

Overview on factors of disruption

14.4 Industry risks

Impact of key risks on business

15. Competitive Analysis

15.1 Companies profiled

Companies covered

15.2 Company ranking index

15.3 Market positioning of companies

Matrix on companies position and classification

15.4 Akai Professional

Akai Professional - Overview
Akai Professional - Product / Service
Akai Professional - Key offerings
SWOT

15.5 Alesis

Alesis - Overview
Alesis - Product / Service
Alesis - Key offerings
SWOT

15.6 Arturia

Arturia - Overview
Arturia - Product / Service
Arturia - Key offerings
SWOT

15.7 Behringer

Behringer - Overview
Behringer - Product / Service
Behringer - Key offerings
SWOT

15.8 CASIO Computer Co. Ltd.

CASIO Computer Co. Ltd. - Overview
CASIO Computer Co. Ltd. - Business segments
CASIO Computer Co. Ltd. - Key offerings
CASIO Computer Co. Ltd. - Segment focus
SWOT

15.9 Elektron Music Machines Mav AB

Elektron Music Machines Mav AB - Overview
Elektron Music Machines Mav AB - Product / Service
Elektron Music Machines Mav AB - Key offerings
SWOT

15.10 Kawai Musical Instruments Mfg.

Kawai Musical Instruments Mfg. - Overview
Kawai Musical Instruments Mfg. - Product / Service
Kawai Musical Instruments Mfg. - Key offerings
SWOT

15.11 KORG Inc.

KORG Inc. - Overview
KORG Inc. - Product / Service
KORG Inc. - Key offerings
SWOT

15.12 Moog Music Inc.

Moog Music Inc. - Overview
Moog Music Inc. - Product / Service
Moog Music Inc. - Key offerings
SWOT

15.13 Native Instruments GmbH

Native Instruments GmbH - Overview
Native Instruments GmbH - Product / Service
Native Instruments GmbH - Key offerings
SWOT

15.14 Pearl Musical Instrument Co.

Pearl Musical Instrument Co. - Overview
Pearl Musical Instrument Co. - Product / Service
Pearl Musical Instrument Co. - Key offerings
SWOT

15.15 Roland Corp.

Roland Corp. - Overview
Roland Corp. - Product / Service
Roland Corp. - Key offerings
SWOT

15.16 Sequential LLC

Sequential LLC - Overview
Sequential LLC - Product / Service
Sequential LLC - Key offerings
SWOT

15.17 Suzuki Musical Instrument Corp

Suzuki Musical Instrument Corp - Overview
Suzuki Musical Instrument Corp - Product / Service
Suzuki Musical Instrument Corp - Key offerings
SWOT

15.18 Yamaha Corp.

Yamaha Corp. - Overview
Yamaha Corp. - Business segments
Yamaha Corp. - Key offerings
Yamaha Corp. - Segment focus
SWOT

16. Appendix

16.1 Scope of the report

Market definition
Objectives
Notes and caveats

16.2 Inclusions and exclusions checklist

Inclusions checklist
Exclusions checklist

16.3 Currency conversion rates for US$

16.4 Research methodology

16.5 Data procurement

Information sources

16.6 Data validation

16.7 Validation techniques employed for market sizing

16.8 Data synthesis

16.9 360 degree market analysis

16.10 List of abbreviations

Research Methodology

Technavio presents a detailed picture of the market by way of study, synthesis, and summation of data from multiple sources. The analysts have presented the various facets of the market with a particular focus on identifying the key industry influencers. The data thus presented is comprehensive, reliable, and the result of extensive research, both primary and secondary.

INFORMATION SOURCES

Primary sources

  • Manufacturers and suppliers
  • Channel partners
  • Industry experts
  • Strategic decision makers

Secondary sources

  • Industry journals and periodicals
  • Government data
  • Financial reports of key industry players
  • Historical data
  • Press releases

DATA ANALYSIS

Data Synthesis

  • Collation of data
  • Estimation of key figures
  • Analysis of derived insights

Data Validation

  • Triangulation with data models
  • Reference against proprietary databases
  • Corroboration with industry experts

REPORT WRITING

Qualitative

  • Market drivers
  • Market challenges
  • Market trends
  • Five forces analysis

Quantitative

  • Market size and forecast
  • Market segmentation
  • Geographical insights
  • Competitive landscape

Interested in this report?

Get your sample now to see our research methodology and insights!

Download Now

Frequently Asked Questions

Electronic Musical Instruments market growth will increase by USD 615.1 million during 2026-2030.

The Electronic Musical Instruments market is expected to grow at a CAGR of 3.2% during 2026-2030.

Electronic Musical Instruments market is segmented by Distribution channel (Offline, Online) Product (Electric pianos and keyboards, String instruments, Drums and percussion instruments, Others) End-user (Commercial events, Music production, Personal use)

Akai Professional, Alesis, Arturia, Behringer, CASIO Computer Co. Ltd., Clavia DMI AB, Elektron Music Machines Mav AB, Kawai Musical Instruments Mfg., KORG Inc., Moog Music Inc., Native Instruments GmbH, Novation Digital Music Systems, Numark, Pearl Musical Instrument Co., Pioneer DJ, Rane Corp., Roland Corp., Sequential LLC, Suzuki Musical Instrument Corp, teenage engineering ab, Waldorf Music GmbH, Yamaha Corp. are a few of the key vendors in the Electronic Musical Instruments market.

North America will register the highest growth rate of 42.4% among the other regions. Therefore, the Electronic Musical Instruments market in North America is expected to garner significant business opportunities for the vendors during the forecast period.

US, Canada, Mexico, Germany, UK, France, Italy, Spain, The Netherlands, China, Japan, South Korea, India, Australia, Indonesia, Brazil, Argentina, Chile, Saudi Arabia, UAE, South Africa, Israel, Turkey

  • Expansion of digital creator economy and home recording workflows is the driving factor this market.

The Electronic Musical Instruments market vendors should focus on grabbing business opportunities from the Distribution channel segment as it accounted for the largest market share in the base year.
RIA - Research AI Assistant
Ask RIA
