Encapsulated Lactic Acid Market Analysis North America, Europe, APAC, South America, Middle East and Africa - US, China, Japan, Germany, UK - Size and Forecast 2024-2028

Encapsulated Lactic Acid Market Analysis North America, Europe, APAC, South America, Middle East and Africa - US, China, Japan, Germany, UK - Size and Forecast 2024-2028

Published: Jan 2024 162 Pages SKU: IRTNTR77343

Market Overview at a Glance

$334.35 Mn
Market Opportunity
6.62%
CAGR
5.89
YoY growth 2023-2024(%)

Encapsulated Lactic Acid Market 2024-2028

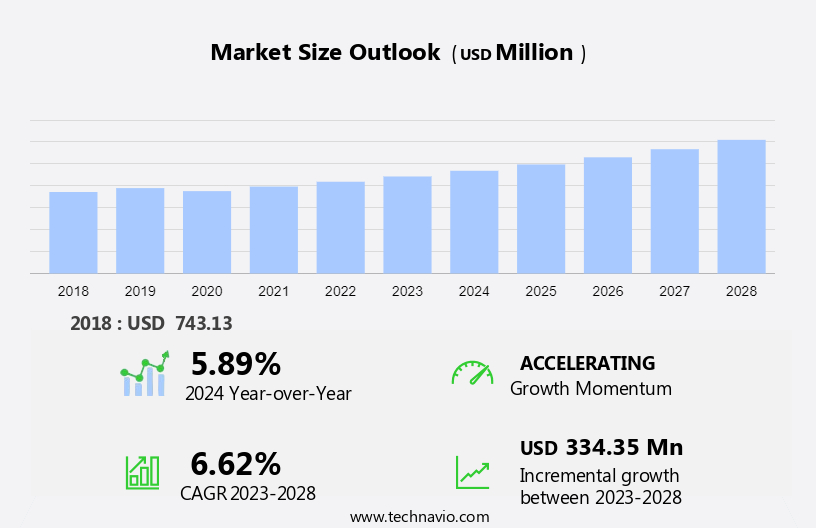
The encapsulated lactic acid market size is forecast to increase by USD 334.35 million, at a CAGR of 6.62% between 2023 and 2028. The growth rate of the market depends on several factors, including the rise in popularity of probiotics the health benefits of natural preservatives over synthetic food preservatives, and the increasing demand for minimally processed food. 

The report includes a comprehensive outlook on the market, offering forecasts for the industry segmented by Type, which comprises synthetic and organic. Additionally, it categorizes Application into confectionery, dairy products, sauces and meats, salad and dressings, and pharmaceuticals, and covers Regions, including North America, Europe, APAC, South America, and Middle East and Africa. The report provides market size, historical data spanning from 2018 to 2022, and future projections, all presented in terms of value in USD billion for each of the mentioned segments.

What will be the  Market Size During the Forecast Period?

Encapsulated Lactic Acid Market Size

Request Free Sample in PDF

Market Definition 

Encapsulated lactic acid is the process of enclosing or encapsulating lactic acid in a protective capsule or matric, mostly to monitor the release of lactic acid from the capsule in various application areas such as in food, pharma, or cosmetics.

To Know more about the market report  Request Free Sample

Market Key Drivers, Trends, Challenges

Our researchers analyzed the market research and growth data with 2023  as the base year, along with the key market growth analysis, trends, and challenges. A holistic analysis of drivers, trends, and challenges will help companies refine their marketing strategies to gain a competitive advantage. 

Key Market Growth Analysis Driver

The rise in the popularity of probiotics is the key factor driving market growth. Lactic acid is a commonly favored probiotic. Having it encapsulated increases its bioavailability and thus increases its demand. Probiotic food is prepared through the process of fermentation. Cultured or fermented dairy products such as yogurt, kefir, whey, raw cheese, and raw milk, while providing vitamins and minerals, also balance the gut flora. 

Moreover, probiotics can improve the functioning of the immune system by decreasing respiratory infections in consumers and thereby reducing the need for antibiotics. The regular inclusion of probiotics in a child's diet reduces the risk of catching influenza and falling sick frequently. The inherent benefits of probiotics have also encouraged physicians and pharmacists to recommend the intake of probiotic food in one's daily diet, thereby driving the growth of the market.

Significant Market Trends and Analysis

Growing penetration of online food retailing is the primary trend shaping market growth. Online food retailing is popular among consumers as it provides various benefits, such as convenience, better pricing, easy returns, bulk discounts, and a diverse range of products to choose from. Using online retail channels, consumers can opt for the home delivery of purchased products or pick up those products from the nearest stores. Online food retailing is the fastest-growing segment across the world because of increased awareness and rising internet penetration.

Moreover, with e-commerce platforms, such as Amazon.com Inc., consumers can choose from a wide range of brands and purchase processed food products whenever they want, without visiting brick-and-mortar stores. Growth in online retail channels is augmented by the increasing vendor focus on omnichannel retailing that combines the brick-and-mortar channels of distribution and online retailing. Therefore, such factors are expected to drive the growth of the market during the forecast period.

Major Challenge

Competition for primary raw materials is a challenge that affects market growth. Lactic acid is produced by the fermentation of carbohydrates such as glucose, lactose, and sucrose sourced from cane molasses, beets, and others. These fermentable sugars are largely used as the basic raw materials to produce lactic acid. Fermentable sugars have high industrial value in the market.

Moreover, fermentable sugars are also used in several industrial applications, such as industrial alcohols, ethanol, amino acids, acetic acid, antibiotics, vinegar, and bio-based chemicals. Further, there is huge competition for the primary raw material in the market because of the increasing demand for basic fermentable sugar in various industries. Thus, such factors may impede market growth during the forecast period. 

Segmentation by Type, Application, and Geography 

Type Analysis

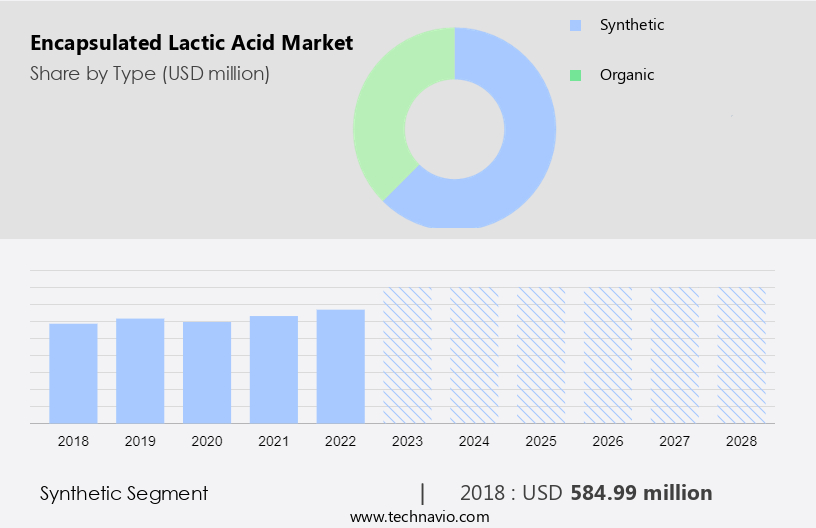
The market share growth by the synthetic segment will be significant during the forecast years. Lactic acid can be synthetically produced by two methods: chemical synthesis and biosynthesis. Chemically synthesized lactic acid is derived by hydrocyanation (a process for conversion of alkanes to nitriles) of raw materials based on fossil fuels such as coal, oil, and natural gas, followed by hydrolysis of the cyanohydrin. However, biosynthesis is the fermentative process of the carbohydrates of raw materials like corn and sugar cane.

Encapsulated Lactic Acid Market Size

Get a glance at the market contribution of the End User  segment Request Free Sample

The synthetic segment accounted for USD 584.99 million in 2018. Since synthetic lactic acid does not contain any of the impurities typically found in the fermentation product, it is colorless and is likely to be more stable. The output yield of synthetically produced lactic acid is higher as it's controlled compared to organic lactic acid. This simultaneously increased demand for the encapsulation of synthetic lactic acid, which will boost the growth of the synthetic segment in the market during the forecast period.

Application Analysis 

A confectionery is a type of food that contains sugar and carbohydrates. Acids in confectionery are used to neutralize the sweetness of sugar and its sugar substitutes. In addition, acids enhance the flavor profile of confectionery. The acid in confectionery, lactic acid, has a mild, lingering acid taste that complements dairy flavors (such as cream) as well as red fruit flavors. Lactic acid powder is used for acid sanding in confectionery. Further, encapsulation of lactic acid powder might avoid sugar inversion and can improve the flavor of confectioneries. This is likely to propel the growth of the confectionery segment in the market in focus during the forecast period.

Region Analysis

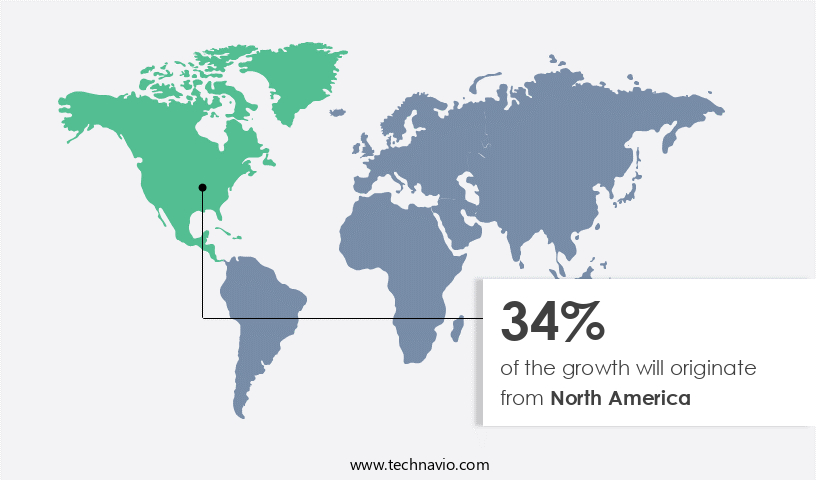
North America is estimated to contribute 34% to the growth of the global market during the projection period.
Technavio's analysts have provided extensive insight into the market forecasting, detailing the regional trends and drivers influencing the market's trajectory throughout the projection period.

Encapsulated Lactic Acid Market Share by Geography

For more insights on the market share of various regions Request Free Sample

The encapsulated lactic acid market in North America is likely to observe growth owing to the rising demand for food additives of natural origin. In the US, one of the main drivers of the food additives market is the growing demand for convenience and packaged foods. This demand for convenience food is attributed to the hectic lifestyles of consumers and the growing need for leisure time. 

Further, the rising demand for encapsulated lactic acid in food and beverage and cosmetic products will also drive the encapsulated lactic market in the region. The rising demand for encapsulated lactic acid in the pharmaceutical and nutraceutical industry in North America is likely to boost the market demand for encapsulated lactic acid. North American countries such as the US, Canada, and Mexico have major pharmaceutical markets. Hence, such factors are expected to drive market growth in this region during the forecast period.  

Key Companies

Companies are implementing various market growth and forecasting strategies by analyzing factors such as strategic alliances, partnerships, mergers and acquisitions, geographical expansion, and product or service launches, to enhance their presence in the market.

  • Balchem Inc.: The company offers encapsulated lactic acid that helps to extend shelf life, optimize texture, maintain consistent flavor, improve production efficiency, reduce sodium, reduce food waste, and enable clean labels.

The report also includes detailed analyses of the competitive landscape of the market and information about 15 market companies, including: 

Advanced BioNutrition Corp., BASF SE, Cargill Inc., COFCO Corp., Corbion nv, Danimer Scientific Inc., Dow Chemical Co., DuPont de Nemours Inc., Food Ingredient Technology Co. Ltd., Gat Foods, Henan Jindan lactic acid Technology Co. Ltd., International Flavors and Fragrances Inc., Kerry Group Plc, Koninklijke DSM NV, Lycored, Royal FrieslandCampina NV, Teijin Ltd., Unitika Ltd., and Vigon International Inc.

Qualitative and quantitative analysis of companies has been conducted to help clients understand the wider business environment as well as the strengths and weaknesses of key market players. Data is qualitatively analyzed to categorize companies as pure play, category-focused, industry-focused, and diversified; it is quantitatively analyzed to categorize companies as dominant, leading, strong, tentative, and weak.

Segment Overview

The market report predicts market growth by revenue at global, regional & country levels and provides an analysis of the latest market growth and trends opportunities from 2018-2028. 

  • Type Outlook 
    • Synthetic
    • Organic
  • Application Outlook
    • Confectionery
    • Dairy products
    • Sauces and meats
    • Salad and dressings
    • Pharmaceuticals
  • Region Outlook 
    • North America
      • The U.S.
      • Canada
    • Europe
      • The U.K.
      • Germany
      • France
      • Rest of Europe
    • APAC
      • China
      • India
    • South America
      • Chile
      • Brazil
      • Argentina
    • Middle East & Africa
      • Saudi Arabia
      • South Africa
      • Rest of the Middle East & Africa

Encapsulated Lactic Acid Market Scope

Report Coverage

Details

Page number

162

Base year

2023

Historic period

2018-2022

Forecast period

2024-2028

Growth momentum & CAGR

Accelerate at a CAGR of 6.62%

Market Growth 2024-2028

USD 334.35 million

Market structure

Fragmented

YoY growth 2023-2024(%)

5.89

Regional analysis

North America, Europe, APAC, South America, and Middle East and Africa

Performing market contribution

North America at 34%

Key countries

US, China, Japan, Germany, and UK

Competitive landscape

Leading Companies, Market Positioning of Companies, Competitive Strategies, and Industry Risks

Key companies profiled

Advanced BioNutrition Corp., Balchem Inc., BASF SE, Cargill Inc., COFCO Corp., Corbion nv, Danimer Scientific Inc., Dow Chemical Co., DuPont de Nemours Inc., Food Ingredient Technology Co. Ltd., Gat Foods, Henan Jindan lactic acid Technology Co. Ltd., International Flavors and Fragrances Inc., Kerry Group Plc, Koninklijke DSM NV, Lycored, Royal FrieslandCampina NV, Teijin Ltd., Unitika Ltd., and Vigon International Inc.

Market dynamics

Parent market analysis, Market growth inducers and obstacles, Fast-growing and slow-growing segment analysis, COVID-19 impact and recovery analysis and future consumer dynamics, and market condition analysis for the forecast period. 

Customization purview

If our report has not included the data that you are looking for, you can reach out to our analysts and get segments customized.

Request Free Sample

What are the Key Data Covered in this Encapsulated Lactic Acid Market Research Report?

  • CAGR of the market forecast during the forecast period
  • Detailed information on factors that will drive the growth of the market  between 2024 and 2028
  • Precise estimation of the market size and its contribution to the market in focus on the parent market
  • Accurate predictions about upcoming trends and changes in consumer behavior
  • Growth of the market across North America, Europe, APAC, South America, and Middle East and Africa
  • Thorough market analysis and report of the market’s competitive landscape and detailed information about companies
  • Comprehensive analysis of factors that will challenge the growth of market companies

We can help! Our analysts can customize this market research report to meet your requirements. Get in touch

1 Executive Summary

  • 1.1 Market overview
    • Exhibit 01: Executive Summary – Chart on Market Overview
    • Exhibit 02: Executive Summary – Data Table on Market Overview
    • Exhibit 03: Executive Summary – Chart on Global Market Characteristics
    • Exhibit 04: Executive Summary – Chart on Market by Geography
    • Exhibit 05: Executive Summary – Chart on Market Segmentation by Type
    • Exhibit 06: Executive Summary – Chart on Market Segmentation by Application
    • Exhibit 07: Executive Summary – Chart on Incremental Growth
    • Exhibit 08: Executive Summary – Data Table on Incremental Growth
    • Exhibit 09: Executive Summary – Chart on Vendor Market Positioning

2 Market Landscape

  • 2.1 Market ecosystem
    • Exhibit 10: Parent market
    • Exhibit 11: Market Characteristics

3 Market Sizing

  • 3.1 Market definition
    • Exhibit 12: Offerings of vendors included in the market definition
  • 3.2 Market segment analysis
    • Exhibit 13: Market segments
  • 3.3 Market size 2023
    • 3.4 Market outlook: Forecast for 2023-2028
      • Exhibit 14: Chart on Global - Market size and forecast 2023-2028 ($ million)
      • Exhibit 15: Data Table on Global - Market size and forecast 2023-2028 ($ million)
      • Exhibit 16: Chart on Global Market: Year-over-year growth 2023-2028 (%)
      • Exhibit 17: Data Table on Global Market: Year-over-year growth 2023-2028 (%)

    4 Historic Market Size

    • 4.1 Global encapsulated lactic acid market 2018 - 2022
      • Exhibit 18: Historic Market Size – Data Table on global encapsulated lactic acid market 2018 - 2022 ($ million)
    • 4.2 Type Segment Analysis 2018 - 2022
      • Exhibit 19: Historic Market Size – Type Segment 2018 - 2022 ($ million)
    • 4.3 Application Segment Analysis 2018 - 2022
      • Exhibit 20: Historic Market Size – Application Segment 2018 - 2022 ($ million)
    • 4.4 Geography Segment Analysis 2018 - 2022
      • Exhibit 21: Historic Market Size – Geography Segment 2018 - 2022 ($ million)
    • 4.5 Country Segment Analysis 2018 - 2022
      • Exhibit 22: Historic Market Size – Country Segment 2018 - 2022 ($ million)

    5 Five Forces Analysis

    • 5.1 Five forces summary
      • Exhibit 23: Five forces analysis - Comparison between 2023 and 2028
    • 5.2 Bargaining power of buyers
      • Exhibit 24: Chart on Bargaining power of buyers – Impact of key factors 2023 and 2028
    • 5.3 Bargaining power of suppliers
      • Exhibit 25: Bargaining power of suppliers – Impact of key factors in 2023 and 2028
    • 5.4 Threat of new entrants
      • Exhibit 26: Threat of new entrants – Impact of key factors in 2023 and 2028
    • 5.5 Threat of substitutes
      • Exhibit 27: Threat of substitutes – Impact of key factors in 2023 and 2028
    • 5.6 Threat of rivalry
      • Exhibit 28: Threat of rivalry – Impact of key factors in 2023 and 2028
    • 5.7 Market condition
      • Exhibit 29: Chart on Market condition - Five forces 2023 and 2028

    6 Market Segmentation by Type

    • 6.1 Market segments
      • Exhibit 30: Chart on Type - Market share 2023-2028 (%)
      • Exhibit 31: Data Table on Type - Market share 2023-2028 (%)
    • 6.2 Comparison by Type
      • Exhibit 32: Chart on Comparison by Type
      • Exhibit 33: Data Table on Comparison by Type
    • 6.3 Synthetic - Market size and forecast 2023-2028
      • Exhibit 34: Chart on Synthetic - Market size and forecast 2023-2028 ($ million)
      • Exhibit 35: Data Table on Synthetic - Market size and forecast 2023-2028 ($ million)
      • Exhibit 36: Chart on Synthetic - Year-over-year growth 2023-2028 (%)
      • Exhibit 37: Data Table on Synthetic - Year-over-year growth 2023-2028 (%)
    • 6.4 Organic - Market size and forecast 2023-2028
      • Exhibit 38: Chart on Organic - Market size and forecast 2023-2028 ($ million)
      • Exhibit 39: Data Table on Organic - Market size and forecast 2023-2028 ($ million)
      • Exhibit 40: Chart on Organic - Year-over-year growth 2023-2028 (%)
      • Exhibit 41: Data Table on Organic - Year-over-year growth 2023-2028 (%)
    • 6.5 Market opportunity by Type
      • Exhibit 42: Market opportunity by Type ($ million)
      • Exhibit 43: Data Table on Market opportunity by Type ($ million)

    7 Market Segmentation by Application

    • 7.1 Market segments
      • Exhibit 44: Chart on Application - Market share 2023-2028 (%)
      • Exhibit 45: Data Table on Application - Market share 2023-2028 (%)
    • 7.2 Comparison by Application
      • Exhibit 46: Chart on Comparison by Application
      • Exhibit 47: Data Table on Comparison by Application
    • 7.3 Confectionery - Market size and forecast 2023-2028
      • Exhibit 48: Chart on Confectionery - Market size and forecast 2023-2028 ($ million)
      • Exhibit 49: Data Table on Confectionery - Market size and forecast 2023-2028 ($ million)
      • Exhibit 50: Chart on Confectionery - Year-over-year growth 2023-2028 (%)
      • Exhibit 51: Data Table on Confectionery - Year-over-year growth 2023-2028 (%)
    • 7.4 Dairy products - Market size and forecast 2023-2028
      • Exhibit 52: Chart on Dairy products - Market size and forecast 2023-2028 ($ million)
      • Exhibit 53: Data Table on Dairy products - Market size and forecast 2023-2028 ($ million)
      • Exhibit 54: Chart on Dairy products - Year-over-year growth 2023-2028 (%)
      • Exhibit 55: Data Table on Dairy products - Year-over-year growth 2023-2028 (%)
    • 7.5 Sauces and meats - Market size and forecast 2023-2028
      • Exhibit 56: Chart on Sauces and meats - Market size and forecast 2023-2028 ($ million)
      • Exhibit 57: Data Table on Sauces and meats - Market size and forecast 2023-2028 ($ million)
      • Exhibit 58: Chart on Sauces and meats - Year-over-year growth 2023-2028 (%)
      • Exhibit 59: Data Table on Sauces and meats - Year-over-year growth 2023-2028 (%)
    • 7.6 Salad and dressings - Market size and forecast 2023-2028
      • Exhibit 60: Chart on Salad and dressings - Market size and forecast 2023-2028 ($ million)
      • Exhibit 61: Data Table on Salad and dressings - Market size and forecast 2023-2028 ($ million)
      • Exhibit 62: Chart on Salad and dressings - Year-over-year growth 2023-2028 (%)
      • Exhibit 63: Data Table on Salad and dressings - Year-over-year growth 2023-2028 (%)
    • 7.7 Pharmaceuticals - Market size and forecast 2023-2028
      • Exhibit 64: Chart on Pharmaceuticals - Market size and forecast 2023-2028 ($ million)
      • Exhibit 65: Data Table on Pharmaceuticals - Market size and forecast 2023-2028 ($ million)
      • Exhibit 66: Chart on Pharmaceuticals - Year-over-year growth 2023-2028 (%)
      • Exhibit 67: Data Table on Pharmaceuticals - Year-over-year growth 2023-2028 (%)
    • 7.8 Market opportunity by Application
      • Exhibit 68: Market opportunity by Application ($ million)
      • Exhibit 69: Data Table on Market opportunity by Application ($ million)

    8 Customer Landscape

    • 8.1 Customer landscape overview
      • Exhibit 70: Analysis of price sensitivity, lifecycle, customer purchase basket, adoption rates, and purchase criteria

    9 Geographic Landscape

    • 9.1 Geographic segmentation
      • Exhibit 71: Chart on Market share by geography 2023-2028 (%)
      • Exhibit 72: Data Table on Market share by geography 2023-2028 (%)
    • 9.2 Geographic comparison
      • Exhibit 73: Chart on Geographic comparison
      • Exhibit 74: Data Table on Geographic comparison
    • 9.3 North America - Market size and forecast 2023-2028
      • Exhibit 75: Chart on North America - Market size and forecast 2023-2028 ($ million)
      • Exhibit 76: Data Table on North America - Market size and forecast 2023-2028 ($ million)
      • Exhibit 77: Chart on North America - Year-over-year growth 2023-2028 (%)
      • Exhibit 78: Data Table on North America - Year-over-year growth 2023-2028 (%)
    • 9.4 Europe - Market size and forecast 2023-2028
      • Exhibit 79: Chart on Europe - Market size and forecast 2023-2028 ($ million)
      • Exhibit 80: Data Table on Europe - Market size and forecast 2023-2028 ($ million)
      • Exhibit 81: Chart on Europe - Year-over-year growth 2023-2028 (%)
      • Exhibit 82: Data Table on Europe - Year-over-year growth 2023-2028 (%)
    • 9.5 APAC - Market size and forecast 2023-2028
      • Exhibit 83: Chart on APAC - Market size and forecast 2023-2028 ($ million)
      • Exhibit 84: Data Table on APAC - Market size and forecast 2023-2028 ($ million)
      • Exhibit 85: Chart on APAC - Year-over-year growth 2023-2028 (%)
      • Exhibit 86: Data Table on APAC - Year-over-year growth 2023-2028 (%)
    • 9.6 South America - Market size and forecast 2023-2028
      • Exhibit 87: Chart on South America - Market size and forecast 2023-2028 ($ million)
      • Exhibit 88: Data Table on South America - Market size and forecast 2023-2028 ($ million)
      • Exhibit 89: Chart on South America - Year-over-year growth 2023-2028 (%)
      • Exhibit 90: Data Table on South America - Year-over-year growth 2023-2028 (%)
    • 9.7 Middle East and Africa - Market size and forecast 2023-2028
      • Exhibit 91: Chart on Middle East and Africa - Market size and forecast 2023-2028 ($ million)
      • Exhibit 92: Data Table on Middle East and Africa - Market size and forecast 2023-2028 ($ million)
      • Exhibit 93: Chart on Middle East and Africa - Year-over-year growth 2023-2028 (%)
      • Exhibit 94: Data Table on Middle East and Africa - Year-over-year growth 2023-2028 (%)
    • 9.8 US - Market size and forecast 2023-2028
      • Exhibit 95: Chart on US - Market size and forecast 2023-2028 ($ million)
      • Exhibit 96: Data Table on US - Market size and forecast 2023-2028 ($ million)
      • Exhibit 97: Chart on US - Year-over-year growth 2023-2028 (%)
      • Exhibit 98: Data Table on US - Year-over-year growth 2023-2028 (%)
    • 9.9 China - Market size and forecast 2023-2028
      • Exhibit 99: Chart on China - Market size and forecast 2023-2028 ($ million)
      • Exhibit 100: Data Table on China - Market size and forecast 2023-2028 ($ million)
      • Exhibit 101: Chart on China - Year-over-year growth 2023-2028 (%)
      • Exhibit 102: Data Table on China - Year-over-year growth 2023-2028 (%)
    • 9.10 Germany - Market size and forecast 2023-2028
      • Exhibit 103: Chart on Germany - Market size and forecast 2023-2028 ($ million)
      • Exhibit 104: Data Table on Germany - Market size and forecast 2023-2028 ($ million)
      • Exhibit 105: Chart on Germany - Year-over-year growth 2023-2028 (%)
      • Exhibit 106: Data Table on Germany - Year-over-year growth 2023-2028 (%)
    • 9.11 UK - Market size and forecast 2023-2028
      • Exhibit 107: Chart on UK - Market size and forecast 2023-2028 ($ million)
      • Exhibit 108: Data Table on UK - Market size and forecast 2023-2028 ($ million)
      • Exhibit 109: Chart on UK - Year-over-year growth 2023-2028 (%)
      • Exhibit 110: Data Table on UK - Year-over-year growth 2023-2028 (%)
    • 9.12 Japan - Market size and forecast 2023-2028
      • Exhibit 111: Chart on Japan - Market size and forecast 2023-2028 ($ million)
      • Exhibit 112: Data Table on Japan - Market size and forecast 2023-2028 ($ million)
      • Exhibit 113: Chart on Japan - Year-over-year growth 2023-2028 (%)
      • Exhibit 114: Data Table on Japan - Year-over-year growth 2023-2028 (%)
    • 9.13 Market opportunity by geography
      • Exhibit 115: Market opportunity by geography ($ million)
      • Exhibit 116: Data Tables on Market opportunity by geography ($ million)

    10 Drivers, Challenges, and Trends

    • 10.1 Market drivers
      • 10.2 Market challenges
        • 10.3 Impact of drivers and challenges
          • Exhibit 117: Impact of drivers and challenges in 2023 and 2028
        • 10.4 Market trends

          11 Vendor Landscape

          • 11.1 Overview
            • 11.2 Vendor landscape
              • Exhibit 118: Overview on Criticality of inputs and Factors of differentiation
            • 11.3 Landscape disruption
              • Exhibit 119: Overview on factors of disruption
            • 11.4 Industry risks
              • Exhibit 120: Impact of key risks on business

            12 Vendor Analysis

            • 12.1 Vendors covered
              • Exhibit 121: Vendors covered
            • 12.2 Market positioning of vendors
              • Exhibit 122: Matrix on vendor position and classification
            • 12.3 Balchem Inc.
              • Exhibit 123: Balchem Inc. - Overview
              • Exhibit 124: Balchem Inc. - Business segments
              • Exhibit 125: Balchem Inc. - Key offerings
              • Exhibit 126: Balchem Inc. - Segment focus
            • 12.4 BASF SE
              • Exhibit 127: BASF SE - Overview
              • Exhibit 128: BASF SE - Business segments
              • Exhibit 129: BASF SE - Key news
              • Exhibit 130: BASF SE - Key offerings
              • Exhibit 131: BASF SE - Segment focus
            • 12.5 Cargill Inc.
              • Exhibit 132: Cargill Inc. - Overview
              • Exhibit 133: Cargill Inc. - Product / Service
              • Exhibit 134: Cargill Inc. - Key news
              • Exhibit 135: Cargill Inc. - Key offerings
            • 12.6 Corbion nv
              • Exhibit 136: Corbion nv - Overview
              • Exhibit 137: Corbion nv - Business segments
              • Exhibit 138: Corbion nv - Key news
              • Exhibit 139: Corbion nv - Key offerings
              • Exhibit 140: Corbion nv - Segment focus
            • 12.7 Danimer Scientific Inc.
              • Exhibit 141: Danimer Scientific Inc. - Overview
              • Exhibit 142: Danimer Scientific Inc. - Product / Service
              • Exhibit 143: Danimer Scientific Inc. - Key offerings
            • 12.8 Dow Chemical Co.
              • Exhibit 144: Dow Chemical Co. - Overview
              • Exhibit 145: Dow Chemical Co. - Business segments
              • Exhibit 146: Dow Chemical Co. - Key news
              • Exhibit 147: Dow Chemical Co. - Key offerings
              • Exhibit 148: Dow Chemical Co. - Segment focus
            • 12.9 DuPont de Nemours Inc.
              • Exhibit 149: DuPont de Nemours Inc. - Overview
              • Exhibit 150: DuPont de Nemours Inc. - Business segments
              • Exhibit 151: DuPont de Nemours Inc. - Key news
              • Exhibit 152: DuPont de Nemours Inc. - Key offerings
              • Exhibit 153: DuPont de Nemours Inc. - Segment focus
            • 12.10 Food Ingredient Technology Co. Ltd.
              • Exhibit 154: Food Ingredient Technology Co. Ltd. - Overview
              • Exhibit 155: Food Ingredient Technology Co. Ltd. - Product / Service
              • Exhibit 156: Food Ingredient Technology Co. Ltd. - Key offerings
            • 12.11 Gat Foods
              • Exhibit 157: Gat Foods - Overview
              • Exhibit 158: Gat Foods - Product / Service
              • Exhibit 159: Gat Foods - Key offerings
            • 12.12 Henan Jindan lactic acid Technology Co. Ltd.
              • Exhibit 160: Henan Jindan lactic acid Technology Co. Ltd. - Overview
              • Exhibit 161: Henan Jindan lactic acid Technology Co. Ltd. - Product / Service
              • Exhibit 162: Henan Jindan lactic acid Technology Co. Ltd. - Key offerings
            • 12.13 International Flavors and Fragrances Inc.
              • Exhibit 163: International Flavors and Fragrances Inc. - Overview
              • Exhibit 164: International Flavors and Fragrances Inc. - Business segments
              • Exhibit 165: International Flavors and Fragrances Inc. - Key news
              • Exhibit 166: International Flavors and Fragrances Inc. - Key offerings
              • Exhibit 167: International Flavors and Fragrances Inc. - Segment focus
            • 12.14 Koninklijke DSM NV
              • Exhibit 168: Koninklijke DSM NV - Overview
              • Exhibit 169: Koninklijke DSM NV - Business segments
              • Exhibit 170: Koninklijke DSM NV - Key news
              • Exhibit 171: Koninklijke DSM NV - Key offerings
              • Exhibit 172: Koninklijke DSM NV - Segment focus
            • 12.15 Lycored
              • Exhibit 173: Lycored - Overview
              • Exhibit 174: Lycored - Product / Service
              • Exhibit 175: Lycored - Key offerings
            • 12.16 Teijin Ltd.
              • Exhibit 176: Teijin Ltd. - Overview
              • Exhibit 177: Teijin Ltd. - Business segments
              • Exhibit 178: Teijin Ltd. - Key offerings
              • Exhibit 179: Teijin Ltd. - Segment focus
            • 12.17 Vigon International Inc.
              • Exhibit 180: Vigon International Inc. - Overview
              • Exhibit 181: Vigon International Inc. - Product / Service
              • Exhibit 182: Vigon International Inc. - Key offerings

            13 Appendix

            • 13.1 Scope of the report
              • 13.2 Inclusions and exclusions checklist
                • Exhibit 183: Inclusions checklist
                • Exhibit 184: Exclusions checklist
              • 13.3 Currency conversion rates for US$
                • Exhibit 185: Currency conversion rates for US$
              • 13.4 Research methodology
                • Exhibit 186: Research methodology
                • Exhibit 187: Validation techniques employed for market sizing
                • Exhibit 188: Information sources
              • 13.5 List of abbreviations
                • Exhibit 189: List of abbreviations

              Research Methodology

              Technavio presents a detailed picture of the market by way of study, synthesis, and summation of data from multiple sources. The analysts have presented the various facets of the market with a particular focus on identifying the key industry influencers. The data thus presented is comprehensive, reliable, and the result of extensive research, both primary and secondary.

              INFORMATION SOURCES

              Primary sources

              • Manufacturers and suppliers
              • Channel partners
              • Industry experts
              • Strategic decision makers

              Secondary sources

              • Industry journals and periodicals
              • Government data
              • Financial reports of key industry players
              • Historical data
              • Press releases

              DATA ANALYSIS

              Data Synthesis

              • Collation of data
              • Estimation of key figures
              • Analysis of derived insights

              Data Validation

              • Triangulation with data models
              • Reference against proprietary databases
              • Corroboration with industry experts

              REPORT WRITING

              Qualitative

              • Market drivers
              • Market challenges
              • Market trends
              • Five forces analysis

              Quantitative

              • Market size and forecast
              • Market segmentation
              • Geographical insights
              • Competitive landscape

              Interested in this report?

              Get your sample now to see our research methodology and insights!

              Download Now

              Frequently Asked Questions

              Encapsulated Lactic Acid market growth will increase by $ 334.35 mn during 2024-2028.

              The Encapsulated Lactic Acid market is expected to grow at a CAGR of 6.62% during 2024-2028.

              Encapsulated Lactic Acid market is segmented by Type( Synthetic, Organic) Application( Confectionery, Dairy products, Sauces and meats, Salad and dressings, Pharmaceuticals)

              Advanced BioNutrition Corp., Balchem Inc., BASF SE, Cargill Inc., COFCO Corp., Corbion nv, Danimer Scientific Inc., Dow Chemical Co., DuPont de Nemours Inc., Food Ingredient Technology Co. Ltd., Gat Foods, Henan Jindan lactic acid Technology Co. Ltd., International Flavors and Fragrances Inc., Kerry Group Plc, Koninklijke DSM NV, Lycored, Royal FrieslandCampina NV, Teijin Ltd., Unitika Ltd., Vigon International Inc. are a few of the key vendors in the Encapsulated Lactic Acid market.

              North America will register the highest growth rate of 34% among the other regions. Therefore, the Encapsulated Lactic Acid market in North America is expected to garner significant business opportunities for the vendors during the forecast period.

              US, China, Japan, Germany, UK

              • Rise in popularity of probioticsLactic acid is a commonly favored probiotic. Having it encapsulated increases its bioavailability and thus increases its demand. Probiotic food is prepared through the process of fermentation. Cultured or fermented dairy products such as yogurt is the driving factor this market.
              • kefir is the driving factor this market.
              • whey is the driving factor this market.
              • raw cheese is the driving factor this market.
              • and raw milk is the driving factor this market.
              • while providing vitamins and minerals is the driving factor this market.
              • also balance the gut flora. Vegetables such as cabbage is the driving factor this market.
              • cucumber is the driving factor this market.
              • beetroot is the driving factor this market.
              • carrot is the driving factor this market.
              • and pepper are also preserved through lacto-fermentation. Probiotics can improve the functioning of the immune system by decreasing respiratory infections in consumers and thereby reducing the need for antibiotics. The regular inclusion of probiotics in a childs diet reduces the risk of catching influenza and falling sick frequently. The inherent benefits of probiotics have also encouraged physicians and pharmacists to recommend the intake of probiotic food in ones daily diet is the driving factor this market.
              • thereby driving the growth of the global encapsulated lactic acid market. is the driving factor this market.

              The Encapsulated Lactic Acid market vendors should focus on grabbing business opportunities from the Synthetic segment as it accounted for the largest market share in the base year.