
Engineered Fluids Market Size 2024-2028
The engineered fluids market size is forecast to increase by USD 468.1 million at a CAGR of 7.08% between 2023 and 2028.
- The market is experiencing significant growth due to its increasing application in various industries such as electronics and semiconductors, aerospace, energy, and mineral oil. One of the key drivers is the rising demand for engineered fluids In the construction, steel, and cement industry, which is contributing to market expansion. Another trend is the emergence of bio-based engineered fluids, which are gaining popularity due to their eco-friendly nature and reduced environmental impact. However, there are challenges associated with the production and disposal of engineered fluids, which need to be addressed to ensure sustainable growth.
- In the electronics and semiconductor industry, engineered fluids are used as coolants and lubricants, while in aerospace, they are used in hydraulic systems and fuel additives. In the energy sector, engineered fluids are used in drilling operations and as heat transfer fluids, and in mineral oil, they are used as lubricants and fuel additives. The market analysis report provides a comprehensive study of these trends and challenges, offering valuable insights for stakeholders.
What will be the Size of the Engineered Fluids Market During the Forecast Period?

- Engineered fluids, a specialized category of fluids, play a vital role in various industries due to their unique properties that cater to specific applications. These fluids include heat transfer fluids, dielectric fluids, hydraulic fluids, refrigeration fluids, and others. Heat transfer fluids are utilized extensively in power generation and thermal energy storage systems to enhance heat transfer efficiency. They are designed to operate at high temperatures and pressures, ensuring optimal performance in power plants and industrial processes. In the electronics and semiconductor sector, dielectric fluids serve as insulating media in capacitors and transformers. Their excellent electrical insulation properties ensure reliable and efficient power transmission in electronic devices. The aerospace industry relies on engineered fluids for hydraulic systems and lubrication purposes. Hydraulic fluids provide the necessary pressure and power to operate various aircraft systems, while lubricants ensure the smooth functioning of engines and mechanical components. Engineered fluids also find extensive applications in the energy sector, particularly in renewable energy sources and power generating technologies.
- Mineral oil-based fluids are widely used as coolants in solar thermal power plants, while nanotechnology-enhanced fluids improve the performance of fuel cells and batteries. Thermal stability is a crucial factor In the selection of engineered fluids for various applications. Fluoride-based lubricants, for instance, offer superior thermal stability, making them suitable for high-temperature applications In the automotive sector and chemical industries. The Oil Industry Analysts' Association (OIA) reports that the market for engineered fluids is expected to grow due to the increasing demand for energy efficiency and performance in various industries. The growing focus on renewable energy sources and power generating technologies is also expected to drive the market growth. Thus, engineered fluids offer unique properties that cater to specific applications in various industries, including heat transfer, electronics, aerospace, energy, and chemical industries. Their role in enhancing efficiency, improving performance, and ensuring reliability makes them an essential component in numerous industrial processes. The market for engineered fluids is expected to grow due to the increasing demand for energy efficiency and performance in various industries.
How is this Engineered Fluids Industry segmented and which is the largest segment?
The engineered fluids industry research report provides comprehensive data (region-wise segment analysis), with forecasts and estimates in "USD million" for the period 2024-2028, as well as historical data from 2018-2022 for the following segments.
- Type
- Lubricants
- Solvents
- Heat transfer fluids
- Geography
- APAC
- China
- India
- North America
- Canada
- US
- Europe
- Germany
- Middle East and Africa
- South America
- APAC
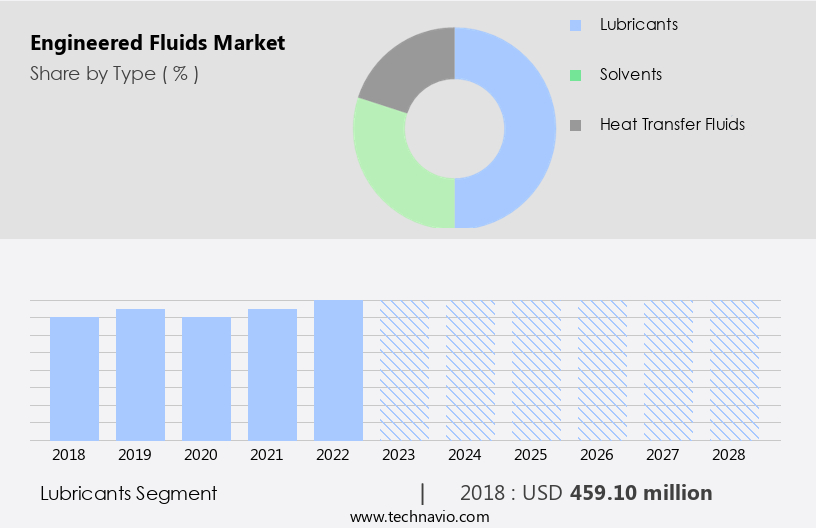
By Type Insights
- The lubricants segment is estimated to witness significant growth during the forecast period.
Engineered fluids, including lubricants, play a crucial role in enhancing the efficiency and productivity of various industries such as Electronics & Semiconductors, Aerospace, and Energy. Mineral oil-based lubricants, derived from petroleum or crude oil, are widely used due to their large-scale production during refining processes, making them cost-effective. These lubricants are suitable for applications where cost is a significant consideration. On the other hand, synthetic lubricants are manufactured using chemically modified petroleum compounds, resulting in superior performance. They offer enhanced properties such as a high viscosity index, better oxidation resistance, and improved thermal stability.
Further, these high-performance lubricants are ideal for demanding applications in industries where equipment performance and reliability are critical. In summary, engineered fluids, including mineral oil-based and synthetic lubricants, play a vital role in improving the efficiency and productivity of various industries. Mineral oil-based lubricants, due to their large-scale production during petroleum refining, offer cost advantages, while synthetic lubricants provide superior performance for demanding applications.
Get a glance at the Engineered Fluids Industry report of share of various segments Request Free Sample
The lubricants segment was valued at USD 459.10 million in 2018 and showed a gradual increase during the forecast period.
Regional Analysis
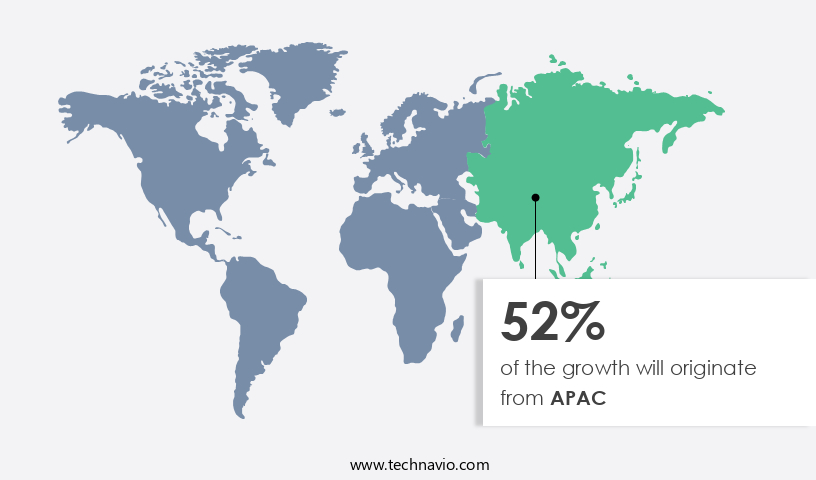
- APAC is estimated to contribute 52% to the growth of the global market during the forecast period.
Technavio's analysts have elaborately explained the regional trends and drivers that shape the market during the forecast period.
For more insights on the market share of various regions, Request Free Sample
The market in APAC held the largest share In the global market in 2023, primarily due to the significant focus on the automotive and construction industries In the region. The revival of the metals, mining, and mineral processing industries has further boosted market growth. The construction sector's expansion and the increasing number of manufacturing facilities are anticipated to drive the demand for industrial machinery and machine tools, positively influencing the market. APAC's market growth can be attributed to several factors. These include the increasing demand for automobiles, the rise in construction activities and gas production, the expansion of the mining industry, and the growth in offshore and oil drilling activities. Power generating technologies, such as thermal energy storage, are also adopting engineered fluids to enhance their efficiency.
Moreover, nanotechnology is being integrated into engineered fluids to improve their performance and properties. In the chemical industries, engineered fluids are used as coolants, lubricants, and solvents. Their unique properties, such as high thermal stability, low toxicity, and biodegradability, make them an ideal choice for various applications. As the demand for these industries continues to grow, the market is expected to experience significant expansion in APAC. In summary, the market in APAC is thriving due to the region's industrial sector, with a focus on the automotive, construction, power generation, and chemical industries. The integration of nanotechnology and thermal energy storage technologies is further driving market growth. The region's economic development and industrial expansion are expected to continue fueling the demand for engineered fluids In the coming years.
Market Dynamics
Our researchers analyzed the data with 2023 as the base year, along with the key drivers, trends, and challenges. A holistic analysis of drivers will help companies refine their marketing strategies to gain a competitive advantage.
What are the key market drivers leading to the rise In the adoption of Engineered Fluids Industry?
Growing demand for engineered fluids in the construction, steel, and cement industries is the key driver of the market.
- The automotive sector represents a significant consumer base for engineered fluids In the global market. Beyond this industry, the construction, steel, and cement sectors also contribute to its growth. In the construction industry, engineered fluids, including lubricants, are extensively utilized in various industrial oils for construction equipment. These fluids offer superior anti-wear properties, resistance to corrosion, exceptional lubricity, water tolerance, and filterability.
- For instance, hydraulic fluids derived from engineered fluids are employed in earthmoving machinery, such as crawler excavators, mini excavators, wheeled excavators, wheeled dozers, and skid-steer loaders, due to their excellent energy transmission capacity. In the steel and cement industries, engineered fluids are employed to extend drain/re-greasing intervals, improve lubrication efficiency, enhance wear resistance of friction pairs, and boost the overall lifespan of the equipment.
What are the market trends shaping the Engineered Fluids Industry?
The emergence of bio-based engineered fluids is the upcoming market trend.
- The utilization of bio-based engineered fluids is gaining traction In the global market, as both end-users and manufacturers recognize their benefits. Bio-based fluids, which include Heat Transfer Fluids, Dielectric Fluids, Hydraulic Fluids, and Refrigeration Fluids, are increasingly being produced from renewable sources. Compared to their petroleum-based counterparts, these eco-friendly alternatives offer several advantages. They produce fewer toxic byproducts during use, resulting in a cleaner work environment for those handling engines and hydraulic systems. Moreover, bio-based engineered fluids require less maintenance, storage, and disposal, leading to cost savings over the product's lifecycle.
- Additionally, they exhibit superior safety features, such as higher flashpoints, consistent viscosity, and reduced oil mist and vapor emissions. The companies are focusing on minimizing bioaccumulation and eco-toxicity to lessen the environmental impact. By adopting bio-based engineered fluids, pollution from stormwater, hydraulic systems, and brake fluid leaks can be significantly reduced. This trend is expected to continue as environmental concerns become increasingly important.
What challenges does the Engineered Fluids Industry face during its growth?
The environmental impact of engineered fluids is a key challenge affecting the industry's growth.
- Engineered fluids, including lubricants, contribute to environmental concerns due to their potential toxicity and low biodegradability. These fluids can release harmful substances into the environment during production, processing, and disposal methods such as recycling, burning, and landfills. Mineral oil-based lubricants, in particular, pose significant environmental risks due to their high eco-toxicity.
- Toxic elements in lubricants can negatively impact various species, particularly affecting the liver and kidneys of fish and mammals through direct exposure. The adverse effects of lubricants on the environment have become a pressing issue, especially in industrialized nations. The demand for eco-friendly engineered fluids is increasing as a response to growing environmental concerns.
Exclusive Customer Landscape
The engineered fluids market forecasting report includes the adoption lifecycle of the market, market growth and forecasting, covering from the innovator's stage to the laggard's stage. It focuses on adoption rates in different regions based on penetration. Furthermore, the engineered fluids market report also includes key purchase criteria and drivers of price sensitivity to help companies evaluate and develop their market growth analysis strategies.

Customer Landscape
Key Companies & Market Insights
Companies are implementing various strategies, such as strategic alliances, engineered fluids market forecast, partnerships, mergers and acquisitions, geographical expansion, and product/service launches, to enhance their presence In the industry.
The industry research and growth report includes detailed analyses of the competitive landscape of the market and information about key companies, including:
- 3M Co.
- ASA Computers Inc.
- CPI Fluid Engineering Corp.
- DCX The Liquid Cooling Co.
- Engineered Fluids Inc.
- F2 Chemicals Ltd.
- Frontier Performance Lubricants Inc.
- Halocarbon LLC
- HaloPolymer OJSC
- IKV Tribology Ltd.
- Interflon BV
- Kluber Lubrication Munchen SE and Co. KG
- Lubrilog SAS
- Merck KGaA
- Nye Lubricants Inc.
- Performance Fluids Ltd.
- Perstorp Holding AB
- Shell plc
- Solvay SA
- The Lubrizol Corp.
Qualitative and quantitative analysis of companies has been conducted to help clients understand the wider business environment as well as the strengths and weaknesses of key industry players. Data is qualitatively analyzed to categorize companies as pure play, category-focused, industry-focused, and diversified; it is quantitatively analyzed to categorize companies as dominant, leading, strong, tentative, and weak.
Research Analyst Overview
Engineered fluids play a crucial role in various industries, including electronics & semiconductors, aerospace, energy, and chemical industries. These specialized fluids, such as heat transfer fluids, hydraulic fluids, refrigeration fluids, and dielectric fluids, are designed to meet specific performance requirements. Heat transfer fluids are essential in power generating technologies and thermal energy storage systems, ensuring efficient heat transfer and thermal stability. In the electronics & semiconductors sector, dielectric fluids provide electrical insulation, enabling the functioning of complex electronic devices. Hydraulic fluids are indispensable In the automotive sector and heavy machinery, while refrigeration fluids are used in cooling systems for temperature control.
Similarly, synthetic, mineral oil, bio-based, and fluoride-based lubricants are used across industries to reduce friction and wear, enhance thermal stability, and extend equipment life. The aerospace industry relies on engineered fluids for various applications, including hydraulic systems, fuel systems, and cooling systems. In the energy sector, engineered fluids are used in renewable energy sources, such as solar thermal power plants and geothermal power systems, to improve efficiency and performance. Nanotechnology is increasingly being used to develop advanced engineered fluids with enhanced properties, such as improved thermal conductivity, chemical resistance, and lubricity. The chemical industries leverage these advanced fluids for various applications, including manufacturing processes and product formulations.
|
Market Scope |
|
|
Report Coverage |
Details |
|
Page number |
131 |
|
Base year |
2023 |
|
Historic period |
2018-2022 |
|
Forecast period |
2024-2028 |
|
Growth momentum & CAGR |
Accelerate at a CAGR of 7.08% |
|
Market growth 2024-2028 |
USD 468.1 million |
|
Market structure |
Fragmented |
|
YoY growth 2023-2024(%) |
6.49 |
|
Key countries |
US, China, India, Germany, and Canada |
|
Competitive landscape |
Leading Companies, Market Positioning of Companies, Competitive Strategies, and Industry Risks |
What are the Key Data Covered in this Engineered Fluids Market Research and Growth Report?
- CAGR of the Engineered Fluids industry during the forecast period
- Detailed information on factors that will drive the growth and forecasting between 2024 and 2028
- Precise estimation of the size of the market and its contribution of the industry in focus to the parent market
- Accurate predictions about upcoming growth and trends and changes in consumer behaviour
- Growth of the market across APAC, North America, Europe, Middle East and Africa, and South America
- Thorough analysis of the market's competitive landscape and detailed information about companies
- Comprehensive analysis of factors that will challenge the engineered fluids market growth of industry companies
We can help! Our analysts can customize this engineered fluids market research report to meet your requirements.
 RIA -
RIA - 
