Engineering Services Market Analysis, Size, and Forecast 2026-2030: North America (US, Canada, and Mexico), Europe (Germany, UK, and France), APAC (China, India, and Japan), South America (Brazil and Argentina), Middle East and Africa (UAE, Saudi Arabia, and South Africa), and Rest of World (ROW)

Engineering Services Market Analysis, Size, and Forecast 2026-2030:
North America (US, Canada, and Mexico), Europe (Germany, UK, and France), APAC (China, India, and Japan), South America (Brazil and Argentina), Middle East and Africa (UAE, Saudi Arabia, and South Africa), and Rest of World (ROW)

Published: Mar 2026 299 Pages SKU: IRTNTR70265

Market Overview at a Glance

$452.1 B
Market Opportunity
4.6%
CAGR 2025 - 2030
33.8%
North America Growth
$363.2 B
Automotive segment 2024

Engineering Services Market Size 2026-2030

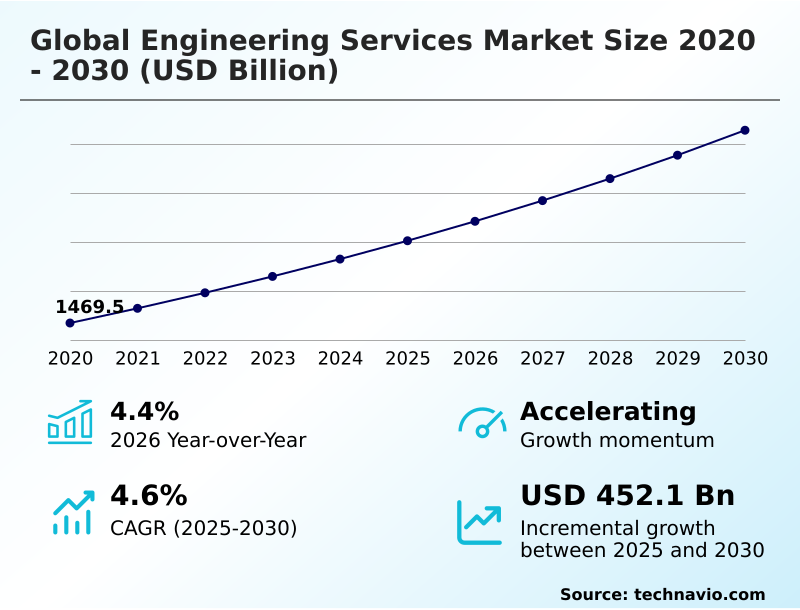
The engineering services market size is valued to increase by USD 452.1 billion, at a CAGR of 4.6% from 2025 to 2030. Accelerated digital transformation and integration of generative AI will drive the engineering services market.

Major Market Trends & Insights

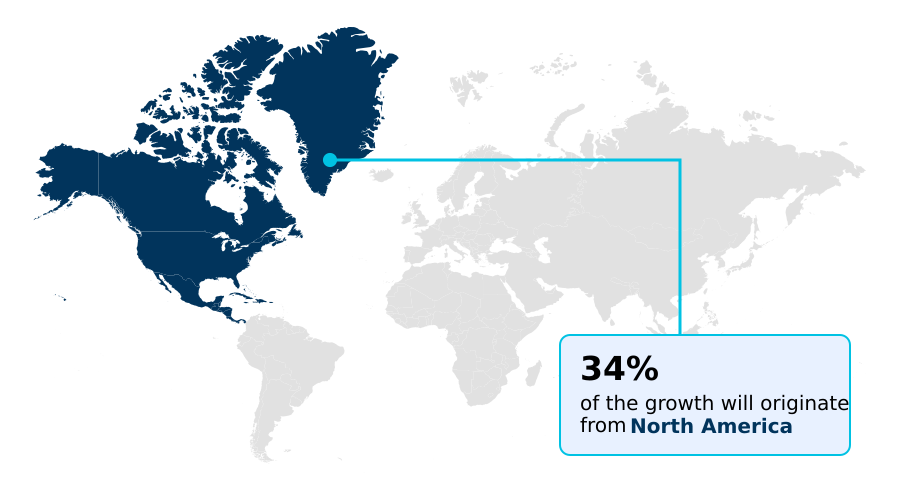
  • North America dominated the market and accounted for a 33.8% growth during the forecast period.
  • By End-user - Automotive segment was valued at USD 363.2 billion in 2024
  • By Deployment - Outsourcing segment accounted for the largest market revenue share in 2024

Market Size & Forecast

  • Market Opportunities: USD 788.6 billion
  • Market Future Opportunities: USD 452.1 billion
  • CAGR from 2025 to 2030 : 4.6%

Market Summary

  • The engineering services market is undergoing a fundamental transformation, driven by the integration of digital technologies and a global focus on sustainability. This evolution moves beyond traditional methodologies toward data-centric approaches that utilize digital twins, generative AI, and high-performance computing to optimize the entire product lifecycle.
  • A key business scenario involves using real-time simulation tools to model a new manufacturing line, allowing engineers to identify and resolve potential bottlenecks before construction begins, which has been shown to reduce physical prototyping costs by over 40%. The demand for green design services and adherence to sustainable infrastructure standards are creating new opportunities, particularly in energy and transportation.
  • However, the industry faces significant challenges from the persistent scarcity of specialized technical talent needed for complex tasks like system integration engineering and cyber-physical security protocols, which can delay project timelines and increase operational risk for firms unable to scale their workforces.

What will be the Size of the Engineering Services Market during the forecast period?

Get Key Insights on Market Forecast (PDF) Request Free Sample

How is the Engineering Services Market Segmented?

The engineering services industry research report provides comprehensive data (region-wise segment analysis), with forecasts and estimates in "USD billion" for the period 2026-2030, as well as historical data from 2020-2024 for the following segments.
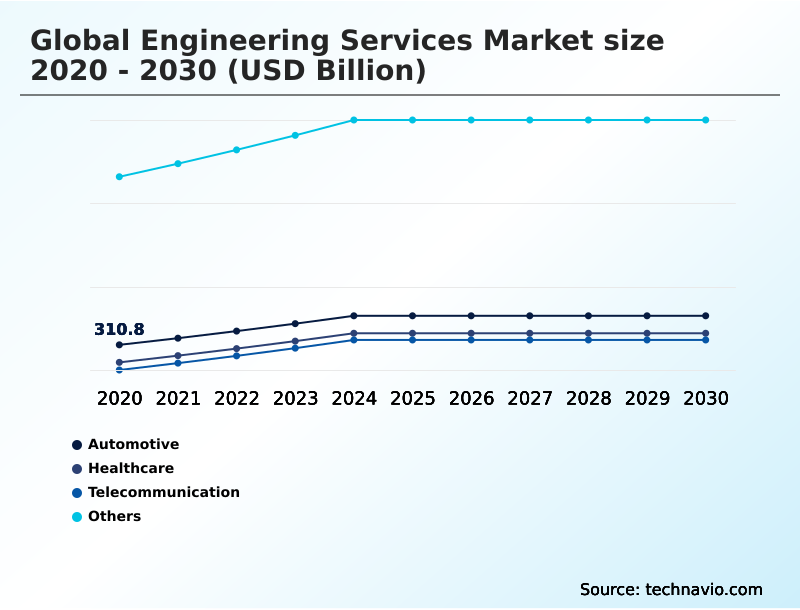
  • End-user
    • Automotive
    • Healthcare
    • Telecommunication
    • Others
  • Deployment
    • Outsourcing
    • Onsite
  • Service type
    • Product engineering
    • Process engineering
    • Others
  • Geography
    • North America
      • US
      • Canada
      • Mexico
    • Europe
      • Germany
      • UK
      • France
    • APAC
      • China
      • India
      • Japan
    • South America
      • Brazil
      • Argentina
    • Middle East and Africa
      • UAE
      • Saudi Arabia
      • South Africa
    • Rest of World (ROW)

By End-user Insights

The automotive segment is estimated to witness significant growth during the forecast period.

The automotive segment is undergoing a profound transformation as the industry pivots toward the software-defined vehicle and electrification.

This shift is driven by the integration of advanced driver-assistance systems and complex powertrains, necessitating specialized expertise in embedded systems design, power electronics design, and thermal management solutions.

OEMs are increasingly outsourcing these requirements to manage product lifecycle management and accelerate development, moving toward outcome-based service models. Demand for advanced structural modeling analysis and additive manufacturing design is also surging to support lightweighting initiatives.

This transition to digital-first development has enabled cycle-time reductions of up to 50% in certain validation processes, underscoring the critical role of specialized engineering partnerships in this evolving landscape.

Request Free Sample

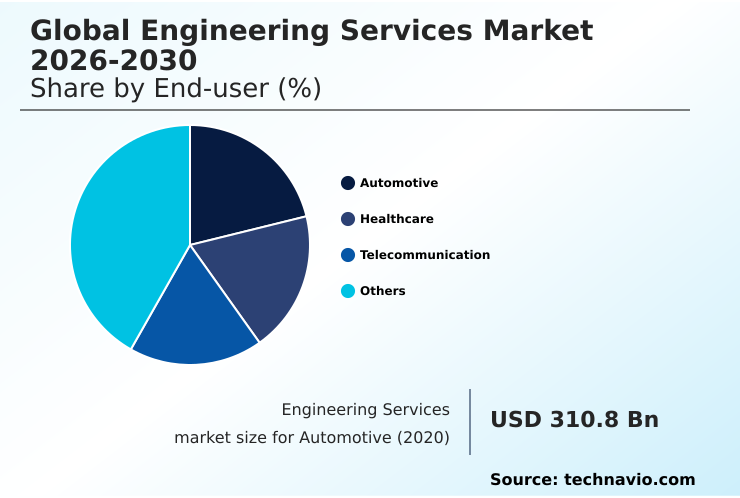
The Automotive segment was valued at USD 363.2 billion in 2024 and showed a gradual increase during the forecast period.

Request Free Sample

Regional Analysis

North America is estimated to contribute 33.8% to the growth of the global market during the forecast period.Technavio’s analysts have elaborately explained the regional trends and drivers that shape the market during the forecast period.

See How Engineering Services Market Demand is Rising in North America Request Free Sample

The market landscape is shaped by distinct regional priorities. North America leads in high-value sectors, focusing on electronic design automation and aerospace.

Europe champions smart factory integration and circular manufacturing principles, with firms leveraging augmented engineering solutions to maintain a competitive edge. The adoption of the industrial internet of things (IIoT) is widespread, improving efficiency by over 20% in some manufacturing plants.

APAC is a critical hub for both manufacturing and outsourced services, particularly for network functions virtualization and smart city infrastructure. Talent shortages remain a global issue, with critical engineering roles often staying vacant for more than 60 days.

This drives interest in advanced technologies like computational fluid dynamics and federated learning implementation to optimize limited resources across regions.

Market Dynamics

Our researchers analyzed the data with 2025 as the base year, along with the key drivers, trends, and challenges. A holistic analysis of drivers will help companies refine their marketing strategies to gain a competitive advantage.

  • The evolution of the market is profoundly shaped by the convergence of digital and physical domains, particularly with engineering services for electric mobility and the increasing use of generative ai in product engineering. This trend is exemplified by the software-defined vehicle architecture design, which relies heavily on ai-powered software engineering solutions and platform engineering for software development.
  • To manage the complexity of modern assets, the use of a digital twin for infrastructure management is becoming standard, supported by high-performance computing for simulation. Concurrently, ensuring cybersecurity for cyber-physical systems and building digital resilience for critical infrastructure are top priorities.
  • Sustainability is another core driver, fueling demand for sustainable engineering design services and the application of the circular economy in engineering design, leading to broader engineering solutions for decarbonization. Operationally, robotic process automation manufacturing and process optimization in manufacturing engineering are enhancing efficiency.
  • Firms that effectively implement predictive maintenance engineering services have reported up to a 40% reduction in unplanned equipment downtime compared to those with reactive strategies. Success in this environment requires strong interdisciplinary engineering team collaboration, the adoption of model-based systems engineering adoption, and leveraging agentic ai for design automation, while strategically managing supply chain fragmentation through outsourcing engineering r&d services.

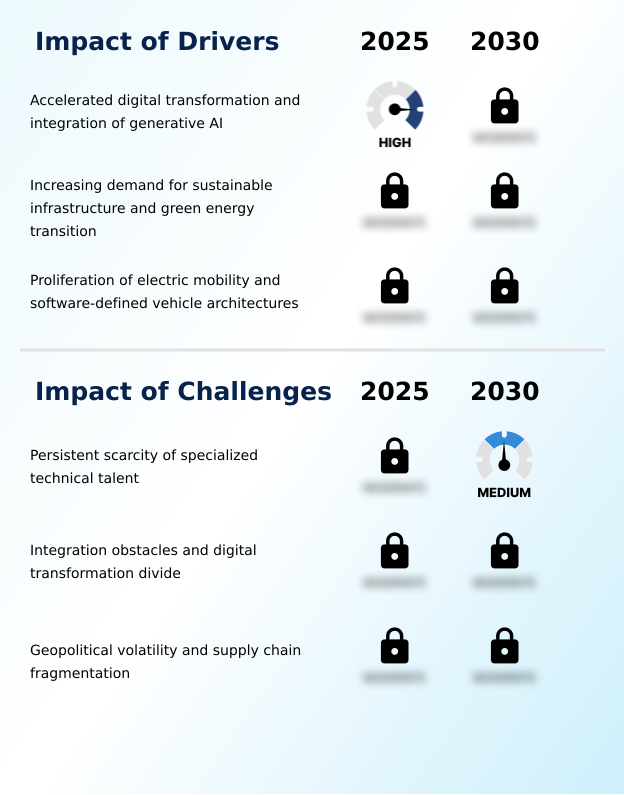
What are the key market drivers leading to the rise in the adoption of Engineering Services Industry?

  • The market's growth is primarily driven by accelerated digital transformation and the widespread integration of generative AI.

  • Accelerated adoption of digital engineering platforms and the integration of generative AI are key market drivers. These technologies enable the use of digital twins and real-time simulation tools, which can reduce development cycles by up to 50%.
  • A worldwide commitment to sustainability is also propelling growth, increasing demand for green design services that incorporate life-cycle assessment methodology and carbon capture technology.
  • This focus on decarbonization mandates adherence to new sustainable infrastructure standards, creating a surge in demand for specialized expertise.
  • The complexity of these projects is also boosting the use of high-performance computing for advanced analysis, with investments in green R&D in some sectors doubling over previous years.

What are the market trends shaping the Engineering Services Industry?

  • The market is experiencing a significant trend toward the proliferation of interdisciplinary collaboration. This shift is driven by the increasing integration of complex software systems across engineering domains.

  • A primary trend is the expansion of autonomous mobility systems and the robotic process integration into industrial environments, where agentic artificial intelligence is automating complex tasks. This requires advanced system integration engineering to connect disparate cyber-physical systems. Concurrently, the prioritization of digital security is driving the adoption of digital resilience architecture and zero-trust security frameworks to protect critical infrastructure.
  • In some markets, project abandonment rates surged over 80% due to supply chain volatility, fueling the adoption of building information modeling for better planning. Model-based systems engineering is becoming standard practice, with adoption rates among manufacturers for physical AI expected to increase by 22% as firms seek to enhance operational agility.

What challenges does the Engineering Services Industry face during its growth?

  • A persistent scarcity of specialized technical talent presents a key challenge to the industry's growth.

  • Geopolitical instability is forcing a shift from global supply chains to resilient near-shoring supply models, challenging traditional predictive program management. This volatility has caused material cost fluctuations leading to project abandonment rates increasing by as much as 88% in certain markets. Concurrently, the transition to digital-first engineering requires significant investment in technologies like computer-aided engineering and finite element analysis.
  • Firms are also pressed to adopt agile procurement processes and secure platform engineering workflows with robust cyber-physical security protocols to manage intellectual property. While over 75% of firms plan to increase hiring for roles related to network functions virtualization and software-defined networking, a persistent talent deficit remains a significant operational bottleneck.

Exclusive Technavio Analysis on Customer Landscape

The engineering services market forecasting report includes the adoption lifecycle of the market, covering from the innovator’s stage to the laggard’s stage. It focuses on adoption rates in different regions based on penetration. Furthermore, the engineering services market report also includes key purchase criteria and drivers of price sensitivity to help companies evaluate and develop their market growth analysis strategies.

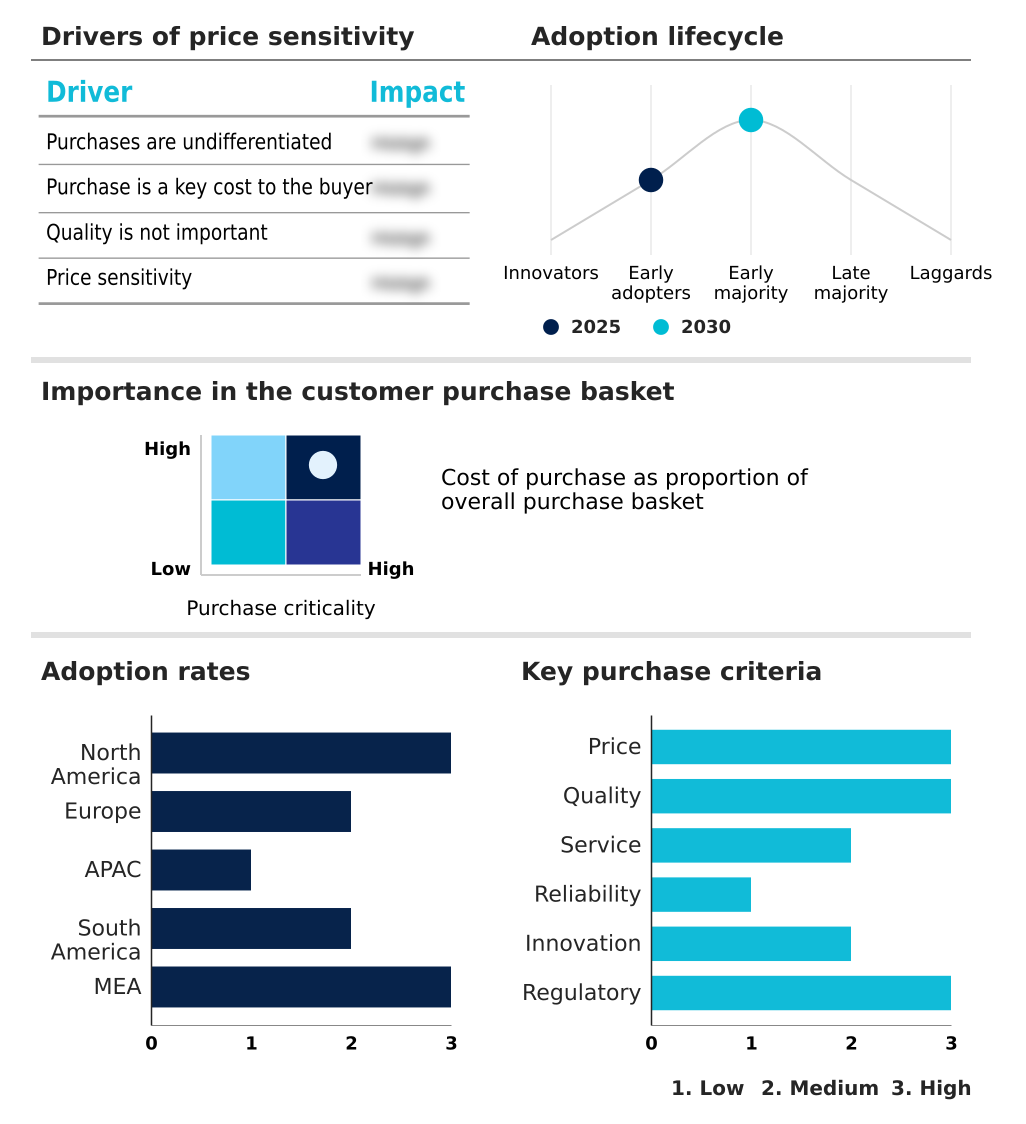
Customer Landscape of Engineering Services Industry

Competitive Landscape

Companies are implementing various strategies, such as strategic alliances, engineering services market forecast, partnerships, mergers and acquisitions, geographical expansion, and product/service launches, to enhance their presence in the industry.

AECOM - Delivers engineering solutions for complex infrastructure, energy, and environmental projects, specializing in critical assets like bridges, tunnels, and clean energy facilities.

The industry research and growth report includes detailed analyses of the competitive landscape of the market and information about key companies, including:

  • AECOM
  • AKKA Technologies SE
  • Babcock International Group Plc
  • Balfour Beatty Plc
  • Bechtel Corp.
  • Brasfield and Gorrie LLC
  • Capgemini Service SAS
  • CIMIC Group
  • Cyient Ltd.
  • Design Systems Inc.
  • EMCOR Group Inc.
  • Fluor Corp.
  • Infosys Ltd.
  • Jacobs Solutions Inc.
  • Kiewit Corp.
  • KKR BOSE DESIGN SERVICES Ltd.
  • NV5 Global Inc.
  • Tata Consultancy Services
  • TRIPLAN India Pvt. Ltd.
  • Virtuoso Projects and Engineers

Qualitative and quantitative analysis of companies has been conducted to help clients understand the wider business environment as well as the strengths and weaknesses of key industry players. Data is qualitatively analyzed to categorize companies as pure play, category-focused, industry-focused, and diversified; it is quantitatively analyzed to categorize companies as dominant, leading, strong, tentative, and weak.

Recent Development and News in Engineering services market

  • In May 2025, an Aecon-Kiewit-led consortium secured a contract worth approximately $934 million for the engineering and construction of the Darlington Small Modular Reactor in Ontario, signaling a major investment in advanced nuclear technology.
  • In April 2025, Balfour Beatty plc secured an eight hundred and thirty-three million pound contract for civil and electrical engineering works for the Net Zero Teesside Power project, reinforcing the shift toward low-carbon energy infrastructure.
  • In October 2024, Capgemini Service SAS launched a new portfolio of augmented engineering solutions that leverage generative AI to accelerate R&D cycles for manufacturing clients.
  • In September 2024, InfoBeans Technologies launched its Insane SDD Accelerator, an AI-powered software engineering solution designed to reduce production defects and improve delivery cycles by up to 50%.

Dive into Technavio’s robust research methodology, blending expert interviews, extensive data synthesis, and validated models for unparalleled Engineering Services Market insights. See full methodology.

Market Scope
Page number 299
Base year 2025
Historic period 2020-2024
Forecast period 2026-2030
Growth momentum & CAGR Accelerate at a CAGR of 4.6%
Market growth 2026-2030 USD 452.1 billion
Market structure Fragmented
YoY growth 2025-2026(%) 4.4%
Key countries US, Canada, Mexico, Germany, UK, France, Italy, Spain, The Netherlands, China, India, Japan, South Korea, Australia, Indonesia, Brazil, Argentina, Chile, UAE, Saudi Arabia, South Africa, Egypt and Turkey
Competitive landscape Leading Companies, Market Positioning of Companies, Competitive Strategies, and Industry Risks

Request Free Sample

Research Analyst Overview

  • The engineering services market is advancing through the integration of sophisticated digital tools that redefine product and infrastructure lifecycles. The use of generative AI and agentic artificial intelligence is automating complex design tasks, while digital twins provide a virtual environment for testing and validation.
  • This digital shift is critical in sectors developing the software-defined vehicle, where model-based systems engineering and advanced driver-assistance systems are standard. Core technologies like computer-aided engineering, finite element analysis, and computational fluid dynamics are powered by high-performance computing, enabling more complex structural modeling analysis.
  • In electronics, electronic design automation is key, while smart factory integration and system integration engineering are transforming manufacturing. A strategic focus on sustainability is driving the adoption of circular manufacturing principles, carbon capture technology, and green design services, with life-cycle assessment methodology demonstrating an ability to reduce environmental impact by over 25% in certain projects.
  • This requires specialized knowledge in power electronics design and thermal management solutions. Overall, success is increasingly dependent on predictive program management and delivering augmented engineering solutions that address these interconnected demands.

What are the Key Data Covered in this Engineering Services Market Research and Growth Report?

  • What is the expected growth of the Engineering Services Market between 2026 and 2030?

    • USD 452.1 billion, at a CAGR of 4.6%

  • What segmentation does the market report cover?

    • The report is segmented by End-user (Automotive, Healthcare, Telecommunication, and Others), Deployment (Outsourcing, and Onsite), Service Type (Product engineering, Process engineering, and Others) and Geography (North America, Europe, APAC, South America, Middle East and Africa)

  • Which regions are analyzed in the report?

    • North America, Europe, APAC, South America and Middle East and Africa

  • What are the key growth drivers and market challenges?

    • Accelerated digital transformation and integration of generative AI, Persistent scarcity of specialized technical talent

  • Who are the major players in the Engineering Services Market?

    • AECOM, AKKA Technologies SE, Babcock International Group Plc, Balfour Beatty Plc, Bechtel Corp., Brasfield and Gorrie LLC, Capgemini Service SAS, CIMIC Group, Cyient Ltd., Design Systems Inc., EMCOR Group Inc., Fluor Corp., Infosys Ltd., Jacobs Solutions Inc., Kiewit Corp., KKR BOSE DESIGN SERVICES Ltd., NV5 Global Inc., Tata Consultancy Services, TRIPLAN India Pvt. Ltd. and Virtuoso Projects and Engineers

Market Research Insights

  • The market is characterized by rapid shifts as firms adopt digital engineering platforms and outcome-based service models to enhance competitiveness. This transition allows for greater agility, with the adoption of agile procurement processes improving project startup times by up to 25%.
  • A focus on product lifecycle management from concept to decommissioning is becoming standard, supported by real-time simulation tools that reduce physical prototyping needs by over 40%. The strategic move toward near-shoring supply models aims to mitigate geopolitical risks, while the demand for embedded systems design surges with the proliferation of smart, connected products.
  • These dynamics create a landscape where specialization and technological proficiency are paramount for success.

We can help! Our analysts can customize this engineering services market research report to meet your requirements.

Get in touch

1. Executive Summary

1.1 Market overview

Executive Summary - Chart on Market Overview
Executive Summary - Data Table on Market Overview
Executive Summary - Chart on Global Market Characteristics
Executive Summary - Chart on Market by Geography
Executive Summary - Chart on Market Segmentation by End-user
Executive Summary - Chart on Market Segmentation by Deployment
Executive Summary - Chart on Market Segmentation by Service Type
Executive Summary - Chart on Incremental Growth
Executive Summary - Data Table on Incremental Growth
Executive Summary - Chart on Company Market Positioning

2. Technavio Analysis

2.1 Analysis of price sensitivity, lifecycle, customer purchase basket, adoption rates, and purchase criteria

2.2 Criticality of inputs and Factors of differentiation

Chart on Overview on criticality of inputs and factors of differentiation

2.3 Factors of disruption

Chart on Overview on factors of disruption

2.4 Impact of drivers and challenges

Chart on Impact of drivers and challenges in 2025 and 2030

3. Market Landscape

3.1 Market ecosystem

Chart on Parent Market
Data Table on - Parent Market

3.2 Market characteristics

Chart on Market characteristics analysis

3.3 Value chain analysis

Chart on Value chain analysis

4. Market Sizing

4.1 Market definition

Data Table on Offerings of companies included in the market definition

4.2 Market segment analysis

Market segments

4.3 Market size 2025

4.4 Market outlook: Forecast for 2025-2030

Chart on Global - Market size and forecast 2025-2030 ($ billion)
Data Table on Global - Market size and forecast 2025-2030 ($ billion)
Chart on Global Market: Year-over-year growth 2025-2030 (%)
Data Table on Global Market: Year-over-year growth 2025-2030 (%)

5. Historic Market Size

5.1 Global Engineering Services Market 2020 - 2024

Historic Market Size - Data Table on Global Engineering Services Market 2020 - 2024 ($ billion)

5.2 End-user segment analysis 2020 - 2024

Historic Market Size - End-user Segment 2020 - 2024 ($ billion)

5.3 Deployment segment analysis 2020 - 2024

Historic Market Size - Deployment Segment 2020 - 2024 ($ billion)

5.4 Service Type segment analysis 2020 - 2024

Historic Market Size - Service Type Segment 2020 - 2024 ($ billion)

5.5 Geography segment analysis 2020 - 2024

Historic Market Size - Geography Segment 2020 - 2024 ($ billion)

5.6 Country segment analysis 2020 - 2024

Historic Market Size - Country Segment 2020 - 2024 ($ billion)

6. Qualitative Analysis

6.1 Impact of AI in global engineering services market

7. Five Forces Analysis

7.1 Five forces summary

Five forces analysis - Comparison between 2025 and 2030

7.2 Bargaining power of buyers

Bargaining power of buyers - Impact of key factors 2025 and 2030

7.3 Bargaining power of suppliers

Bargaining power of suppliers - Impact of key factors in 2025 and 2030

7.4 Threat of new entrants

Threat of new entrants - Impact of key factors in 2025 and 2030

7.5 Threat of substitutes

Threat of substitutes - Impact of key factors in 2025 and 2030

7.6 Threat of rivalry

Threat of rivalry - Impact of key factors in 2025 and 2030

7.7 Market condition

Chart on Market condition - Five forces 2025 and 2030

8. Market Segmentation by End-user

8.1 Market segments

Chart on End-user - Market share 2025-2030 (%)
Data Table on End-user - Market share 2025-2030 (%)

8.2 Comparison by End-user

Chart on Comparison by End-user
Data Table on Comparison by End-user

8.3 Automotive - Market size and forecast 2025-2030

Chart on Automotive - Market size and forecast 2025-2030 ($ billion)
Data Table on Automotive - Market size and forecast 2025-2030 ($ billion)
Chart on Automotive - Year-over-year growth 2025-2030 (%)
Data Table on Automotive - Year-over-year growth 2025-2030 (%)

8.4 Healthcare - Market size and forecast 2025-2030

Chart on Healthcare - Market size and forecast 2025-2030 ($ billion)
Data Table on Healthcare - Market size and forecast 2025-2030 ($ billion)
Chart on Healthcare - Year-over-year growth 2025-2030 (%)
Data Table on Healthcare - Year-over-year growth 2025-2030 (%)

8.5 Telecommunication - Market size and forecast 2025-2030

Chart on Telecommunication - Market size and forecast 2025-2030 ($ billion)
Data Table on Telecommunication - Market size and forecast 2025-2030 ($ billion)
Chart on Telecommunication - Year-over-year growth 2025-2030 (%)
Data Table on Telecommunication - Year-over-year growth 2025-2030 (%)

8.6 Others - Market size and forecast 2025-2030

Chart on Others - Market size and forecast 2025-2030 ($ billion)
Data Table on Others - Market size and forecast 2025-2030 ($ billion)
Chart on Others - Year-over-year growth 2025-2030 (%)
Data Table on Others - Year-over-year growth 2025-2030 (%)

8.7 Market opportunity by End-user

Market opportunity by End-user ($ billion)
Data Table on Market opportunity by End-user ($ billion)

9. Market Segmentation by Deployment

9.1 Market segments

Chart on Deployment - Market share 2025-2030 (%)
Data Table on Deployment - Market share 2025-2030 (%)

9.2 Comparison by Deployment

Chart on Comparison by Deployment
Data Table on Comparison by Deployment

9.3 Outsourcing - Market size and forecast 2025-2030

Chart on Outsourcing - Market size and forecast 2025-2030 ($ billion)
Data Table on Outsourcing - Market size and forecast 2025-2030 ($ billion)
Chart on Outsourcing - Year-over-year growth 2025-2030 (%)
Data Table on Outsourcing - Year-over-year growth 2025-2030 (%)

9.4 Onsite - Market size and forecast 2025-2030

Chart on Onsite - Market size and forecast 2025-2030 ($ billion)
Data Table on Onsite - Market size and forecast 2025-2030 ($ billion)
Chart on Onsite - Year-over-year growth 2025-2030 (%)
Data Table on Onsite - Year-over-year growth 2025-2030 (%)

9.5 Market opportunity by Deployment

Market opportunity by Deployment ($ billion)
Data Table on Market opportunity by Deployment ($ billion)

10. Market Segmentation by Service Type

10.1 Market segments

Chart on Service Type - Market share 2025-2030 (%)
Data Table on Service Type - Market share 2025-2030 (%)

10.2 Comparison by Service Type

Chart on Comparison by Service Type
Data Table on Comparison by Service Type

10.3 Product engineering - Market size and forecast 2025-2030

Chart on Product engineering - Market size and forecast 2025-2030 ($ billion)
Data Table on Product engineering - Market size and forecast 2025-2030 ($ billion)
Chart on Product engineering - Year-over-year growth 2025-2030 (%)
Data Table on Product engineering - Year-over-year growth 2025-2030 (%)

10.4 Process engineering - Market size and forecast 2025-2030

Chart on Process engineering - Market size and forecast 2025-2030 ($ billion)
Data Table on Process engineering - Market size and forecast 2025-2030 ($ billion)
Chart on Process engineering - Year-over-year growth 2025-2030 (%)
Data Table on Process engineering - Year-over-year growth 2025-2030 (%)

10.5 Others - Market size and forecast 2025-2030

Chart on Others - Market size and forecast 2025-2030 ($ billion)
Data Table on Others - Market size and forecast 2025-2030 ($ billion)
Chart on Others - Year-over-year growth 2025-2030 (%)
Data Table on Others - Year-over-year growth 2025-2030 (%)

10.6 Market opportunity by Service Type

Market opportunity by Service Type ($ billion)
Data Table on Market opportunity by Service Type ($ billion)

11. Customer Landscape

11.1 Customer landscape overview

Analysis of price sensitivity, lifecycle, customer purchase basket, adoption rates, and purchase criteria

12. Geographic Landscape

12.1 Geographic segmentation

Chart on Market share by geography 2025-2030 (%)
Data Table on Market share by geography 2025-2030 (%)

12.2 Geographic comparison

Chart on Geographic comparison
Data Table on Geographic comparison

12.3 North America - Market size and forecast 2025-2030

Chart on North America - Market size and forecast 2025-2030 ($ billion)
Data Table on North America - Market size and forecast 2025-2030 ($ billion)
Chart on North America - Year-over-year growth 2025-2030 (%)
Data Table on North America - Year-over-year growth 2025-2030 (%)
Chart on Regional Comparison - North America
Data Table on Regional Comparison - North America

12.3.1 US - Market size and forecast 2025-2030

Chart on US - Market size and forecast 2025-2030 ($ billion)
Data Table on US - Market size and forecast 2025-2030 ($ billion)
Chart on US - Year-over-year growth 2025-2030 (%)
Data Table on US - Year-over-year growth 2025-2030 (%)

12.3.2 Canada - Market size and forecast 2025-2030

Chart on Canada - Market size and forecast 2025-2030 ($ billion)
Data Table on Canada - Market size and forecast 2025-2030 ($ billion)
Chart on Canada - Year-over-year growth 2025-2030 (%)
Data Table on Canada - Year-over-year growth 2025-2030 (%)

12.3.3 Mexico - Market size and forecast 2025-2030

Chart on Mexico - Market size and forecast 2025-2030 ($ billion)
Data Table on Mexico - Market size and forecast 2025-2030 ($ billion)
Chart on Mexico - Year-over-year growth 2025-2030 (%)
Data Table on Mexico - Year-over-year growth 2025-2030 (%)

12.4 Europe - Market size and forecast 2025-2030

Chart on Europe - Market size and forecast 2025-2030 ($ billion)
Data Table on Europe - Market size and forecast 2025-2030 ($ billion)
Chart on Europe - Year-over-year growth 2025-2030 (%)
Data Table on Europe - Year-over-year growth 2025-2030 (%)
Chart on Regional Comparison - Europe
Data Table on Regional Comparison - Europe

12.4.1 Germany - Market size and forecast 2025-2030

Chart on Germany - Market size and forecast 2025-2030 ($ billion)
Data Table on Germany - Market size and forecast 2025-2030 ($ billion)
Chart on Germany - Year-over-year growth 2025-2030 (%)
Data Table on Germany - Year-over-year growth 2025-2030 (%)

12.4.2 UK - Market size and forecast 2025-2030

Chart on UK - Market size and forecast 2025-2030 ($ billion)
Data Table on UK - Market size and forecast 2025-2030 ($ billion)
Chart on UK - Year-over-year growth 2025-2030 (%)
Data Table on UK - Year-over-year growth 2025-2030 (%)

12.4.3 France - Market size and forecast 2025-2030

Chart on France - Market size and forecast 2025-2030 ($ billion)
Data Table on France - Market size and forecast 2025-2030 ($ billion)
Chart on France - Year-over-year growth 2025-2030 (%)
Data Table on France - Year-over-year growth 2025-2030 (%)

12.4.4 Italy - Market size and forecast 2025-2030

Chart on Italy - Market size and forecast 2025-2030 ($ billion)
Data Table on Italy - Market size and forecast 2025-2030 ($ billion)
Chart on Italy - Year-over-year growth 2025-2030 (%)
Data Table on Italy - Year-over-year growth 2025-2030 (%)

12.4.5 Spain - Market size and forecast 2025-2030

Chart on Spain - Market size and forecast 2025-2030 ($ billion)
Data Table on Spain - Market size and forecast 2025-2030 ($ billion)
Chart on Spain - Year-over-year growth 2025-2030 (%)
Data Table on Spain - Year-over-year growth 2025-2030 (%)

12.4.6 The Netherlands - Market size and forecast 2025-2030

Chart on The Netherlands - Market size and forecast 2025-2030 ($ billion)
Data Table on The Netherlands - Market size and forecast 2025-2030 ($ billion)
Chart on The Netherlands - Year-over-year growth 2025-2030 (%)
Data Table on The Netherlands - Year-over-year growth 2025-2030 (%)

12.5 APAC - Market size and forecast 2025-2030

Chart on APAC - Market size and forecast 2025-2030 ($ billion)
Data Table on APAC - Market size and forecast 2025-2030 ($ billion)
Chart on APAC - Year-over-year growth 2025-2030 (%)
Data Table on APAC - Year-over-year growth 2025-2030 (%)
Chart on Regional Comparison - APAC
Data Table on Regional Comparison - APAC

12.5.1 China - Market size and forecast 2025-2030

Chart on China - Market size and forecast 2025-2030 ($ billion)
Data Table on China - Market size and forecast 2025-2030 ($ billion)
Chart on China - Year-over-year growth 2025-2030 (%)
Data Table on China - Year-over-year growth 2025-2030 (%)

12.5.2 India - Market size and forecast 2025-2030

Chart on India - Market size and forecast 2025-2030 ($ billion)
Data Table on India - Market size and forecast 2025-2030 ($ billion)
Chart on India - Year-over-year growth 2025-2030 (%)
Data Table on India - Year-over-year growth 2025-2030 (%)

12.5.3 Japan - Market size and forecast 2025-2030

Chart on Japan - Market size and forecast 2025-2030 ($ billion)
Data Table on Japan - Market size and forecast 2025-2030 ($ billion)
Chart on Japan - Year-over-year growth 2025-2030 (%)
Data Table on Japan - Year-over-year growth 2025-2030 (%)

12.5.4 South Korea - Market size and forecast 2025-2030

Chart on South Korea - Market size and forecast 2025-2030 ($ billion)
Data Table on South Korea - Market size and forecast 2025-2030 ($ billion)
Chart on South Korea - Year-over-year growth 2025-2030 (%)
Data Table on South Korea - Year-over-year growth 2025-2030 (%)

12.5.5 Australia - Market size and forecast 2025-2030

Chart on Australia - Market size and forecast 2025-2030 ($ billion)
Data Table on Australia - Market size and forecast 2025-2030 ($ billion)
Chart on Australia - Year-over-year growth 2025-2030 (%)
Data Table on Australia - Year-over-year growth 2025-2030 (%)

12.5.6 Indonesia - Market size and forecast 2025-2030

Chart on Indonesia - Market size and forecast 2025-2030 ($ billion)
Data Table on Indonesia - Market size and forecast 2025-2030 ($ billion)
Chart on Indonesia - Year-over-year growth 2025-2030 (%)
Data Table on Indonesia - Year-over-year growth 2025-2030 (%)

12.6 South America - Market size and forecast 2025-2030

Chart on South America - Market size and forecast 2025-2030 ($ billion)
Data Table on South America - Market size and forecast 2025-2030 ($ billion)
Chart on South America - Year-over-year growth 2025-2030 (%)
Data Table on South America - Year-over-year growth 2025-2030 (%)
Chart on Regional Comparison - South America
Data Table on Regional Comparison - South America

12.6.1 Brazil - Market size and forecast 2025-2030

Chart on Brazil - Market size and forecast 2025-2030 ($ billion)
Data Table on Brazil - Market size and forecast 2025-2030 ($ billion)
Chart on Brazil - Year-over-year growth 2025-2030 (%)
Data Table on Brazil - Year-over-year growth 2025-2030 (%)

12.6.2 Argentina - Market size and forecast 2025-2030

Chart on Argentina - Market size and forecast 2025-2030 ($ billion)
Data Table on Argentina - Market size and forecast 2025-2030 ($ billion)
Chart on Argentina - Year-over-year growth 2025-2030 (%)
Data Table on Argentina - Year-over-year growth 2025-2030 (%)

12.6.3 Chile - Market size and forecast 2025-2030

Chart on Chile - Market size and forecast 2025-2030 ($ billion)
Data Table on Chile - Market size and forecast 2025-2030 ($ billion)
Chart on Chile - Year-over-year growth 2025-2030 (%)
Data Table on Chile - Year-over-year growth 2025-2030 (%)

12.7 Middle East and Africa - Market size and forecast 2025-2030

Chart on Middle East and Africa - Market size and forecast 2025-2030 ($ billion)
Data Table on Middle East and Africa - Market size and forecast 2025-2030 ($ billion)
Chart on Middle East and Africa - Year-over-year growth 2025-2030 (%)
Data Table on Middle East and Africa - Year-over-year growth 2025-2030 (%)
Chart on Regional Comparison - Middle East and Africa
Data Table on Regional Comparison - Middle East and Africa

12.7.1 UAE - Market size and forecast 2025-2030

Chart on UAE - Market size and forecast 2025-2030 ($ billion)
Data Table on UAE - Market size and forecast 2025-2030 ($ billion)
Chart on UAE - Year-over-year growth 2025-2030 (%)
Data Table on UAE - Year-over-year growth 2025-2030 (%)

12.7.2 Saudi Arabia - Market size and forecast 2025-2030

Chart on Saudi Arabia - Market size and forecast 2025-2030 ($ billion)
Data Table on Saudi Arabia - Market size and forecast 2025-2030 ($ billion)
Chart on Saudi Arabia - Year-over-year growth 2025-2030 (%)
Data Table on Saudi Arabia - Year-over-year growth 2025-2030 (%)

12.7.3 South Africa - Market size and forecast 2025-2030

Chart on South Africa - Market size and forecast 2025-2030 ($ billion)
Data Table on South Africa - Market size and forecast 2025-2030 ($ billion)
Chart on South Africa - Year-over-year growth 2025-2030 (%)
Data Table on South Africa - Year-over-year growth 2025-2030 (%)

12.7.4 Egypt - Market size and forecast 2025-2030

Chart on Egypt - Market size and forecast 2025-2030 ($ billion)
Data Table on Egypt - Market size and forecast 2025-2030 ($ billion)
Chart on Egypt - Year-over-year growth 2025-2030 (%)
Data Table on Egypt - Year-over-year growth 2025-2030 (%)

12.7.5 Turkey - Market size and forecast 2025-2030

Chart on Turkey - Market size and forecast 2025-2030 ($ billion)
Data Table on Turkey - Market size and forecast 2025-2030 ($ billion)
Chart on Turkey - Year-over-year growth 2025-2030 (%)
Data Table on Turkey - Year-over-year growth 2025-2030 (%)

12.8 Market opportunity by geography

Market opportunity by geography ($ billion)
Data Tables on Market opportunity by geography ($ billion)

13. Drivers, Challenges, and Opportunity

13.1 Market drivers

Accelerated digital transformation and integration of generative AI
Increasing demand for sustainable infrastructure and green energy transition
Proliferation of electric mobility and software-defined vehicle architectures

13.2 Market challenges

Persistent scarcity of specialized technical talent
Integration obstacles and digital transformation divide
Geopolitical volatility and supply chain fragmentation

13.3 Impact of drivers and challenges

Impact of drivers and challenges in 2025 and 2030

13.4 Market opportunities

Proliferation of interdisciplinary collaboration and software systems
Expansion of autonomous mobility and robotic process integration
Prioritization of digital resilience and cyber-physical security

14. Competitive Landscape

14.1 Overview

14.2

Overview on criticality of inputs and factors of differentiation

14.3 Landscape disruption

Overview on factors of disruption

14.4 Industry risks

Impact of key risks on business

15. Competitive Analysis

15.1 Companies profiled

Companies covered

15.2 Company ranking index

15.3 Market positioning of companies

Matrix on companies position and classification

15.4 AECOM

AECOM - Overview
AECOM - Business segments
AECOM - Key news
AECOM - Key offerings
AECOM - Segment focus
SWOT

15.5 AKKA Technologies SE

AKKA Technologies SE - Overview
AKKA Technologies SE - Product / Service
AKKA Technologies SE - Key offerings
SWOT

15.6 Babcock International Group Plc

Babcock International Group Plc - Overview
Babcock International Group Plc - Business segments
Babcock International Group Plc - Key news
Babcock International Group Plc - Key offerings
Babcock International Group Plc - Segment focus
SWOT

15.7 Balfour Beatty Plc

Balfour Beatty Plc - Overview
Balfour Beatty Plc - Business segments
Balfour Beatty Plc - Key offerings
Balfour Beatty Plc - Segment focus
SWOT

15.8 Bechtel Corp.

Bechtel Corp. - Overview
Bechtel Corp. - Product / Service
Bechtel Corp. - Key news
Bechtel Corp. - Key offerings
SWOT

15.9 Capgemini Service SAS

Capgemini Service SAS - Overview
Capgemini Service SAS - Business segments
Capgemini Service SAS - Key news
Capgemini Service SAS - Key offerings
Capgemini Service SAS - Segment focus
SWOT

15.10 CIMIC Group

CIMIC Group - Overview
CIMIC Group - Product / Service
CIMIC Group - Key offerings
SWOT

15.11 Cyient Ltd.

Cyient Ltd. - Overview
Cyient Ltd. - Business segments
Cyient Ltd. - Key offerings
Cyient Ltd. - Segment focus
SWOT

15.12 Design Systems Inc.

Design Systems Inc. - Overview
Design Systems Inc. - Product / Service
Design Systems Inc. - Key offerings
SWOT

15.13 EMCOR Group Inc.

EMCOR Group Inc. - Overview
EMCOR Group Inc. - Business segments
EMCOR Group Inc. - Key offerings
EMCOR Group Inc. - Segment focus
SWOT

15.14 Infosys Ltd.

Infosys Ltd. - Overview
Infosys Ltd. - Business segments
Infosys Ltd. - Key news
Infosys Ltd. - Key offerings
Infosys Ltd. - Segment focus
SWOT

15.15 Jacobs Solutions Inc.

Jacobs Solutions Inc. - Overview
Jacobs Solutions Inc. - Product / Service
Jacobs Solutions Inc. - Key offerings
SWOT

15.16 Kiewit Corp.

Kiewit Corp. - Overview
Kiewit Corp. - Product / Service
Kiewit Corp. - Key offerings
SWOT

15.17 NV5 Global Inc.

NV5 Global Inc. - Overview
NV5 Global Inc. - Business segments
NV5 Global Inc. - Key offerings
NV5 Global Inc. - Segment focus
SWOT

15.18 Tata Consultancy Services

Tata Consultancy Services - Overview
Tata Consultancy Services - Business segments
Tata Consultancy Services - Key news
Tata Consultancy Services - Key offerings
Tata Consultancy Services - Segment focus
SWOT

16. Appendix

16.1 Scope of the report

Market definition
Objectives
Notes and caveats

16.2 Inclusions and exclusions checklist

Inclusions checklist
Exclusions checklist

16.3 Currency conversion rates for US$

16.4 Research methodology

16.5 Data procurement

Information sources

16.6 Data validation

16.7 Validation techniques employed for market sizing

16.8 Data synthesis

16.9 360 degree market analysis

16.10 List of abbreviations

Research Methodology

Technavio presents a detailed picture of the market by way of study, synthesis, and summation of data from multiple sources. The analysts have presented the various facets of the market with a particular focus on identifying the key industry influencers. The data thus presented is comprehensive, reliable, and the result of extensive research, both primary and secondary.

INFORMATION SOURCES

Primary sources

  • Manufacturers and suppliers
  • Channel partners
  • Industry experts
  • Strategic decision makers

Secondary sources

  • Industry journals and periodicals
  • Government data
  • Financial reports of key industry players
  • Historical data
  • Press releases

DATA ANALYSIS

Data Synthesis

  • Collation of data
  • Estimation of key figures
  • Analysis of derived insights

Data Validation

  • Triangulation with data models
  • Reference against proprietary databases
  • Corroboration with industry experts

REPORT WRITING

Qualitative

  • Market drivers
  • Market challenges
  • Market trends
  • Five forces analysis

Quantitative

  • Market size and forecast
  • Market segmentation
  • Geographical insights
  • Competitive landscape

Interested in this report?

Get your sample now to see our research methodology and insights!

Download Now

Frequently Asked Questions

Engineering Services market growth will increase by USD 452.1 billion during 2026-2030.

The Engineering Services market is expected to grow at a CAGR of 4.6% during 2026-2030.

Engineering Services market is segmented by End-user (Automotive, Healthcare, Telecommunication, Others) Deployment (Outsourcing, Onsite) Service type (Product engineering, Process engineering, Others)

AECOM, AKKA Technologies SE, Babcock International Group Plc, Balfour Beatty Plc, Bechtel Corp., Brasfield and Gorrie LLC, Capgemini Service SAS, CIMIC Group, Cyient Ltd., Design Systems Inc., EMCOR Group Inc., Fluor Corp., Infosys Ltd., Jacobs Solutions Inc., Kiewit Corp., KKR BOSE DESIGN SERVICES Ltd., NV5 Global Inc., Tata Consultancy Services, TRIPLAN India Pvt. Ltd., Virtuoso Projects and Engineers are a few of the key vendors in the Engineering Services market.

North America will register the highest growth rate of 33.8% among the other regions. Therefore, the Engineering Services market in North America is expected to garner significant business opportunities for the vendors during the forecast period.

US, Canada, Mexico, Germany, UK, France, Italy, Spain, The Netherlands, China, India, Japan, South Korea, Australia, Indonesia, Brazil, Argentina, Chile, UAE, Saudi Arabia, South Africa, Egypt, Turkey

  • Accelerated digital transformation and integration of generative AI is the driving factor this market.

The Engineering Services market vendors should focus on grabbing business opportunities from the End-user segment as it accounted for the largest market share in the base year.