Enterprise Mobile Application Development Services Market Analysis North America, Europe, APAC, South America, Middle East and Africa - US, China, Japan, UK, Germany - Size and Forecast 2024-2028

Enterprise Mobile Application Development Services Market Analysis North America, Europe, APAC, South America, Middle East and Africa - US, China, Japan, UK, Germany - Size and Forecast 2024-2028

Published: Apr 2024 185 Pages SKU: IRTNTR77886

Market Overview at a Glance

$250.71 B
Market Opportunity
25.54%
CAGR
22.36
YoY growth 2023-2024(%)

Enterprise Mobile Application Development Services Market Size 2024-2028

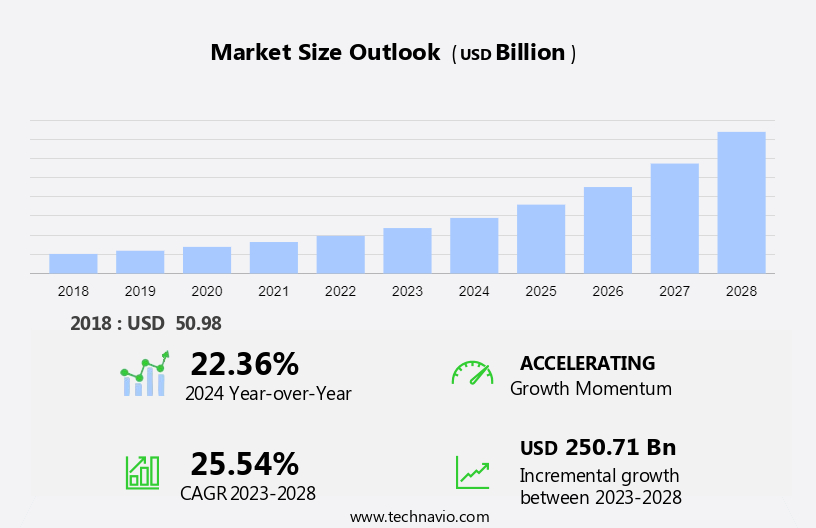
The enterprise mobile application development services market size is forecast to increase by USD 250.71 billion, at a CAGR of 25.54% between 2023 and 2028.

  • The market is experiencing significant growth, driven by several key trends. The increasing demand for cloud-native development solutions is a major growth factor, as businesses seek to leverage the benefits of agility, scalability, and cost savings. Another trend is the rise of hybrid application integration technology, which enables seamless integration of mobile applications with enterprise systems and data. The market is witnessing a rise in demand for app development services for connected gadgets, including wearable devices and IoT devices, as well as for mobile applications in sectors such as smart homes and the mobile workforce. Additionally, device fragmentation and application performance optimization issues continue to challenge developers, necessitating innovative solutions to ensure optimal user experience. Overall, these trends are shaping the market and driving demand for advanced, integrated, and high-performing mobile solutions.

What will be the Size of the Enterprise Mobile Application Development Services Market During the Forecast Period?

Enterprise Mobile Application Development Services Market Size

 Request Free Sample

  • The market is experiencing strong growth, fueled by the increasing adoption of mobile technology among businesses worldwide. With the proliferation of smartphones, mobility has become a key driver for digital transformation, enabling mobile enterprise applications to streamline business processes and enhance interaction with customers. The integration of mobile technology with cloud-based services, broadband, and wireless technology is further expanding the market's potential. mobile phone users and businesses are increasingly relying on mobile applications for productivity, communication, and brand engagement, making app makers an essential partner for organizations undergoing digital transformation. The market's size is significant and continues to grow, as mobile technology becomes an integral part of business operations and strategies.

How is this Enterprise Mobile Application Development Services Industry segmented and which is the largest segment?

The enterprise mobile application development services industry research report provides comprehensive data (region-wise segment analysis), with forecasts and estimates in "USD billion" for the period 2024-2028, as well as historical data from 2018-2022 for the following segments.

  • Application
    • Large enterprises
    • SMEs
  • Platform
    • Native
    • Hybrid
    • Web
  • Geography
    • North America
      • US
    • Europe
      • Germany
      • UK
    • APAC
      • China
      • Japan
    • South America
    • Middle East and Africa

By Application Insights

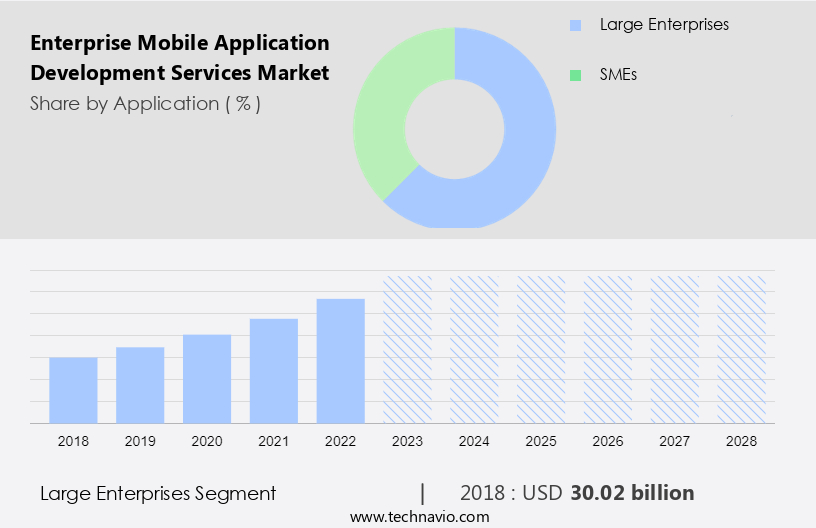
  • The large enterprises segment is estimated to witness significant growth during the forecast period.

Enterprises are accelerating their digital transformation initiatives, integrating mobile applications to modernize business processes, boost efficiency, and enhance customer experiences. Mobile technology, including smartphones, mobility, mobile phones, tablets, and wearable devices, is revolutionizing business operations. mobile apps facilitate real-time interaction, enabling enterprises to engage customers, deliver personalized content, and provide seamless omnichannel experiences.

Applications cater to various industries such as IT & telecommunication, healthcare & life sciences, manufacturing & automotive, and media & entertainment, among others. Enterprise mobile application development services, like those offered by Tech Mahindra Ltd., enable businesses to leverage platforms like OutSystems for low-code development, mobile application development, high productivity PaaS, and multi-experience development. These services ensure cross-platform compatibility, address data security concerns, and provide cloud-based services, including web-based and hybrid applications. Mobile applications are integral to digital transformation, driving business growth and innovation.

Enterprise Mobile Application Development Services Market Size

Get a glance at the Enterprise Mobile Application Development Services Industry report of share of various segments Request Free Sample

The large enterprises segment was valued at USD 30.02 billion in 2018 and showed a gradual increase during the forecast period.

Regional Analysis

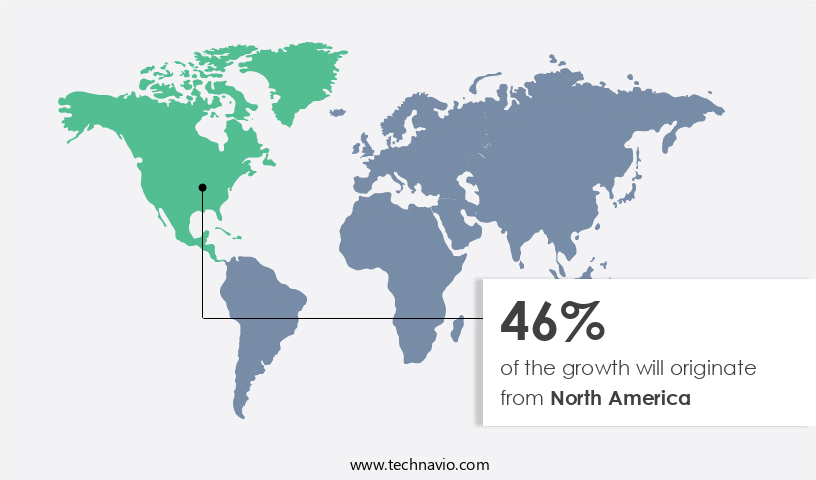
  • North America is estimated to contribute 46% to the growth of the global market during the forecast period.

Technavio's analysts have elaborately explained the regional trends and drivers that shape the market during the forecast period.

Enterprise Mobile Application Development Services Market Share by Geography

For more insights on the market share of various regions, Request Free Sample

In North America, the prevalence of smartphones and mobile Internet usage is substantial, fueling a significant demand for enterprise mobile applications. These applications serve to enhance communication, collaboration, and productivity for businesses in various sectors. The region's industries are undergoing digital transformation to maintain competitiveness and cater to evolving customer needs. Mobile applications play a crucial role in this process, enabling modernization, increased efficiency, and enhanced customer and employee experiences. Furthermore, North America's technological innovation hub status, driven by advancements in cloud computing, artificial intelligence, and the Internet of Things (IoT), fosters the creation of sophisticated mobile applications.

Enterprise mobile applications facilitate business automation solutions, including human capital management, accounting and finance, supply chain management, customer relationship management, machine learning, communication and collaboration, enterprise resource planning, e-commerce, business analytics, transport & logistics, manufacturing & automotive, energy & utilities, media & entertainment, and healthcare & life sciences. Cloud-based services, mobile phone users, tablets, and PCs are integral to these applications, which interact with web-based services, native, and hybrid applications, and various operating systems such as iOS, Android, and Windows. Data security concerns and cross-platform implementation complexities are addressed through consulting skills and advanced technologies like artificial intelligence and generative AI.

Market Dynamics

Our researchers analyzed the data with 2023 as the base year, along with the key drivers, trends, and challenges. A holistic analysis of drivers will help companies refine their marketing strategies to gain a competitive advantage.

What are the key market drivers leading to the rise In the adoption of Enterprise Mobile Application Development Services Industry?

Growing demand for cloud-native development is the key driver of the market.

  • Cloud-native mobile application development refers to constructing and deploying apps that utilize cloud computing infrastructure, services, and architectures for scalable, resilient, and agile solutions. This approach allows mobile applications to adapt to varying user traffic and workloads without downtime or performance concerns. Enterprises opt for cloud-native mobile app development services to capitalize on cloud platforms' flexibility and scalability, ensuring applications can manage growth and adapt to evolving business requirements. Furthermore, cloud-native development expedites the app development process through agile methodologies, automated deployment pipelines, and DevOps practices. Cloud-native mobile apps cater to diverse industries, including IT & telecommunication, healthcare & life sciences, and media & entertainment, among others.
  • Applications for human capital management, accounting and finance, supply chain management, customer relationship management, and enterprise resource planning are popular use cases. Additionally, cloud-native development supports the development of cross-platform applications, online shopping apps, social networking, games apps, and business automation solutions. Cloud-native mobile app development addresses data security concerns through strong security measures and web-based services. It also supports machine learning, communication and collaboration, and business analytics. Wearable devices, IoT devices, and smart home applications are increasingly integrated into cloud-native mobile app development, further expanding its reach and utility.

What are the market trends shaping the Enterprise Mobile Application Development Services Industry?

The rise of hybrid application integration technology is the upcoming market trend.

  • Hybrid application integration technology is gaining significance in today's organizations as they adopt both on-premises and cloud-based enterprise mobile applications. The integration of diverse organizational applications and systems presents complexities and data security concerns, necessitating advanced integration platforms. Traditional integration solutions face challenges due to the frequent alterations in enterprise systems across industries. Consequently, there is a growing demand for hybrid integration platforms that combine conventional integration tools with new technologies like API management software, iPaaS, and iSaaS. These advanced solutions facilitate seamless interaction between business processes on different operating systems, such as iOS, Android, and Windows. The integration of mobile technologies, including smartphones, mobility, mobile apps, wearable devices, IoT devices, and connected gadgets, is transforming industries like human capital management, accounting and finance, supply chain management, customer relationship management, machine learning, communication and collaboration, enterprise resource planning, eCommerce, business analytics, transport & logistics, manufacturing & automotive, energy & utilities, media & entertainment, and healthcare & life sciences.

What challenges does the Enterprise Mobile Application Development Services Industry face during its growth?

Device fragmentation and application performance optimization issues is a key challenge affecting the industry growth.

  • The market is driven by the increasing use of smartphones and mobility in business processes. Connected gadgets, including mobile phones, tablets, wearable devices, and IoT devices, have become essential tools for business automation solutions, online shopping apps, social networking, games apps, and more. Mobile technology, including wireless technology, broadband services, cloud-based services, and internet services, has become integral to IT & Telecommunication and various industries such as human capital management, accounting and finance, supply chain management, customer relationship management, machine learning, communication and collaboration, enterprise resource planning, eCommerce, business analytics, transport & logistics, manufacturing & automotive, energy & utilities, media & entertainment, healthcare & life sciences, and more.
  • App makers face complexities in implementing cross-platform mobile applications due to varying hardware specifications, screen sizes, resolutions, and operating systems (iOS, Android, Windows). For instance, Android mobile phones face challenges related to OS version compatibility, feature support, and platform-specific optimizations, making it difficult to create consistent experiences across devices. In addition, data security concerns and web-based services further complicate the development process. companies must possess consulting skills, artificial intelligence, creative advertising, visual brand expression, generative AI, and other advanced technologies to meet the demands of businesses In the digital transformation era.

Exclusive Customer Landscape

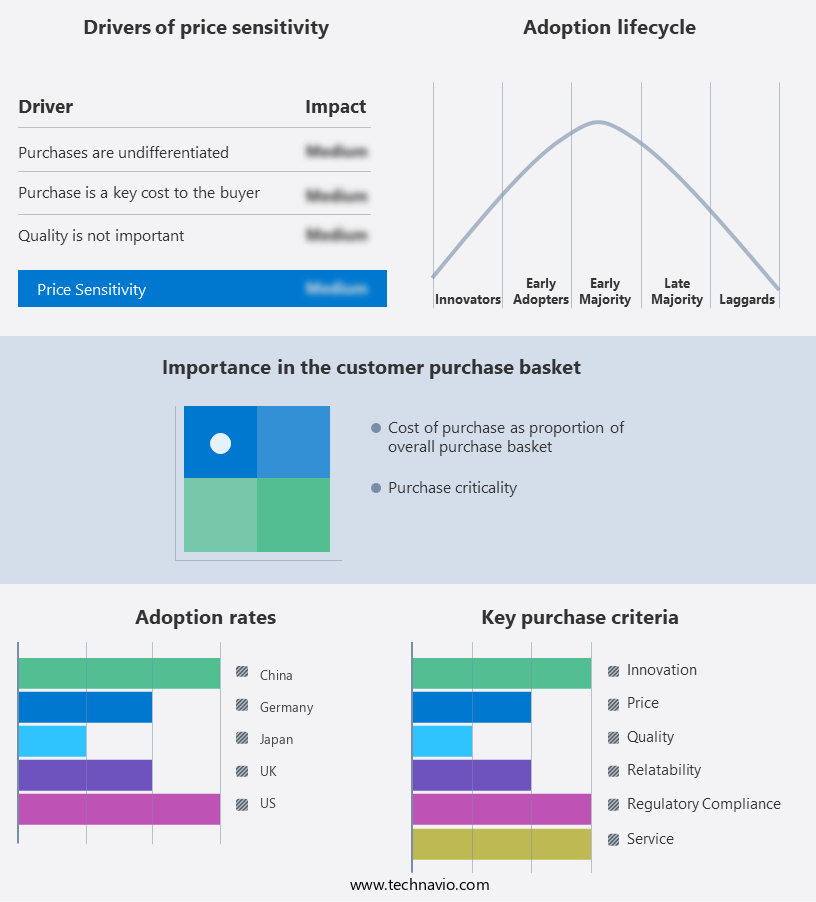
The enterprise mobile application development services market forecasting report includes the adoption lifecycle of the market, covering from the innovator's stage to the laggard's stage. It focuses on adoption rates in different regions based on penetration. Furthermore, the enterprise mobile application development services market report also includes key purchase criteria and drivers of price sensitivity to help companies evaluate and develop their market growth analysis strategies.

Enterprise Mobile Application Development Services Market Share by Geography

 Customer Landscape

Key Companies & Market Insights

Companies are implementing various strategies, such as strategic alliances, enterprise mobile application development services market forecast, partnerships, mergers and acquisitions, geographical expansion, and product/service launches, to enhance their presence In the industry.

The industry research and growth report includes detailed analyses of the competitive landscape of the market and information about key companies, including:

  • Accenture Plc
  • Atos SE
  • Capgemini Service SAS
  • CGI Inc.
  • Cognizant Technology Solutions Corp.
  • Deloitte Touche Tohmatsu Ltd.
  • DXC Technology Co.
  • HCL Technologies Ltd.
  • Hexaware Technologies Ltd.
  • Infosys Ltd.
  • International Business Machines Corp.
  • ITC Ltd.
  • Larsen and Toubro Ltd.
  • Netguru S.A
  • PricewaterhouseCoopers LLP
  • Siemens AG
  • Tata Consultancy Services Ltd.
  • Tech Mahindra Ltd.
  • Virtusa Corp.
  • Wipro Ltd.
  • Zensar Technologies Inc.

Qualitative and quantitative analysis of companies has been conducted to help clients understand the wider business environment as well as the strengths and weaknesses of key industry players. Data is qualitatively analyzed to categorize companies as pure play, category-focused, industry-focused, and diversified; it is quantitatively analyzed to categorize companies as dominant, leading, strong, tentative, and weak.

Research Analyst Overview

Enterprise mobile application development services have gained significant traction in today's digital landscape, driven by the increasing adoption of mobility solutions in various industries. The proliferation of smartphones and connected gadgets, including wearable devices and IoT devices, has led to a rise in demand for mobile applications that enable business automation, online shopping, social networking, and entertainment. The IT and telecommunication sector has been a key player in this market, providing consulting skills and expertise to help businesses navigate the complexities of mobile enterprise application development. These services encompass the development of applications for mobile workforces, as well as the integration of artificial intelligence, creative advertising, and visual brand expression into mobile applications.

Further, the use of mobile technology in business processes has led to a digital transformation, with businesses seeking to improve interaction with their customers, streamline operations, and enhance productivity. Mobile applications have become essential tools for human capital management, accounting and finance, supply chain management, customer relationship management, and enterprise resource planning. The adoption of cloud-based services, including global hybrid clouds, has also played a significant role In the growth of enterprise mobile application development services. These services enable businesses to leverage machine learning and communication and collaboration tools to enhance their mobile applications and improve their overall digital strategy.

However, the market for enterprise mobile application development services is not without its challenges. Cross-platform implementation complexities and data security concerns continue to pose challenges for developers. The use of web-based services and the integration of mobile applications with IoT devices and smart home systems add to the complexity of mobile application development. Despite these challenges, the market for enterprise mobile application development services is expected to continue growing, driven by the increasing use of mobile technology in various industries and the need for businesses to remain competitive In the digital landscape. The integration of emerging technologies, such as generative AI, into mobile applications is also expected to drive innovation and growth In the market.

Market Scope

Report Coverage

Details

Page number

185

Base year

2023

Historic period

2018-2022

Forecast period

2024-2028

Growth momentum & CAGR

Accelerate at a CAGR of 25.54%

Market Growth 2024-2028

USD 250.71 billion

Market structure

Fragmented

YoY growth 2023-2024(%)

22.36

Key countries

US, China, Japan, UK, and Germany

Competitive landscape

Leading Companies, Market Positioning of Companies, Competitive Strategies, and Industry Risks

Request Free Sample

What are the Key Data Covered in this Enterprise Mobile Application Development Services Market Research and Growth Report?

  • CAGR of the Enterprise Mobile Application Development Services industry during the forecast period
  • Detailed information on factors that will drive the market growth and forecasting between 2024 and 2028
  • Precise estimation of the size of the market and its contribution of the industry in focus to the parent market
  • Accurate predictions about upcoming growth and trends and changes in consumer behaviour
  • Growth of the market across North America, Europe, APAC, South America, and Middle East and Africa
  • Thorough analysis of the market's competitive landscape and detailed information about companies
  • Comprehensive analysis of factors that will challenge the enterprise mobile application development services market growth of industry companies

We can help! Our analysts can customize this enterprise mobile application development services market research report to meet your requirements.

Get in touch

1 Executive Summary

  • 1.1 Market overview
    • Exhibit 01: Executive Summary – Chart on Market Overview
    • Exhibit 02: Executive Summary – Data Table on Market Overview
    • Exhibit 03: Executive Summary – Chart on Global Market Characteristics
    • Exhibit 04: Executive Summary – Chart on Market by Geography
    • Exhibit 05: Executive Summary – Chart on Market Segmentation by Application
    • Exhibit 06: Executive Summary – Chart on Market Segmentation by Platform
    • Exhibit 07: Executive Summary – Chart on Incremental Growth
    • Exhibit 08: Executive Summary – Data Table on Incremental Growth
    • Exhibit 09: Executive Summary – Chart on Vendor Market Positioning

2 Market Landscape

  • 2.1 Market ecosystem
    • Exhibit 10: Parent market
    • Exhibit 11: Market Characteristics

3 Market Sizing

  • 3.1 Market definition
    • Exhibit 12: Offerings of vendors included in the market definition
  • 3.2 Market segment analysis
    • Exhibit 13: Market segments
  • 3.3 Market size 2023
    • 3.4 Market outlook: Forecast for 2023-2028
      • Exhibit 14: Chart on Global - Market size and forecast 2023-2028 ($ billion)
      • Exhibit 15: Data Table on Global - Market size and forecast 2023-2028 ($ billion)
      • Exhibit 16: Chart on Global Market: Year-over-year growth 2023-2028 (%)
      • Exhibit 17: Data Table on Global Market: Year-over-year growth 2023-2028 (%)

    4 Historic Market Size

    • 4.1 Global enterprise mobile application development services market 2018 - 2022
      • Exhibit 18: Historic Market Size – Data Table on global enterprise mobile application development services market 2018 - 2022 ($ billion)
    • 4.2 Application Segment Analysis 2018 - 2022
      • Exhibit 19: Historic Market Size – Application Segment 2018 - 2022 ($ billion)
    • 4.3 Platform Segment Analysis 2018 - 2022
      • Exhibit 20: Historic Market Size – Platform Segment 2018 - 2022 ($ billion)
    • 4.4 Geography Segment Analysis 2018 - 2022
      • Exhibit 21: Historic Market Size – Geography Segment 2018 - 2022 ($ billion)
    • 4.5 Country Segment Analysis 2018 - 2022
      • Exhibit 22: Historic Market Size – Country Segment 2018 - 2022 ($ billion)

    5 Five Forces Analysis

    • 5.1 Five forces summary
      • Exhibit 23: Five forces analysis - Comparison between 2023 and 2028
    • 5.2 Bargaining power of buyers
      • Exhibit 24: Chart on Bargaining power of buyers – Impact of key factors 2023 and 2028
    • 5.3 Bargaining power of suppliers
      • Exhibit 25: Bargaining power of suppliers – Impact of key factors in 2023 and 2028
    • 5.4 Threat of new entrants
      • Exhibit 26: Threat of new entrants – Impact of key factors in 2023 and 2028
    • 5.5 Threat of substitutes
      • Exhibit 27: Threat of substitutes – Impact of key factors in 2023 and 2028
    • 5.6 Threat of rivalry
      • Exhibit 28: Threat of rivalry – Impact of key factors in 2023 and 2028
    • 5.7 Market condition
      • Exhibit 29: Chart on Market condition - Five forces 2023 and 2028

    6 Market Segmentation by Application

    • 6.1 Market segments
      • Exhibit 30: Chart on Application - Market share 2023-2028 (%)
      • Exhibit 31: Data Table on Application - Market share 2023-2028 (%)
    • 6.2 Comparison by Application
      • Exhibit 32: Chart on Comparison by Application
      • Exhibit 33: Data Table on Comparison by Application
    • 6.3 Large enterprises - Market size and forecast 2023-2028
      • Exhibit 34: Chart on Large enterprises - Market size and forecast 2023-2028 ($ billion)
      • Exhibit 35: Data Table on Large enterprises - Market size and forecast 2023-2028 ($ billion)
      • Exhibit 36: Chart on Large enterprises - Year-over-year growth 2023-2028 (%)
      • Exhibit 37: Data Table on Large enterprises - Year-over-year growth 2023-2028 (%)
    • 6.4 SMEs - Market size and forecast 2023-2028
      • Exhibit 38: Chart on SMEs - Market size and forecast 2023-2028 ($ billion)
      • Exhibit 39: Data Table on SMEs - Market size and forecast 2023-2028 ($ billion)
      • Exhibit 40: Chart on SMEs - Year-over-year growth 2023-2028 (%)
      • Exhibit 41: Data Table on SMEs - Year-over-year growth 2023-2028 (%)
    • 6.5 Market opportunity by Application
      • Exhibit 42: Market opportunity by Application ($ billion)
      • Exhibit 43: Data Table on Market opportunity by Application ($ billion)

    7 Market Segmentation by Platform

    • 7.1 Market segments
      • Exhibit 44: Chart on Platform - Market share 2023-2028 (%)
      • Exhibit 45: Data Table on Platform - Market share 2023-2028 (%)
    • 7.2 Comparison by Platform
      • Exhibit 46: Chart on Comparison by Platform
      • Exhibit 47: Data Table on Comparison by Platform
    • 7.3 Native - Market size and forecast 2023-2028
      • Exhibit 48: Chart on Native - Market size and forecast 2023-2028 ($ billion)
      • Exhibit 49: Data Table on Native - Market size and forecast 2023-2028 ($ billion)
      • Exhibit 50: Chart on Native - Year-over-year growth 2023-2028 (%)
      • Exhibit 51: Data Table on Native - Year-over-year growth 2023-2028 (%)
    • 7.4 Hybrid - Market size and forecast 2023-2028
      • Exhibit 52: Chart on Hybrid - Market size and forecast 2023-2028 ($ billion)
      • Exhibit 53: Data Table on Hybrid - Market size and forecast 2023-2028 ($ billion)
      • Exhibit 54: Chart on Hybrid - Year-over-year growth 2023-2028 (%)
      • Exhibit 55: Data Table on Hybrid - Year-over-year growth 2023-2028 (%)
    • 7.5 Web - Market size and forecast 2023-2028
      • Exhibit 56: Chart on Web - Market size and forecast 2023-2028 ($ billion)
      • Exhibit 57: Data Table on Web - Market size and forecast 2023-2028 ($ billion)
      • Exhibit 58: Chart on Web - Year-over-year growth 2023-2028 (%)
      • Exhibit 59: Data Table on Web - Year-over-year growth 2023-2028 (%)
    • 7.6 Market opportunity by Platform
      • Exhibit 60: Market opportunity by Platform ($ billion)
      • Exhibit 61: Data Table on Market opportunity by Platform ($ billion)

    8 Customer Landscape

    • 8.1 Customer landscape overview
      • Exhibit 62: Analysis of price sensitivity, lifecycle, customer purchase basket, adoption rates, and purchase criteria

    9 Geographic Landscape

    • 9.1 Geographic segmentation
      • Exhibit 63: Chart on Market share by geography 2023-2028 (%)
      • Exhibit 64: Data Table on Market share by geography 2023-2028 (%)
    • 9.2 Geographic comparison
      • Exhibit 65: Chart on Geographic comparison
      • Exhibit 66: Data Table on Geographic comparison
    • 9.3 North America - Market size and forecast 2023-2028
      • Exhibit 67: Chart on North America - Market size and forecast 2023-2028 ($ billion)
      • Exhibit 68: Data Table on North America - Market size and forecast 2023-2028 ($ billion)
      • Exhibit 69: Chart on North America - Year-over-year growth 2023-2028 (%)
      • Exhibit 70: Data Table on North America - Year-over-year growth 2023-2028 (%)
    • 9.4 Europe - Market size and forecast 2023-2028
      • Exhibit 71: Chart on Europe - Market size and forecast 2023-2028 ($ billion)
      • Exhibit 72: Data Table on Europe - Market size and forecast 2023-2028 ($ billion)
      • Exhibit 73: Chart on Europe - Year-over-year growth 2023-2028 (%)
      • Exhibit 74: Data Table on Europe - Year-over-year growth 2023-2028 (%)
    • 9.5 APAC - Market size and forecast 2023-2028
      • Exhibit 75: Chart on APAC - Market size and forecast 2023-2028 ($ billion)
      • Exhibit 76: Data Table on APAC - Market size and forecast 2023-2028 ($ billion)
      • Exhibit 77: Chart on APAC - Year-over-year growth 2023-2028 (%)
      • Exhibit 78: Data Table on APAC - Year-over-year growth 2023-2028 (%)
    • 9.6 South America - Market size and forecast 2023-2028
      • Exhibit 79: Chart on South America - Market size and forecast 2023-2028 ($ billion)
      • Exhibit 80: Data Table on South America - Market size and forecast 2023-2028 ($ billion)
      • Exhibit 81: Chart on South America - Year-over-year growth 2023-2028 (%)
      • Exhibit 82: Data Table on South America - Year-over-year growth 2023-2028 (%)
    • 9.7 Middle East and Africa - Market size and forecast 2023-2028
      • Exhibit 83: Chart on Middle East and Africa - Market size and forecast 2023-2028 ($ billion)
      • Exhibit 84: Data Table on Middle East and Africa - Market size and forecast 2023-2028 ($ billion)
      • Exhibit 85: Chart on Middle East and Africa - Year-over-year growth 2023-2028 (%)
      • Exhibit 86: Data Table on Middle East and Africa - Year-over-year growth 2023-2028 (%)
    • 9.8 US - Market size and forecast 2023-2028
      • Exhibit 87: Chart on US - Market size and forecast 2023-2028 ($ billion)
      • Exhibit 88: Data Table on US - Market size and forecast 2023-2028 ($ billion)
      • Exhibit 89: Chart on US - Year-over-year growth 2023-2028 (%)
      • Exhibit 90: Data Table on US - Year-over-year growth 2023-2028 (%)
    • 9.9 China - Market size and forecast 2023-2028
      • Exhibit 91: Chart on China - Market size and forecast 2023-2028 ($ billion)
      • Exhibit 92: Data Table on China - Market size and forecast 2023-2028 ($ billion)
      • Exhibit 93: Chart on China - Year-over-year growth 2023-2028 (%)
      • Exhibit 94: Data Table on China - Year-over-year growth 2023-2028 (%)
    • 9.10 UK - Market size and forecast 2023-2028
      • Exhibit 95: Chart on UK - Market size and forecast 2023-2028 ($ billion)
      • Exhibit 96: Data Table on UK - Market size and forecast 2023-2028 ($ billion)
      • Exhibit 97: Chart on UK - Year-over-year growth 2023-2028 (%)
      • Exhibit 98: Data Table on UK - Year-over-year growth 2023-2028 (%)
    • 9.11 Germany - Market size and forecast 2023-2028
      • Exhibit 99: Chart on Germany - Market size and forecast 2023-2028 ($ billion)
      • Exhibit 100: Data Table on Germany - Market size and forecast 2023-2028 ($ billion)
      • Exhibit 101: Chart on Germany - Year-over-year growth 2023-2028 (%)
      • Exhibit 102: Data Table on Germany - Year-over-year growth 2023-2028 (%)
    • 9.12 Japan - Market size and forecast 2023-2028
      • Exhibit 103: Chart on Japan - Market size and forecast 2023-2028 ($ billion)
      • Exhibit 104: Data Table on Japan - Market size and forecast 2023-2028 ($ billion)
      • Exhibit 105: Chart on Japan - Year-over-year growth 2023-2028 (%)
      • Exhibit 106: Data Table on Japan - Year-over-year growth 2023-2028 (%)
    • 9.13 Market opportunity by geography
      • Exhibit 107: Market opportunity by geography ($ billion)
      • Exhibit 108: Data Tables on Market opportunity by geography ($ billion)

    10 Drivers, Challenges, and Trends

    • 10.1 Market drivers
      • 10.2 Market challenges
        • 10.3 Impact of drivers and challenges
          • Exhibit 109: Impact of drivers and challenges in 2023 and 2028
        • 10.4 Market trends

          11 Vendor Landscape

          • 11.1 Overview
            • 11.2 Vendor landscape
              • Exhibit 110: Overview on Criticality of inputs and Factors of differentiation
            • 11.3 Landscape disruption
              • Exhibit 111: Overview on factors of disruption
            • 11.4 Industry risks
              • Exhibit 112: Impact of key risks on business

            12 Vendor Analysis

            • 12.1 Vendors covered
              • Exhibit 113: Vendors covered
            • 12.2 Market positioning of vendors
              • Exhibit 114: Matrix on vendor position and classification
            • 12.3 Accenture Plc
              • Exhibit 115: Accenture Plc - Overview
              • Exhibit 116: Accenture Plc - Business segments
              • Exhibit 117: Accenture Plc - Key news
              • Exhibit 118: Accenture Plc - Key offerings
              • Exhibit 119: Accenture Plc - Segment focus
            • 12.4 Atos SE
              • Exhibit 120: Atos SE - Overview
              • Exhibit 121: Atos SE - Business segments
              • Exhibit 122: Atos SE - Key news
              • Exhibit 123: Atos SE - Key offerings
              • Exhibit 124: Atos SE - Segment focus
            • 12.5 Capgemini Service SAS
              • Exhibit 125: Capgemini Service SAS - Overview
              • Exhibit 126: Capgemini Service SAS - Business segments
              • Exhibit 127: Capgemini Service SAS - Key news
              • Exhibit 128: Capgemini Service SAS - Key offerings
              • Exhibit 129: Capgemini Service SAS - Segment focus
            • 12.6 CGI Inc.
              • Exhibit 130: CGI Inc. - Overview
              • Exhibit 131: CGI Inc. - Business segments
              • Exhibit 132: CGI Inc. - Key offerings
              • Exhibit 133: CGI Inc. - Segment focus
            • 12.7 Cognizant Technology Solutions Corp.
              • Exhibit 134: Cognizant Technology Solutions Corp. - Overview
              • Exhibit 135: Cognizant Technology Solutions Corp. - Business segments
              • Exhibit 136: Cognizant Technology Solutions Corp. - Key offerings
              • Exhibit 137: Cognizant Technology Solutions Corp. - Segment focus
            • 12.8 Deloitte Touche Tohmatsu Ltd.
              • Exhibit 138: Deloitte Touche Tohmatsu Ltd. - Overview
              • Exhibit 139: Deloitte Touche Tohmatsu Ltd. - Business segments
              • Exhibit 140: Deloitte Touche Tohmatsu Ltd. - Key offerings
              • Exhibit 141: Deloitte Touche Tohmatsu Ltd. - Segment focus
            • 12.9 DXC Technology Co.
              • Exhibit 142: DXC Technology Co. - Overview
              • Exhibit 143: DXC Technology Co. - Business segments
              • Exhibit 144: DXC Technology Co. - Key offerings
              • Exhibit 145: DXC Technology Co. - Segment focus
            • 12.10 HCL Technologies Ltd.
              • Exhibit 146: HCL Technologies Ltd. - Overview
              • Exhibit 147: HCL Technologies Ltd. - Business segments
              • Exhibit 148: HCL Technologies Ltd. - Key news
              • Exhibit 149: HCL Technologies Ltd. - Key offerings
              • Exhibit 150: HCL Technologies Ltd. - Segment focus
            • 12.11 Infosys Ltd.
              • Exhibit 151: Infosys Ltd. - Overview
              • Exhibit 152: Infosys Ltd. - Business segments
              • Exhibit 153: Infosys Ltd. - Key news
              • Exhibit 154: Infosys Ltd. - Key offerings
              • Exhibit 155: Infosys Ltd. - Segment focus
            • 12.12 International Business Machines Corp.
              • Exhibit 156: International Business Machines Corp. - Overview
              • Exhibit 157: International Business Machines Corp. - Business segments
              • Exhibit 158: International Business Machines Corp. - Key news
              • Exhibit 159: International Business Machines Corp. - Key offerings
              • Exhibit 160: International Business Machines Corp. - Segment focus
            • 12.13 Larsen and Toubro Ltd.
              • Exhibit 161: Larsen and Toubro Ltd. - Overview
              • Exhibit 162: Larsen and Toubro Ltd. - Business segments
              • Exhibit 163: Larsen and Toubro Ltd. - Key news
              • Exhibit 164: Larsen and Toubro Ltd. - Key offerings
              • Exhibit 165: Larsen and Toubro Ltd. - Segment focus
            • 12.14 PricewaterhouseCoopers LLP
              • Exhibit 166: PricewaterhouseCoopers LLP - Overview
              • Exhibit 167: PricewaterhouseCoopers LLP - Business segments
              • Exhibit 168: PricewaterhouseCoopers LLP - Key offerings
              • Exhibit 169: PricewaterhouseCoopers LLP - Segment focus
            • 12.15 Tata Consultancy Services Ltd.
              • Exhibit 170: Tata Consultancy Services Ltd. - Overview
              • Exhibit 171: Tata Consultancy Services Ltd. - Business segments
              • Exhibit 172: Tata Consultancy Services Ltd. - Key news
              • Exhibit 173: Tata Consultancy Services Ltd. - Key offerings
              • Exhibit 174: Tata Consultancy Services Ltd. - Segment focus
            • 12.16 Tech Mahindra Ltd.
              • Exhibit 175: Tech Mahindra Ltd. - Overview
              • Exhibit 176: Tech Mahindra Ltd. - Business segments
              • Exhibit 177: Tech Mahindra Ltd. - Key offerings
              • Exhibit 178: Tech Mahindra Ltd. - Segment focus
            • 12.17 Wipro Ltd.
              • Exhibit 179: Wipro Ltd. - Overview
              • Exhibit 180: Wipro Ltd. - Business segments
              • Exhibit 181: Wipro Ltd. - Key news
              • Exhibit 182: Wipro Ltd. - Key offerings
              • Exhibit 183: Wipro Ltd. - Segment focus

            13 Appendix

            • 13.1 Scope of the report
              • 13.2 Inclusions and exclusions checklist
                • Exhibit 184: Inclusions checklist
                • Exhibit 185: Exclusions checklist
              • 13.3 Currency conversion rates for US$
                • Exhibit 186: Currency conversion rates for US$
              • 13.4 Research methodology
                • Exhibit 187: Research methodology
                • Exhibit 188: Validation techniques employed for market sizing
                • Exhibit 189: Information sources
              • 13.5 List of abbreviations
                • Exhibit 190: List of abbreviations

                Research Methodology

                Technavio presents a detailed picture of the market by way of study, synthesis, and summation of data from multiple sources. The analysts have presented the various facets of the market with a particular focus on identifying the key industry influencers. The data thus presented is comprehensive, reliable, and the result of extensive research, both primary and secondary.

                INFORMATION SOURCES

                Primary sources

                • Manufacturers and suppliers
                • Channel partners
                • Industry experts
                • Strategic decision makers

                Secondary sources

                • Industry journals and periodicals
                • Government data
                • Financial reports of key industry players
                • Historical data
                • Press releases

                DATA ANALYSIS

                Data Synthesis

                • Collation of data
                • Estimation of key figures
                • Analysis of derived insights

                Data Validation

                • Triangulation with data models
                • Reference against proprietary databases
                • Corroboration with industry experts

                REPORT WRITING

                Qualitative

                • Market drivers
                • Market challenges
                • Market trends
                • Five forces analysis

                Quantitative

                • Market size and forecast
                • Market segmentation
                • Geographical insights
                • Competitive landscape

                Interested in this report?

                Get your sample now to see our research methodology and insights!

                Download Now

                Frequently Asked Questions

                Enterprise Mobile Application Development Services market growth will increase by $ 250.71 bn during 2024-2028.

                The Enterprise Mobile Application Development Services market is expected to grow at a CAGR of 25.54% during 2024-2028.

                Enterprise Mobile Application Development Services market is segmented by Application( Large enterprises, SMEs) Platform( Native, Hybrid, Web)

                Accenture Plc, Atos SE, Capgemini Service SAS, CGI Inc., Cognizant Technology Solutions Corp., Deloitte Touche Tohmatsu Ltd., DXC Technology Co., HCL Technologies Ltd., Hexaware Technologies Ltd., Infosys Ltd., International Business Machines Corp., ITC Ltd., Larsen and Toubro Ltd., Netguru S.A, PricewaterhouseCoopers LLP, Siemens AG, Tata Consultancy Services Ltd., Tech Mahindra Ltd., Virtusa Corp., Wipro Ltd., Zensar Technologies Inc. are a few of the key vendors in the Enterprise Mobile Application Development Services market.

                North America will register the highest growth rate of 46% among the other regions. Therefore, the Enterprise Mobile Application Development Services market in North America is expected to garner significant business opportunities for the vendors during the forecast period.

                US, China, Japan, UK, Germany

                • Growing demand for cloud-native developmentCloud-native development refers to the approach of building and deploying applications that leverage cloud computing infrastructure is the driving factor this market.
                • services is the driving factor this market.
                • and architectures to deliver scalable is the driving factor this market.
                • resilient is the driving factor this market.
                • and agile solutions. Cloud-native development enables mobile applications to scale dynamically based on demand is the driving factor this market.
                • allowing businesses to accommodate fluctuations in user traffic and workload without facing downtime or performance issues. Enterprises seek cloud-native mobile app development services to leverage the scalability and flexibility of cloud platforms is the driving factor this market.
                • ensuring that their applications can handle growth and adapt to changing business needs. Moreover is the driving factor this market.
                • cloud-native development accelerates the app development lifecycle by providing agile development methodologies is the driving factor this market.
                • automated deployment pipelines is the driving factor this market.
                • and DevOps practices. Enterprises can prototype is the driving factor this market.
                • build is the driving factor this market.
                • test is the driving factor this market.
                • and deploy mobile applications rapidly in cloud environments is the driving factor this market.
                • reducing time-to-market and gaining a competitive edge in fast-growing markets. Mobile app development service providers offer expertise in cloud-native tools and practices to help businesses achieve agility and speed in their development processes. Furthermore is the driving factor this market.
                • cloud-native mobile applications can integrate seamlessly with other cloud services is the driving factor this market.
                • third-party APIs is the driving factor this market.
                • and enterprise systems is the driving factor this market.
                • facilitating interoperability and data exchange across different platforms and environments. Enterprises leverage cloud-native mobile app development services to build applications that integrate with existing enterprise systems is the driving factor this market.
                • CRM platforms is the driving factor this market.
                • ERP systems is the driving factor this market.
                • and third-party services is the driving factor this market.
                • enhancing workflow automation and data synchronization. For instance is the driving factor this market.
                • Mendix Technology BV (a subsidiary of Siemens AG) offers Mendix cloud-native development where apps can run on the platform's cloud-native stateless runtime architecture with support for Docker is the driving factor this market.
                • Kubernetes is the driving factor this market.
                • and Cloud Foundry. This architecture conforms to the Twelve-Factor App principles and provides benefits like auto-scaling is the driving factor this market.
                • auto-provisioning is the driving factor this market.
                • auto-healing is the driving factor this market.
                • low infrastructure overhead is the driving factor this market.
                • continuous integration and continuous delivery/continuous deployment (CI/CD) is the driving factor this market.
                • and cloud interoperability. The platform's stateless server architecture supports on-demand vertical and horizontal. Mendix 7 offers a next-generation cloud architecture that uses Cloud Foundry and Docker to provide scalability is the driving factor this market.
                • high availability is the driving factor this market.
                • and multicloud portability. Mendix can be deployed in a variety of environments is the driving factor this market.
                • including public clouds is the driving factor this market.
                • virtual private clouds is the driving factor this market.
                • private clouds is the driving factor this market.
                • hybrid clouds is the driving factor this market.
                • multi-clouds is the driving factor this market.
                • and classic (virtual) servers. Thus is the driving factor this market.
                • mobile app development service providers play a crucial role in helping businesses harness the benefits of cloud-native development to achieve their digital transformation goals is the driving factor this market.
                • improve competitiveness is the driving factor this market.
                • and deliver value to consumers in the rapidly evolving mobile landscape is the driving factor this market.
                • which will boost the growth of the global enterprise mobile application development services market during the forecast period. is the driving factor this market.

                The Enterprise Mobile Application Development Services market vendors should focus on grabbing business opportunities from the Large enterprises segment as it accounted for the largest market share in the base year.