ESG Data Verification Services Market Analysis, Size, and Forecast 2026-2030: North America (US, Canada, and Mexico), APAC (China, Japan, and Australia), Europe (Germany, UK, and France), South America (Brazil, Argentina, and Chile), Middle East and Africa (UAE, South Africa, and Saudi Arabia), and Rest of World (ROW)

ESG Data Verification Services Market Analysis, Size, and Forecast 2026-2030:
North America (US, Canada, and Mexico), APAC (China, Japan, and Australia), Europe (Germany, UK, and France), South America (Brazil, Argentina, and Chile), Middle East and Africa (UAE, South Africa, and Saudi Arabia), and Rest of World (ROW)

Published: May 2026 301 Pages SKU: IRTNTR81317

Market Overview at a Glance

$4.09 B
Market Opportunity
29.2%
CAGR 2025 - 2030
33.6%
North America Growth
$668.1 Mn
Corporates and issuers segment 2024

Esg Data Verification Services Market Size and Growth Forecast 2026-2030

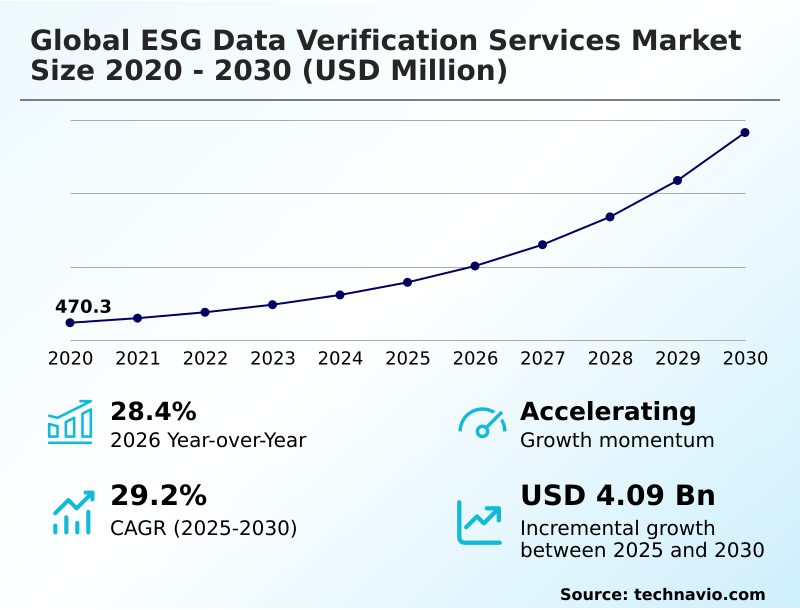
The Esg Data Verification Services Market size was valued at USD 1.57 billion in 2025 growing at a CAGR of 29.2% during the forecast period 2026-2030.

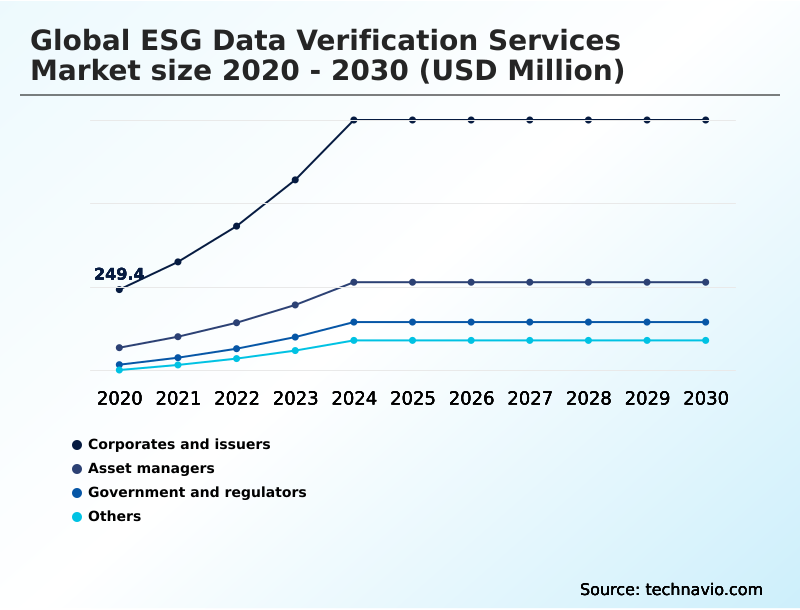
North America accounts for 33.6% of incremental growth during the forecast period. The Corporates and issuers segment by Application was valued at USD 668.1 million in 2024, while the Large enterprises segment holds the largest revenue share by Business Segment.

The market is projected to grow by USD 5.19 billion from 2020 to 2030, with USD 4.09 billion of the growth expected during the forecast period of 2025 to 2030.

Get Key Insights on Market Forecast (PDF) Request Free Sample

Esg Data Verification Services Market Overview

The ESG data verification services market is expanding as regulatory frameworks globally transition from voluntary to mandatory disclosures, compelling organizations to seek independent validation. The demand is driven by the need for credible sustainability report verification and greenwashing risk mitigation, which enhances stakeholder trust. In North America, which is poised to account for over 33% of market growth, this is especially true. Service providers offer a spectrum of validation from limited to reasonable assurance, covering metrics from GHG emissions verification to complex supply chain audits. A key development is the focus on double materiality assessment, where companies must report both their impact on the environment and how environmental factors impact their finances. For example, a large-scale food and beverage manufacturer must now secure ESG assurance and certification for its water usage data across its global bottling plants to comply with the Climate Corporate Data Accountability Act. This non-financial information validation is no longer a peripheral activity but a central pillar of corporate strategy, essential for accessing capital and maintaining a social license to operate.

Drivers, Trends, and Challenges in the Esg Data Verification Services Market

The market is rapidly specializing to meet diverse needs, moving beyond large corporations to provide ESG data verification for small and medium enterprises, often as a requisite for their participation in global supply chains.

A critical service area is the provision of reasonable assurance for carbon emission data, a standard now mandated by frameworks such as the EU's Corporate Sustainability Reporting Directive (CSRD). This higher level of scrutiny is essential for companies seeking to issue green bonds, with ESG audit for green bond issuance becoming a standard step in the financing process.

Technology is a key enabler of this specialization. For instance, blockchain-verified carbon credit tracking is being deployed to prevent double-counting in voluntary carbon markets, providing an immutable ledger for offsets. At the same time, AI-powered anomaly detection in ESG data helps auditors identify irregularities in utility consumption or waste reporting that may indicate reporting errors.

This is particularly valuable when verifying scope 3 emissions in apparel supply chains, where data is gathered from hundreds of disparate suppliers. For example, a major apparel brand now requires its tier-one suppliers to provide verifiable water usage data, with real-time verification of water usage data enabled through IoT sensors.

This extends to validating human rights due diligence reports and providing assurance for EU CSRD double materiality analyses, which are crucial for market access. Specialized services for the independent verification of biodiversity claims are also gaining prominence, especially for companies in the agricultural and extractive sectors.

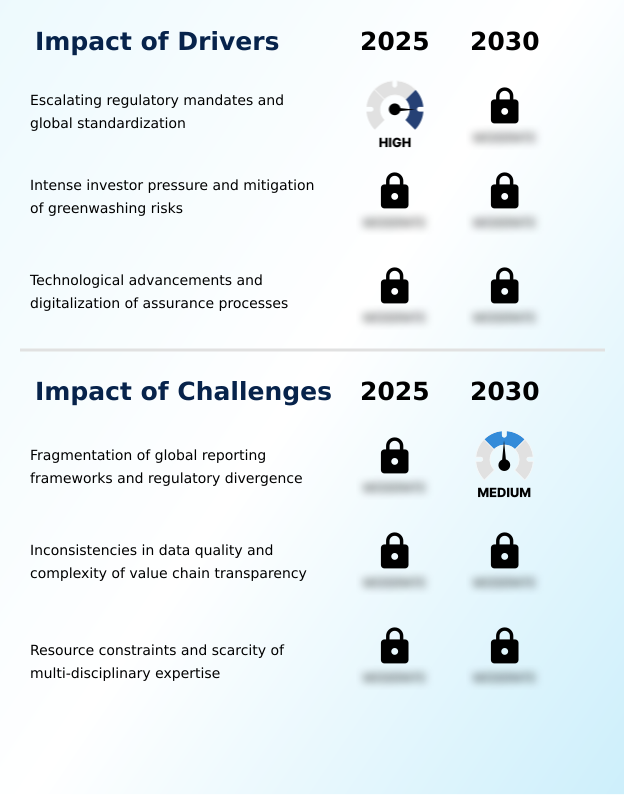
Primary Growth Driver: Escalating regulatory mandates and the push for global standardization of sustainability reporting are the primary drivers fueling demand for ESG data verification services.

The primary driver for the market, which is experiencing accelerating growth momentum, is the wave of escalating regulatory mandates worldwide.

Frameworks like the CSRD in Europe and similar initiatives in APAC, which will see a 30.1% CAGR, are turning voluntary reporting into a legal necessity requiring independent ESG assurance.

This is amplified by intense investor pressure to mitigate greenwashing risks; financial institutions increasingly require verified data for capital allocation and for sustainability-linked loan verification. Furthermore, technological advancements and the digitalization of assurance processes are making verification more efficient.

AI in ESG auditing and other tools enable providers to analyze vast datasets with greater speed and accuracy, lowering barriers to entry and expanding service capabilities for tasks like carbon footprint verification.

Emerging Market Trend: A significant market trend involves the proliferation of blockchain technology for immutable verification, providing a permanent and unalterable audit trail for non-financial disclosures.

A critical trend shaping the market is the transition from limited to reasonable assurance standards, a shift driven by investor demand for scrutiny comparable to financial audits. This is particularly evident in the large enterprises segment, which accounts for over 70% of the market.

Concurrently, the integration of AI and remote sensing technologies is revolutionizing the audit process, enabling continuous monitoring of land use and industrial emissions for more accurate GHG emissions verification. This technological convergence is complemented by the proliferation of blockchain technology for immutable verification, which creates a permanent audit trail for any supply chain ESG data audit, effectively combating greenwashing risks.

These trends collectively elevate the integrity and reliability of non-financial disclosures across the board.

Key Industry Challenge: A key challenge constraining market growth is the fragmentation of global reporting frameworks and significant regulatory divergence across jurisdictions.

A significant challenge is the fragmentation of global reporting frameworks, which complicates the audit process for multinationals needing to satisfy divergent local rules for non-financial information validation. This is compounded by inconsistencies in data quality, especially when attempting to achieve transparency across complex value chains for a supply chain ESG data audit.

The difficulty in obtaining reliable primary data from third-party suppliers, particularly for Scope 3 emissions verification, often forces auditors to rely on less precise industry averages. Finally, the market faces severe resource constraints due to a scarcity of multi-disciplinary expertise.

The shortage of qualified professionals with skills in both environmental science and financial auditing leads to higher service costs and extended lead times.

Explore Full Market Dynamics Analysis Request Free Sample

Esg Data Verification Services Market Segmentation

The esg data verification services industry research report provides comprehensive data including region-wise segment analysis, with forecasts and analysis for the period 2026-2030, as well as historical data from 2020-2024 for the following segments.

Market Segment by Application
  • Corporates and issuers
  • Asset managers
  • Government and regulators
  • Others
Market Segment by Business segment
  • Large enterprises
  • Small and medium enterprises
Market Segment by Deployment
  • On premise
  • Cloud based
Market Segment by Geography
North America
US, Canada, Mexico
APAC
China, Japan, Australia, India, South Korea, Indonesia
Europe
Germany, UK, France, The Netherlands, Italy, Spain
South America
Brazil, Argentina, Chile
Middle East and Africa
UAE, South Africa, Saudi Arabia, Egypt, Turkey

Application Segment Analysis

The corporates and issuers segment is estimated to witness significant growth during the forecast period.

The corporates and issuers segment is the largest, accounting for a substantial portion of market demand, approximately 37.1% in 2025. These entities engage verification services for ESG assurance and certification to validate annual reports and perform non-financial information validation.

This process is critical for greenwashing risk mitigation, which safeguards corporate reputation and shareholder trust. Furthermore, obtaining independent ESG assurance is essential for securing favorable financing terms, including access to green bonds and sustainability-linked loan verification.

As mandates like CSRD reporting assurance become standard, organizations are compelled to subject their carbon emissions, supply chain ethics, and diversity metrics to rigorous third-party audits, making these services a core component of corporate governance and strategic planning.

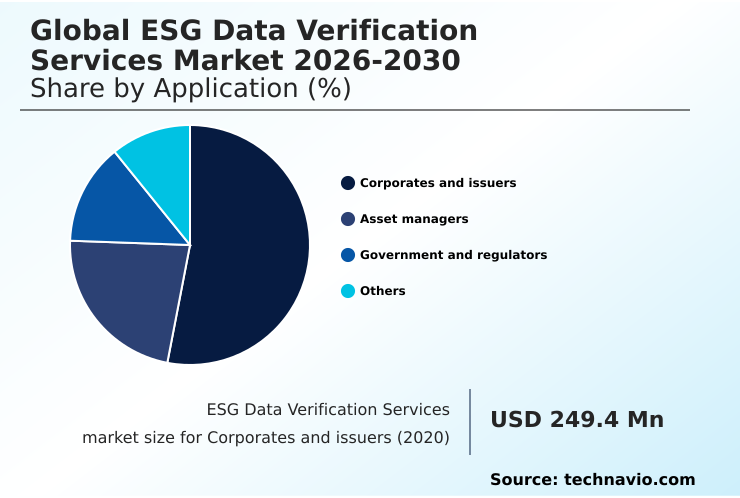
The Corporates and issuers segment was valued at USD 668.1 million in 2024 and showed a gradual increase during the forecast period.

Esg Data Verification Services Market by Region: North America Leads with 33.6% Growth Share

North America is estimated to contribute 33.6% to the growth of the global market during the forecast period.

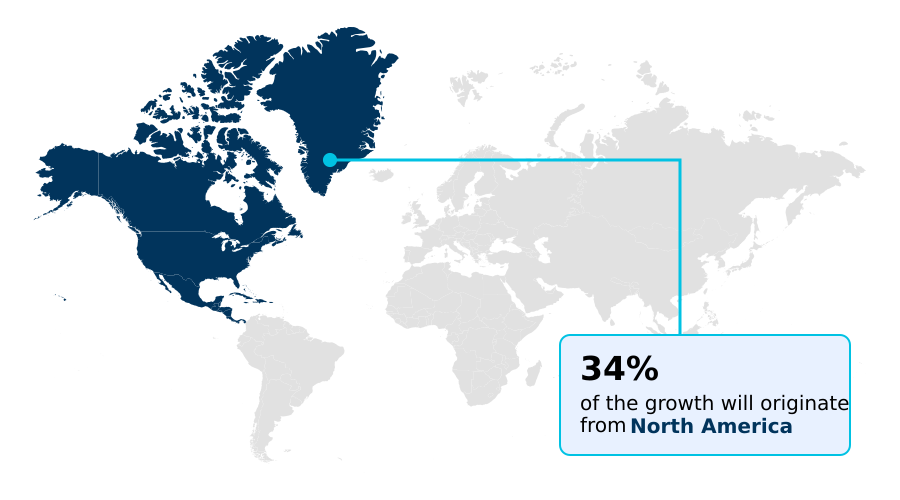
North America is set to contribute approximately 33.6% of the market's incremental growth, driven by investor demands and state-level mandates like California's climate disclosure laws, which necessitate rigorous corporate governance transparency audits.

Concurrently, APAC is emerging as the fastest-growing region, with a projected CAGR of 30.1%, as supply chain partners demand verifiable data.

In Europe, the focus is on sophisticated compliance activities, such as EU taxonomy alignment verification for financial products and detailed scope 3 emissions verification for industrial value chains. Across these regions, technological adoption is a key differentiator.

For instance, in South America, remote sensing for verification is being used to validate deforestation claims in the agricultural sector, showcasing how technology is enabling more accurate and scalable assurance services globally, even in geographically challenging environments.

Customer Landscape Analysis for the Esg Data Verification Services Market

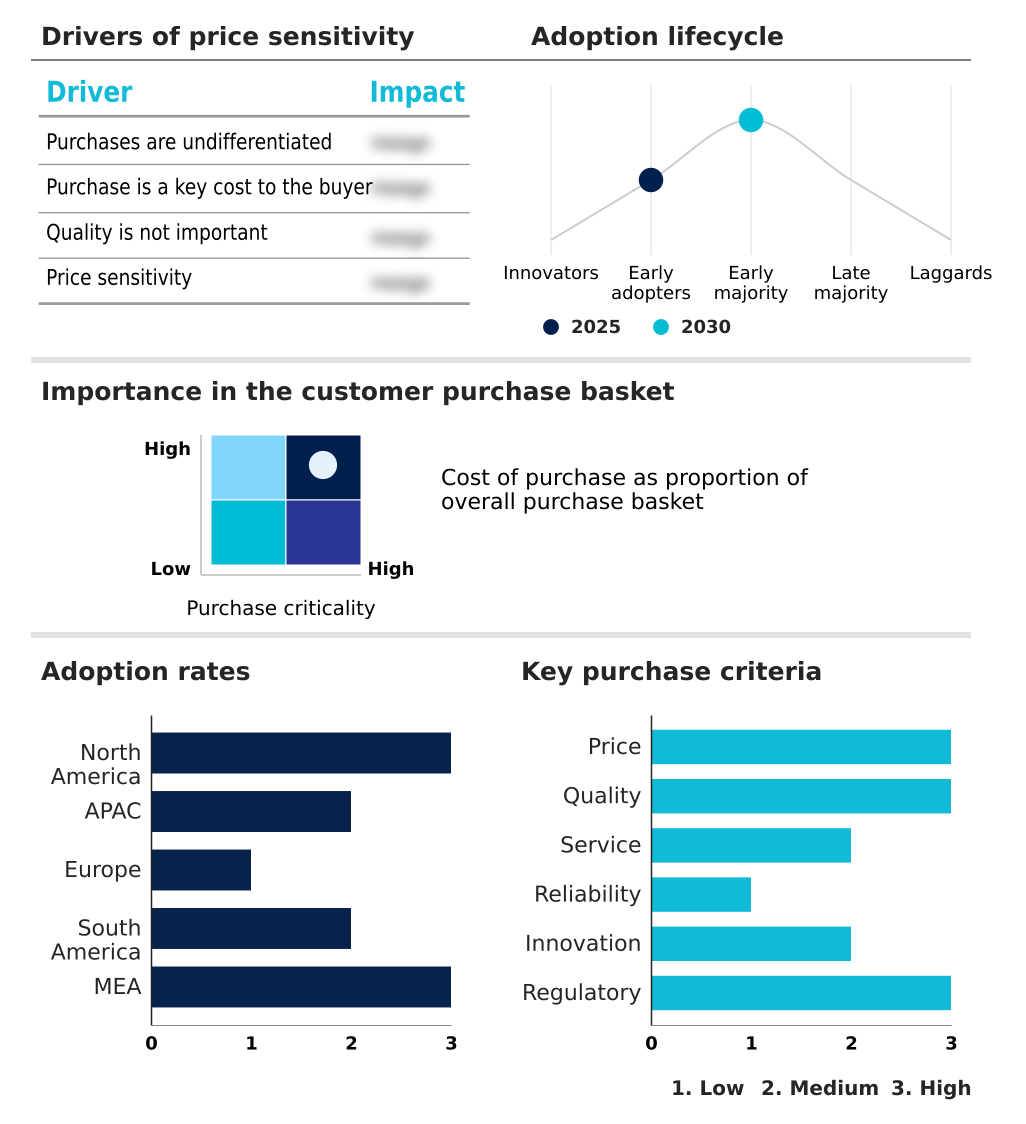
The esg data verification services market forecasting report includes the adoption lifecycle of the market, covering from the innovator’s stage to the laggard’s stage. It focuses on adoption rates in different regions based on penetration. Furthermore, the esg data verification services market report also includes key purchase criteria and drivers of price sensitivity to help companies evaluate and develop their market growth analysis strategies.

Competitive Landscape of the Esg Data Verification Services Market

Companies are implementing various strategies, such as strategic alliances, partnerships, mergers and acquisitions, geographical expansion, and product/service launches, to enhance their presence in the esg data verification services market industry.

British Standards Institution - Offers independent verification and assurance of ESG management systems, data, and reporting against global standards, ensuring accuracy, compliance, and enhanced credibility for stakeholders.

The industry research and growth report includes detailed analyses of the competitive landscape of the market and information about key companies, including:

  • British Standards Institution
  • Bureau Veritas
  • DEKRA SE
  • Deloitte Touche Tohmatsu Ltd.
  • DNV Group AS
  • EcoVadis SAS
  • ERM Group Inc.
  • Ernst and Young Global Ltd.
  • Forvis Mazars Group
  • Intertek Group Plc
  • KPMG International Ltd.
  • LRQA Group Ltd.
  • Microsoft Corp.
  • PricewaterhouseCoopers LLP
  • S and P Global Inc.
  • Salesforce Inc.
  • SGS SA
  • Sustainalytics.
  • UL LLC
  • WSP Global Inc.

Qualitative and quantitative analysis of companies has been conducted to help clients understand the wider business environment as well as the strengths and weaknesses of key industry players. Data is qualitatively analyzed to categorize companies as pure play, category-focused, industry-focused, and diversified; it is quantitatively analyzed to categorize companies as dominant, leading, strong, tentative, and weak.

Recent Developments in the Esg Data Verification Services Market

  • In August 2025, a prominent North American institutional investment group announced a new policy requiring portfolio companies in the energy sector to obtain third-party verification for methane emission reports, with divestment as a consequence for non-compliance.
  • In November 2025, a leading European certification organization launched a digital platform that integrates internet-of-things sensors and blockchain to provide continuous, real-time verification of water usage and waste management data for industrial manufacturing facilities.
  • In April 2025, the national stock exchange of a major financial hub in the APAC region introduced a revised listing requirement mandating that all large-cap companies obtain reasonable assurance for their carbon emission data.
  • In June 2025, a major logistics and shipping conglomerate in South America implemented a blockchain-enabled platform to provide transparent and immutable verification of carbon credits generated from its regional reforestation initiatives.

Research Analyst Overview: Esg Data Verification Services Market

The ESG data verification services market is shifting from a compliance exercise to a strategic imperative, driven by regulations like the EU's Corporate Sustainability Reporting Directive (CSRD). Boardroom decisions are now directly tied to the ability to secure ESG assurance and certification, particularly for non-financial information validation on topics ranging from GHG emissions verification to biodiversity impact assessment.

The market offers a spectrum from limited to reasonable assurance, with the latter becoming the gold standard for high-stakes disclosures. Achieving CSRD reporting assurance is critical for European market access, while alignment with ISSB standards compliance is vital for global capital markets.

A key pressure point is greenwashing risk mitigation, forcing companies to seek independent ESG assurance for every sustainability report verification. This includes granular audits of the supply chain ESG data audit, circular economy metrics verification, and social impact data validation.

The need for a corporate governance transparency audit and verification of alignment with frameworks like TCFD, SFDR, and the EU taxonomy is reshaping corporate strategy, making sustainability-linked loan verification and carbon footprint verification non-negotiable for securing favorable financing.

Dive into Technavio’s robust research methodology, blending expert interviews, extensive data synthesis, and validated models for unparalleled Esg Data Verification Services Market insights. See full methodology.

Request Free Sample

Market Scope
Page number 301
Base year 2025
Historic period 2020-2024
Forecast period 2026-2030
Growth momentum & CAGR Accelerate at a CAGR of 29.2%
Market growth 2026-2030 USD 4085.8 million
Market structure Fragmented
YoY growth 2025-2026(%) 28.4%
Key countries US, Canada, Mexico, China, Japan, Australia, India, South Korea, Indonesia, Germany, UK, France, The Netherlands, Italy, Spain, Brazil, Argentina, Chile, UAE, South Africa, Saudi Arabia, Egypt and Turkey
Competitive landscape Leading Companies, Market Positioning of Companies, Competitive Strategies, and Industry Risks

Esg Data Verification Services Market: Key Questions Answered in This Report

  • What is the expected growth of the Esg Data Verification Services Market between 2026 and 2030?

    • The Esg Data Verification Services Market is expected to grow by USD 4.09 billion during 2026-2030, registering a CAGR of 29.2%. Year-over-year growth in 2026 is estimated at 28.4%%. This acceleration is shaped by escalating regulatory mandates and global standardization, which is intensifying demand across multiple end-use verticals covered in the report.

  • What segmentation does the market report cover?

    • The report is segmented by Application (Corporates and issuers, Asset managers, Government and regulators, and Others), Business Segment (Large enterprises, and Small and medium enterprises), Deployment (On premise, and Cloud based) and Geography (North America, APAC, Europe, South America, Middle East and Africa). Among these, the Corporates and issuers segment is estimated to witness significant growth during the forecast period, driven by rising adoption across key application areas. Each segment includes detailed qualitative and quantitative analysis, along with historical data from 2020-2024 and forecasts through 2030 with year-over-year growth rates.

  • Which regions are analyzed in the report?

    • The report covers North America, APAC, Europe, South America and Middle East and Africa. North America is estimated to contribute 33.6% to market growth during the forecast period. Country-level analysis includes US, Canada, Mexico, China, Japan, Australia, India, South Korea, Indonesia, Germany, UK, France, The Netherlands, Italy, Spain, Brazil, Argentina, Chile, UAE, South Africa, Saudi Arabia, Egypt and Turkey, with dedicated market size tables and year-over-year growth for each.

  • What are the key growth drivers and market challenges?

    • The primary driver is escalating regulatory mandates and global standardization, which is accelerating investment and industry demand. The main challenge is fragmentation of global reporting frameworks and regulatory divergence, creating operational barriers for key market participants. The report quantifies the impact of each driver and challenge across 2026 and 2030 with comparative analysis.

  • Who are the major players in the Esg Data Verification Services Market?

    • Key vendors include British Standards Institution, Bureau Veritas, DEKRA SE, Deloitte Touche Tohmatsu Ltd., DNV Group AS, EcoVadis SAS, ERM Group Inc., Ernst and Young Global Ltd., Forvis Mazars Group, Intertek Group Plc, KPMG International Ltd., LRQA Group Ltd., Microsoft Corp., PricewaterhouseCoopers LLP, S and P Global Inc., Salesforce Inc., SGS SA, Sustainalytics., UL LLC and WSP Global Inc.. The report provides qualitative and quantitative analysis categorizing companies as dominant, leading, strong, tentative, and weak based on their market positioning. Company profiles include business segment analysis, SWOT assessment, key offerings, and recent strategic developments.

Esg Data Verification Services Market Research Insights

The market's 28.4% year-over-year growth is propelled by intense pressure for enhanced ESG data integrity from investors and regulators. The implementation of stringent sustainability reporting frameworks, most notably the Corporate Sustainability Reporting Directive (CSRD) in Europe, has made the role of a third-party assurance provider indispensable for thousands of companies.

This has created a significant demand for services that go beyond basic compliance, extending to ESG rating agency support and the validation of green bond verification. Within this environment, organizations are deploying advanced ESG data governance platforms to streamline the collection and preparation of information for external audits.

This professionalization ensures that corporate disclosures are robust, comparable, and capable of withstanding the scrutiny of financial markets.

We can help! Our analysts can customize this esg data verification services market research report to meet your requirements.

Get in touch

1. Executive Summary

1.1 Market overview

Executive Summary - Chart on Market Overview
Executive Summary - Data Table on Market Overview
Executive Summary - Chart on Global Market Characteristics
Executive Summary - Chart on Market by Geography
Executive Summary - Chart on Market Segmentation by Application
Executive Summary - Chart on Market Segmentation by Business Segment
Executive Summary - Chart on Market Segmentation by Deployment
Executive Summary - Chart on Incremental Growth
Executive Summary - Data Table on Incremental Growth
Executive Summary - Chart on Company Market Positioning

2. Technavio Analysis

2.1 Analysis of price sensitivity, lifecycle, customer purchase basket, adoption rates, and purchase criteria

2.2 Criticality of inputs and Factors of differentiation

Chart on Overview on criticality of inputs and factors of differentiation

2.3 Factors of disruption

Chart on Overview on factors of disruption

2.4 Impact of drivers and challenges

Chart on Impact of drivers and challenges in 2025 and 2030

3. Market Landscape

3.1 Market ecosystem

Chart on Parent Market
Data Table on - Parent Market

3.2 Market characteristics

Chart on Market characteristics analysis

3.3 Value chain analysis

Chart on Value chain analysis

4. Market Sizing

4.1 Market definition

Data Table on Offerings of companies included in the market definition

4.2 Market segment analysis

Market segments

4.3 Market size 2025

4.4 Market outlook: Forecast for 2025-2030

Chart on Global - Market size and forecast 2025-2030 ($ million)
Data Table on Global - Market size and forecast 2025-2030 ($ million)
Chart on Global Market: Year-over-year growth 2025-2030 (%)
Data Table on Global Market: Year-over-year growth 2025-2030 (%)

5. Historic Market Size

5.1 Global ESG Data Verification Services Market 2020 - 2024

Historic Market Size - Data Table on Global ESG Data Verification Services Market 2020 - 2024 ($ million)

5.2 Application segment analysis 2020 - 2024

Historic Market Size - Application Segment 2020 - 2024 ($ million)

5.3 Business segment analysis 2020 - 2024

Historic Market Size - Business Segment 2020 - 2024 ($ million)

5.4 Deployment segment analysis 2020 - 2024

Historic Market Size - Deployment Segment 2020 - 2024 ($ million)

5.5 Geography segment analysis 2020 - 2024

Historic Market Size - Geography Segment 2020 - 2024 ($ million)

5.6 Country segment analysis 2020 - 2024

Historic Market Size - Country Segment 2020 - 2024 ($ million)

6. Qualitative Analysis

6.1 The AI impact on Global ESG Data Verification Services Market

7. Five Forces Analysis

7.1 Five forces summary

Five forces analysis - Comparison between 2025 and 2030

7.2 Bargaining power of buyers

Bargaining power of buyers - Impact of key factors 2025 and 2030

7.3 Bargaining power of suppliers

Bargaining power of suppliers - Impact of key factors in 2025 and 2030

7.4 Threat of new entrants

Threat of new entrants - Impact of key factors in 2025 and 2030

7.5 Threat of substitutes

Threat of substitutes - Impact of key factors in 2025 and 2030

7.6 Threat of rivalry

Threat of rivalry - Impact of key factors in 2025 and 2030

7.7 Market condition

Chart on Market condition - Five forces 2025 and 2030

8. Market Segmentation by Application

8.1 Market segments

Chart on Application - Market share 2025-2030 (%)
Data Table on Application - Market share 2025-2030 (%)

8.2 Comparison by Application

Chart on Comparison by Application
Data Table on Comparison by Application

8.3 Corporates and issuers - Market size and forecast 2025-2030

Chart on Corporates and issuers - Market size and forecast 2025-2030 ($ million)
Data Table on Corporates and issuers - Market size and forecast 2025-2030 ($ million)
Chart on Corporates and issuers - Year-over-year growth 2025-2030 (%)
Data Table on Corporates and issuers - Year-over-year growth 2025-2030 (%)

8.4 Asset managers - Market size and forecast 2025-2030

Chart on Asset managers - Market size and forecast 2025-2030 ($ million)
Data Table on Asset managers - Market size and forecast 2025-2030 ($ million)
Chart on Asset managers - Year-over-year growth 2025-2030 (%)
Data Table on Asset managers - Year-over-year growth 2025-2030 (%)

8.5 Government and regulators - Market size and forecast 2025-2030

Chart on Government and regulators - Market size and forecast 2025-2030 ($ million)
Data Table on Government and regulators - Market size and forecast 2025-2030 ($ million)
Chart on Government and regulators - Year-over-year growth 2025-2030 (%)
Data Table on Government and regulators - Year-over-year growth 2025-2030 (%)

8.6 Others - Market size and forecast 2025-2030

Chart on Others - Market size and forecast 2025-2030 ($ million)
Data Table on Others - Market size and forecast 2025-2030 ($ million)
Chart on Others - Year-over-year growth 2025-2030 (%)
Data Table on Others - Year-over-year growth 2025-2030 (%)

8.7 Market opportunity by Application

Market opportunity by Application ($ million)
Data Table on Market opportunity by Application ($ million)

9. Market Segmentation by Business Segment

9.1 Market segments

Chart on Market Segmentation by Business Segment - Market share 2025-2030 (%)
Data Table on Market Segmentation by Business Segment - Market share 2025-2030 (%)

9.2 Comparison by Market Segmentation by Business Segment

Chart on Comparison by Market Segmentation by Business Segment
Data Table on Comparison by Market Segmentation by Business Segment

9.3 Large enterprises - Market size and forecast 2025-2030

Chart on Large enterprises - Market size and forecast 2025-2030 ($ million)
Data Table on Large enterprises - Market size and forecast 2025-2030 ($ million)
Chart on Large enterprises - Year-over-year growth 2025-2030 (%)
Data Table on Large enterprises - Year-over-year growth 2025-2030 (%)

9.4 Small and medium enterprises - Market size and forecast 2025-2030

Chart on Small and medium enterprises - Market size and forecast 2025-2030 ($ million)
Data Table on Small and medium enterprises - Market size and forecast 2025-2030 ($ million)
Chart on Small and medium enterprises - Year-over-year growth 2025-2030 (%)
Data Table on Small and medium enterprises - Year-over-year growth 2025-2030 (%)

9.5 Market opportunity by Market Segmentation by Business Segment

Market opportunity by Market Segmentation by Business Segment ($ million)
Data Table on Market opportunity by Market Segmentation by Business Segment ($ million)

10. Market Segmentation by Deployment

10.1 Market segments

Chart on Deployment - Market share 2025-2030 (%)
Data Table on Deployment - Market share 2025-2030 (%)

10.2 Comparison by Deployment

Chart on Comparison by Deployment
Data Table on Comparison by Deployment

10.3 On premise - Market size and forecast 2025-2030

Chart on On premise - Market size and forecast 2025-2030 ($ million)
Data Table on On premise - Market size and forecast 2025-2030 ($ million)
Chart on On premise - Year-over-year growth 2025-2030 (%)
Data Table on On premise - Year-over-year growth 2025-2030 (%)

10.4 Cloud based - Market size and forecast 2025-2030

Chart on Cloud based - Market size and forecast 2025-2030 ($ million)
Data Table on Cloud based - Market size and forecast 2025-2030 ($ million)
Chart on Cloud based - Year-over-year growth 2025-2030 (%)
Data Table on Cloud based - Year-over-year growth 2025-2030 (%)

10.5 Market opportunity by Deployment

Market opportunity by Deployment ($ million)
Data Table on Market opportunity by Deployment ($ million)

11. Customer Landscape

11.1 Customer landscape overview

Analysis of price sensitivity, lifecycle, customer purchase basket, adoption rates, and purchase criteria

12. Geographic Landscape

12.1 Geographic segmentation

Chart on Market share by geography 2025-2030 (%)
Data Table on Market share by geography 2025-2030 (%)

12.2 Geographic comparison

Chart on Geographic comparison
Data Table on Geographic comparison

12.3 North America - Market size and forecast 2025-2030

Chart on North America - Market size and forecast 2025-2030 ($ million)
Data Table on North America - Market size and forecast 2025-2030 ($ million)
Chart on North America - Year-over-year growth 2025-2030 (%)
Data Table on North America - Year-over-year growth 2025-2030 (%)
Chart on Regional Comparison - North America
Data Table on Regional Comparison - North America

12.3.1 US - Market size and forecast 2025-2030

Chart on US - Market size and forecast 2025-2030 ($ million)
Data Table on US - Market size and forecast 2025-2030 ($ million)
Chart on US - Year-over-year growth 2025-2030 (%)
Data Table on US - Year-over-year growth 2025-2030 (%)

12.3.2 Canada - Market size and forecast 2025-2030

Chart on Canada - Market size and forecast 2025-2030 ($ million)
Data Table on Canada - Market size and forecast 2025-2030 ($ million)
Chart on Canada - Year-over-year growth 2025-2030 (%)
Data Table on Canada - Year-over-year growth 2025-2030 (%)

12.3.3 Mexico - Market size and forecast 2025-2030

Chart on Mexico - Market size and forecast 2025-2030 ($ million)
Data Table on Mexico - Market size and forecast 2025-2030 ($ million)
Chart on Mexico - Year-over-year growth 2025-2030 (%)
Data Table on Mexico - Year-over-year growth 2025-2030 (%)

12.4 APAC - Market size and forecast 2025-2030

Chart on APAC - Market size and forecast 2025-2030 ($ million)
Data Table on APAC - Market size and forecast 2025-2030 ($ million)
Chart on APAC - Year-over-year growth 2025-2030 (%)
Data Table on APAC - Year-over-year growth 2025-2030 (%)
Chart on Regional Comparison - APAC
Data Table on Regional Comparison - APAC

12.4.1 China - Market size and forecast 2025-2030

Chart on China - Market size and forecast 2025-2030 ($ million)
Data Table on China - Market size and forecast 2025-2030 ($ million)
Chart on China - Year-over-year growth 2025-2030 (%)
Data Table on China - Year-over-year growth 2025-2030 (%)

12.4.2 Japan - Market size and forecast 2025-2030

Chart on Japan - Market size and forecast 2025-2030 ($ million)
Data Table on Japan - Market size and forecast 2025-2030 ($ million)
Chart on Japan - Year-over-year growth 2025-2030 (%)
Data Table on Japan - Year-over-year growth 2025-2030 (%)

12.4.3 Australia - Market size and forecast 2025-2030

Chart on Australia - Market size and forecast 2025-2030 ($ million)
Data Table on Australia - Market size and forecast 2025-2030 ($ million)
Chart on Australia - Year-over-year growth 2025-2030 (%)
Data Table on Australia - Year-over-year growth 2025-2030 (%)

12.4.4 India - Market size and forecast 2025-2030

Chart on India - Market size and forecast 2025-2030 ($ million)
Data Table on India - Market size and forecast 2025-2030 ($ million)
Chart on India - Year-over-year growth 2025-2030 (%)
Data Table on India - Year-over-year growth 2025-2030 (%)

12.4.5 South Korea - Market size and forecast 2025-2030

Chart on South Korea - Market size and forecast 2025-2030 ($ million)
Data Table on South Korea - Market size and forecast 2025-2030 ($ million)
Chart on South Korea - Year-over-year growth 2025-2030 (%)
Data Table on South Korea - Year-over-year growth 2025-2030 (%)

12.4.6 Indonesia - Market size and forecast 2025-2030

Chart on Indonesia - Market size and forecast 2025-2030 ($ million)
Data Table on Indonesia - Market size and forecast 2025-2030 ($ million)
Chart on Indonesia - Year-over-year growth 2025-2030 (%)
Data Table on Indonesia - Year-over-year growth 2025-2030 (%)

12.5 Europe - Market size and forecast 2025-2030

Chart on Europe - Market size and forecast 2025-2030 ($ million)
Data Table on Europe - Market size and forecast 2025-2030 ($ million)
Chart on Europe - Year-over-year growth 2025-2030 (%)
Data Table on Europe - Year-over-year growth 2025-2030 (%)
Chart on Regional Comparison - Europe
Data Table on Regional Comparison - Europe

12.5.1 Germany - Market size and forecast 2025-2030

Chart on Germany - Market size and forecast 2025-2030 ($ million)
Data Table on Germany - Market size and forecast 2025-2030 ($ million)
Chart on Germany - Year-over-year growth 2025-2030 (%)
Data Table on Germany - Year-over-year growth 2025-2030 (%)

12.5.2 UK - Market size and forecast 2025-2030

Chart on UK - Market size and forecast 2025-2030 ($ million)
Data Table on UK - Market size and forecast 2025-2030 ($ million)
Chart on UK - Year-over-year growth 2025-2030 (%)
Data Table on UK - Year-over-year growth 2025-2030 (%)

12.5.3 France - Market size and forecast 2025-2030

Chart on France - Market size and forecast 2025-2030 ($ million)
Data Table on France - Market size and forecast 2025-2030 ($ million)
Chart on France - Year-over-year growth 2025-2030 (%)
Data Table on France - Year-over-year growth 2025-2030 (%)

12.5.4 The Netherlands - Market size and forecast 2025-2030

Chart on The Netherlands - Market size and forecast 2025-2030 ($ million)
Data Table on The Netherlands - Market size and forecast 2025-2030 ($ million)
Chart on The Netherlands - Year-over-year growth 2025-2030 (%)
Data Table on The Netherlands - Year-over-year growth 2025-2030 (%)

12.5.5 Italy - Market size and forecast 2025-2030

Chart on Italy - Market size and forecast 2025-2030 ($ million)
Data Table on Italy - Market size and forecast 2025-2030 ($ million)
Chart on Italy - Year-over-year growth 2025-2030 (%)
Data Table on Italy - Year-over-year growth 2025-2030 (%)

12.5.6 Spain - Market size and forecast 2025-2030

Chart on Spain - Market size and forecast 2025-2030 ($ million)
Data Table on Spain - Market size and forecast 2025-2030 ($ million)
Chart on Spain - Year-over-year growth 2025-2030 (%)
Data Table on Spain - Year-over-year growth 2025-2030 (%)

12.6 South America - Market size and forecast 2025-2030

Chart on South America - Market size and forecast 2025-2030 ($ million)
Data Table on South America - Market size and forecast 2025-2030 ($ million)
Chart on South America - Year-over-year growth 2025-2030 (%)
Data Table on South America - Year-over-year growth 2025-2030 (%)
Chart on Regional Comparison - South America
Data Table on Regional Comparison - South America

12.6.1 Brazil - Market size and forecast 2025-2030

Chart on Brazil - Market size and forecast 2025-2030 ($ million)
Data Table on Brazil - Market size and forecast 2025-2030 ($ million)
Chart on Brazil - Year-over-year growth 2025-2030 (%)
Data Table on Brazil - Year-over-year growth 2025-2030 (%)

12.6.2 Argentina - Market size and forecast 2025-2030

Chart on Argentina - Market size and forecast 2025-2030 ($ million)
Data Table on Argentina - Market size and forecast 2025-2030 ($ million)
Chart on Argentina - Year-over-year growth 2025-2030 (%)
Data Table on Argentina - Year-over-year growth 2025-2030 (%)

12.6.3 Chile - Market size and forecast 2025-2030

Chart on Chile - Market size and forecast 2025-2030 ($ million)
Data Table on Chile - Market size and forecast 2025-2030 ($ million)
Chart on Chile - Year-over-year growth 2025-2030 (%)
Data Table on Chile - Year-over-year growth 2025-2030 (%)

12.7 Middle East and Africa - Market size and forecast 2025-2030

Chart on Middle East and Africa - Market size and forecast 2025-2030 ($ million)
Data Table on Middle East and Africa - Market size and forecast 2025-2030 ($ million)
Chart on Middle East and Africa - Year-over-year growth 2025-2030 (%)
Data Table on Middle East and Africa - Year-over-year growth 2025-2030 (%)
Chart on Regional Comparison - Middle East and Africa
Data Table on Regional Comparison - Middle East and Africa

12.7.1 UAE - Market size and forecast 2025-2030

Chart on UAE - Market size and forecast 2025-2030 ($ million)
Data Table on UAE - Market size and forecast 2025-2030 ($ million)
Chart on UAE - Year-over-year growth 2025-2030 (%)
Data Table on UAE - Year-over-year growth 2025-2030 (%)

12.7.2 South Africa - Market size and forecast 2025-2030

Chart on South Africa - Market size and forecast 2025-2030 ($ million)
Data Table on South Africa - Market size and forecast 2025-2030 ($ million)
Chart on South Africa - Year-over-year growth 2025-2030 (%)
Data Table on South Africa - Year-over-year growth 2025-2030 (%)

12.7.3 Saudi Arabia - Market size and forecast 2025-2030

Chart on Saudi Arabia - Market size and forecast 2025-2030 ($ million)
Data Table on Saudi Arabia - Market size and forecast 2025-2030 ($ million)
Chart on Saudi Arabia - Year-over-year growth 2025-2030 (%)
Data Table on Saudi Arabia - Year-over-year growth 2025-2030 (%)

12.7.4 Egypt - Market size and forecast 2025-2030

Chart on Egypt - Market size and forecast 2025-2030 ($ million)
Data Table on Egypt - Market size and forecast 2025-2030 ($ million)
Chart on Egypt - Year-over-year growth 2025-2030 (%)
Data Table on Egypt - Year-over-year growth 2025-2030 (%)

12.7.5 Turkey - Market size and forecast 2025-2030

Chart on Turkey - Market size and forecast 2025-2030 ($ million)
Data Table on Turkey - Market size and forecast 2025-2030 ($ million)
Chart on Turkey - Year-over-year growth 2025-2030 (%)
Data Table on Turkey - Year-over-year growth 2025-2030 (%)

12.8 Market opportunity by geography

Market opportunity by geography ($ million)
Data Tables on Market opportunity by geography ($ million)

13. Drivers, Challenges, and Opportunity

13.1 Market drivers

Escalating regulatory mandates and global standardization
Intense investor pressure and mitigation of greenwashing risks
Technological advancements and digitalization of assurance processes

13.2 Market challenges

Fragmentation of global reporting frameworks and regulatory divergence
Inconsistencies in data quality and complexity of value chain transparency
Resource constraints and scarcity of multi-disciplinary expertise

13.3 Impact of drivers and challenges

Impact of drivers and challenges in 2025 and 2030

13.4 Market opportunities

Proliferation of blockchain technology for immutable verification
Integration of AI and remote sensing technologies
Transition from limited assurance to reasonable assurance standards

14. Competitive Landscape

14.1 Overview

14.2

Overview on criticality of inputs and factors of differentiation

14.3 Landscape disruption

Overview on factors of disruption

14.4 Industry risks

Impact of key risks on business

15. Competitive Analysis

15.1 Companies profiled

Companies covered

15.2 Company ranking index

15.3 Market positioning of companies

Matrix on companies position and classification

15.4 British Standards Institution

British Standards Institution - Overview
British Standards Institution - Product / Service
British Standards Institution - Key offerings
SWOT

15.5 Bureau Veritas

Bureau Veritas - Overview
Bureau Veritas - Business segments
Bureau Veritas - Key offerings
Bureau Veritas - Segment focus
SWOT

15.6 Deloitte Touche Tohmatsu Ltd.

Deloitte Touche Tohmatsu Ltd. - Overview
Deloitte Touche Tohmatsu Ltd. - Business segments
Deloitte Touche Tohmatsu Ltd. - Key offerings
Deloitte Touche Tohmatsu Ltd. - Segment focus
SWOT

15.7 DNV Group AS

DNV Group AS - Overview
DNV Group AS - Business segments
DNV Group AS - Key offerings
DNV Group AS - Segment focus
SWOT

15.8 Ernst and Young Global Ltd.

Ernst and Young Global Ltd. - Overview
Ernst and Young Global Ltd. - Product / Service
Ernst and Young Global Ltd. - Key offerings
SWOT

15.9 Forvis Mazars Group

Forvis Mazars Group - Overview
Forvis Mazars Group - Product / Service
Forvis Mazars Group - Key offerings
SWOT

15.10 Intertek Group Plc

Intertek Group Plc - Overview
Intertek Group Plc - Business segments
Intertek Group Plc - Key offerings
Intertek Group Plc - Segment focus
SWOT

15.11 KPMG International Ltd.

KPMG International Ltd. - Overview
KPMG International Ltd. - Product / Service
KPMG International Ltd. - Key offerings
SWOT

15.12 LRQA Group Ltd.

LRQA Group Ltd. - Overview
LRQA Group Ltd. - Product / Service
LRQA Group Ltd. - Key offerings
SWOT

15.13 Microsoft Corp.

Microsoft Corp. - Overview
Microsoft Corp. - Business segments
Microsoft Corp. - Key news
Microsoft Corp. - Key offerings
Microsoft Corp. - Segment focus
SWOT

15.14 PricewaterhouseCoopers LLP

PricewaterhouseCoopers LLP - Overview
PricewaterhouseCoopers LLP - Product / Service
PricewaterhouseCoopers LLP - Key offerings
SWOT

15.15 S and P Global Inc.

S and P Global Inc. - Overview
S and P Global Inc. - Business segments
S and P Global Inc. - Key offerings
S and P Global Inc. - Segment focus
SWOT

15.16 Salesforce Inc.

Salesforce Inc. - Overview
Salesforce Inc. - Business segments
Salesforce Inc. - Key news
Salesforce Inc. - Key offerings
Salesforce Inc. - Segment focus
SWOT

15.17 SGS SA

SGS SA - Overview
SGS SA - Business segments
SGS SA - Key offerings
SGS SA - Segment focus
SWOT

15.18 WSP Global Inc.

WSP Global Inc. - Overview
WSP Global Inc. - Business segments
WSP Global Inc. - Key offerings
WSP Global Inc. - Segment focus
SWOT

16. Appendix

16.1 Scope of the report

Market definition
Objectives
Notes and caveats

16.2 Inclusions and exclusions checklist

Inclusions checklist
Exclusions checklist

16.3 Currency conversion rates for US$

16.4 Research methodology

16.5 Data procurement

Information sources

16.6 Data validation

16.7 Validation techniques employed for market sizing

16.8 Data synthesis

16.9 360 degree market analysis

16.10 List of abbreviations

Research Methodology

Technavio presents a detailed picture of the market by way of study, synthesis, and summation of data from multiple sources. The analysts have presented the various facets of the market with a particular focus on identifying the key industry influencers. The data thus presented is comprehensive, reliable, and the result of extensive research, both primary and secondary.

INFORMATION SOURCES

Primary sources

  • Manufacturers and suppliers
  • Channel partners
  • Industry experts
  • Strategic decision makers

Secondary sources

  • Industry journals and periodicals
  • Government data
  • Financial reports of key industry players
  • Historical data
  • Press releases

DATA ANALYSIS

Data Synthesis

  • Collation of data
  • Estimation of key figures
  • Analysis of derived insights

Data Validation

  • Triangulation with data models
  • Reference against proprietary databases
  • Corroboration with industry experts

REPORT WRITING

Qualitative

  • Market drivers
  • Market challenges
  • Market trends
  • Five forces analysis

Quantitative

  • Market size and forecast
  • Market segmentation
  • Geographical insights
  • Competitive landscape

Interested in this report?

Get your sample now to see our research methodology and insights!

Download Now

Frequently Asked Questions

Esg Data Verification Services market growth will increase by USD 4085.8 million during 2026-2030.

The Esg Data Verification Services market is expected to grow at a CAGR of 29.2% during 2026-2030.

Esg Data Verification Services market is segmented by Application (Corporates and issuers, Asset managers, Government and regulators, Others) Business segment (Large enterprises, Small and medium enterprises) Deployment (On premise, Cloud based)

British Standards Institution, Bureau Veritas, DEKRA SE, Deloitte Touche Tohmatsu Ltd., DNV Group AS, EcoVadis SAS, ERM Group Inc., Ernst and Young Global Ltd., Forvis Mazars Group, Intertek Group Plc, KPMG International Ltd., LRQA Group Ltd., Microsoft Corp., PricewaterhouseCoopers LLP, S and P Global Inc., Salesforce Inc., SGS SA, Sustainalytics., UL LLC, WSP Global Inc. are a few of the key vendors in the Esg Data Verification Services market.

North America will register the highest growth rate of 33.6% among the other regions. Therefore, the Esg Data Verification Services market in North America is expected to garner significant business opportunities for the vendors during the forecast period.

US, Canada, Mexico, China, Japan, Australia, India, South Korea, Indonesia, Germany, UK, France, The Netherlands, Italy, Spain, Brazil, Argentina, Chile, UAE, South Africa, Saudi Arabia, Egypt, Turkey

  • Escalating regulatory mandates and global standardization is the driving factor this market.

The Esg Data Verification Services market vendors should focus on grabbing business opportunities from the Application segment as it accounted for the largest market share in the base year.
RIA - Research AI Assistant
Ask RIA