
Esoteric Testing Market Analysis, Size, and Forecast 2026-2030: North America (US, Canada, and Mexico), Europe (Germany, UK, and France), Asia (China, Japan, and India), South America (Brazil, Argentina, and Chile), Middle East and Africa (Saudi Arabia, South Africa, and Israel), Rest of World (ROW)

Esoteric Testing Market Analysis, Size, and Forecast 2026-2030:
North America (US, Canada, and Mexico), Europe (Germany, UK, and France), Asia (China, Japan, and India), South America (Brazil, Argentina, and Chile), Middle East and Africa (Saudi Arabia, South Africa, and Israel), Rest of World (ROW)

Published: Oct 2026 307 Pages SKU: IRTNTR76289

Market Overview at a Glance

$31.47 B
Market Opportunity
13.3%
CAGR 2025 - 2030
37.6%
North America Growth
$10.07 B
Infectious disease segment 2024

Esoteric Testing Market Size 2026-2030

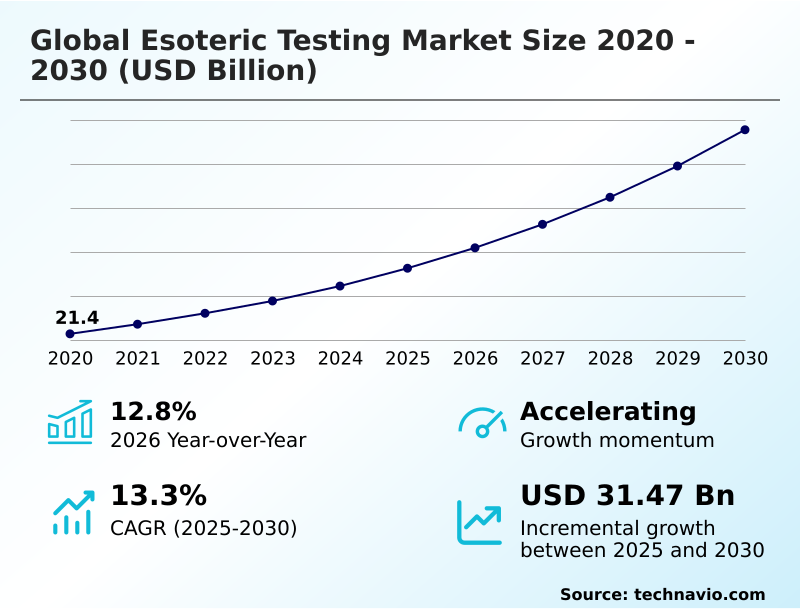
The esoteric testing market size is valued to increase by USD 31.47 billion, at a CAGR of 13.3% from 2025 to 2030. Rising global prevalence of rare diseases and complex chronic pathologies will drive the esoteric testing market.

Major Market Trends & Insights

  • North America dominated the market and accounted for a 37.6% growth during the forecast period.
  • By Type - Infectious disease segment was valued at USD 10.07 billion in 2024
  • By End-user - Hospital laboratories segment accounted for the largest market revenue share in 2024

Market Size & Forecast

  • Market Opportunities: USD 46.38 billion
  • Market Future Opportunities: USD 31.47 billion
  • CAGR from 2025 to 2030 : 13.3%

Market Summary

  • The Esoteric Testing Market demonstrates robust expansion driven by an escalating clinical requirement for high-resolution phenotypic and genotypic data. The persistent rise in rare genetic anomalies acts as a primary catalyst, compelling healthcare institutions to adopt highly specific molecular assays to guide precise therapeutic interventions.
  • For instance, hospital networks increasingly outsource high-complexity ambulatory outreach and specialized anatomical pathology to centralized reference organizations. This strategic delegation allows acute care facilities to capture substantial economies of scale, improving diagnostic turnaround efficiency by nearly 20% while circumventing direct technology replacement overhead.
  • However, the requirement for exorbitant initial capital investments and expensive proprietary reagents creates formidable barriers to entry within the Esoteric Testing Market, restricting widespread localized capacity. These financial hurdles compel smaller diagnostic centers to rely on international referral networks to maintain clinical service continuity. Ultimately, the relentless pursuit of precision medicine necessitates scaled diagnostic networks capable of absorbing structural costs.

What will be the Size of the Esoteric Testing Market during the forecast period?
Get Key Insights on Market Forecast (PDF) Get Free Sample

How is the Esoteric Testing Market Segmented?

The esoteric testing industry research report provides comprehensive data (region-wise segment analysis), with forecasts and estimates in "USD million" for the period 2026-2030, as well as historical data from 2020-2024 for the following segments.

  • Type
    • Infectious disease
    • Endocrinology
    • Oncology
    • Immunology
    • Others
  • End-user
    • Hospital laboratories
    • Clinical research laboratories
    • Reference laboratories
  • Technology
    • Immunoassays
    • PCR
    • Mass spectrometry
    • Flow cytometry
    • Others
  • Geography
    • North America
      • US
      • Canada
      • Mexico
    • Europe
      • Germany
      • UK
      • France
      • Italy
      • Spain
      • The Netherlands
    • Asia
      • China
      • Japan
      • India
      • South Korea
      • Singapore
      • Thailand
    • Rest of World (ROW)

By Type Insights

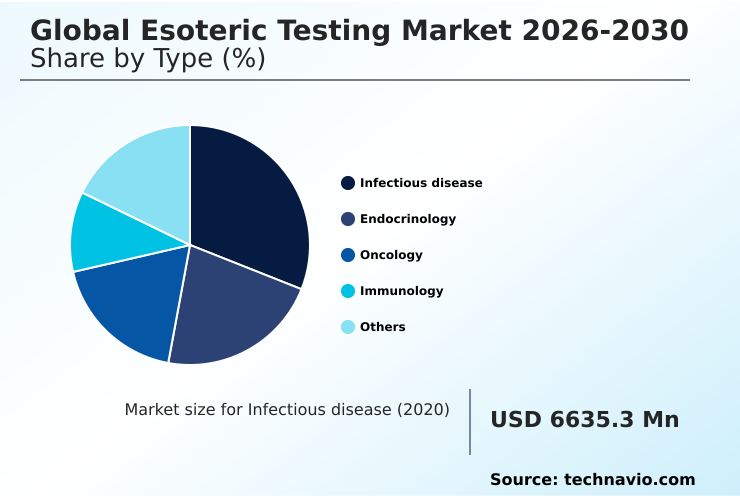
The infectious disease segment is estimated to witness significant growth during the forecast period.

The infectious disease segment within the Esoteric Testing relies on sophisticated methodologies like next-generation sequencing and multiplex molecular diagnostics to isolate elusive pathogens. Standard cultures often fail against fastidious intracellular organisms.

Consequently, reference laboratories deploy metagenomic microbial identification to ascertain genetic variations and detect latent viral reservoirs. Integrating these high-complexity assays improves clinical decision-making, allowing targeted antimicrobial stewardship interventions that reduce unnecessary pharmaceutical administration by up to 25%.

This precision ultimately decreases prolonged hospital stays and lowers overarching healthcare costs. To address complex endocrinological and oncological overlap, laboratories incorporate liquid chromatography mass spectrometry and flow cytometric immunophenotyping to differentiate congenital adrenal hyperplasia from neuroendocrine tumors.

Furthermore, analyzing circulating tumor deoxyribonucleic acid provides critical systemic insights, solidifying the operational reliance on specialized diagnostic hubs.
Get Free Sample

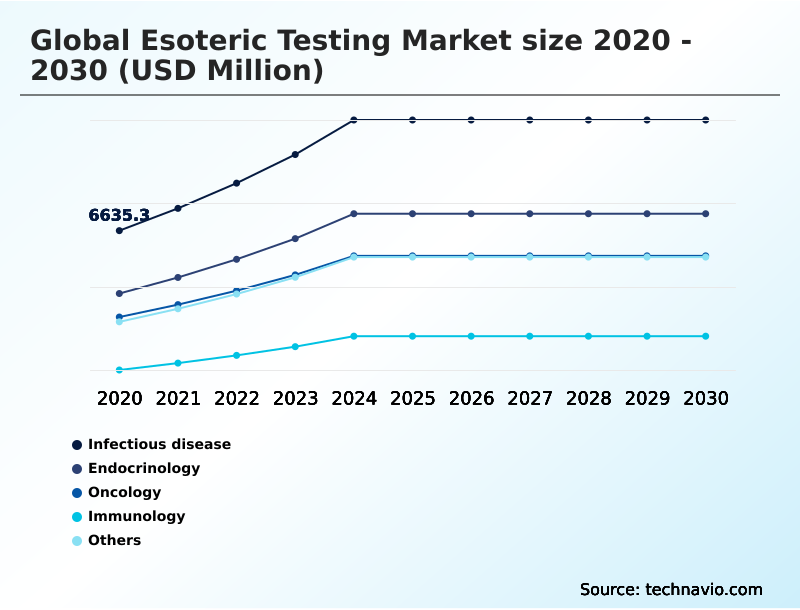
The Infectious disease segment was valued at USD 10.07 billion in 2024 and showed a gradual increase during the forecast period.
Get Free Sample

Regional Analysis

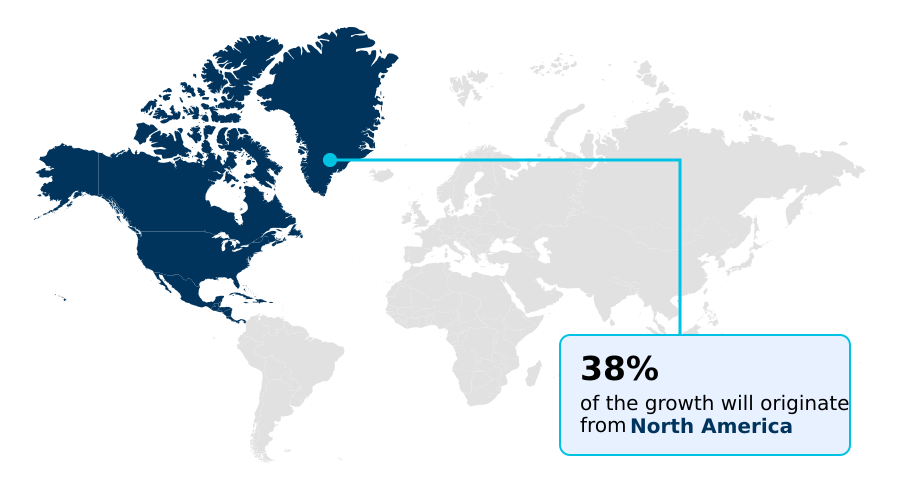
North America is estimated to contribute 37.6% to the growth of the global market during the forecast period.Technavio’s analysts have elaborately explained the regional trends and drivers that shape the market during the forecast period.
See How Esoteric Testing Market Demand is Rising in North America Get Free Sample

The geographic landscape of the Esoteric Testing highlights a stark contrast in diagnostic capabilities between North America and Rest of World territories.

North America maintains a dominant operational footprint, capturing over 37% of regional incrementality due to extensive investments in multigene panels and tandem mass spectrometry infrastructure.

This density enables clinical networks to lower outsourcing costs by roughly 18% compared to decentralized regions. Conversely, Rest of World markets frequently lack domestic capacity for digital droplet polymerase chain reaction and high-resolution radioimmunoassay, necessitating a hub-and-spoke distribution model.

Providers utilize equilibrium dialysis to identify primary immunodeficiency disorders accurately.

Furthermore, the regional integration of cell-free deoxyribonucleic acid profiling accelerates the detection of minimal residual disease, allowing clinicians to optimize the deployment of kinase inhibitors and targeted immunotherapies with a 22% higher success rate.

Market Dynamics

Our researchers analyzed the data with 2025 as the base year, along with the key drivers, trends, and challenges. A holistic analysis of drivers will help companies refine their marketing strategies to gain a competitive advantage.

  • The operational architecture of the Esoteric Testing Market requires sophisticated clinical platforms to interpret complex biological data effectively. Diagnostic laboratories face constant pressure to integrate high-complexity assays that deliver unparalleled accuracy for nuanced clinical presentations. For example, executing sub-physiological hormone concentration analysis demands rigorous prepurification protocols and ultra-sensitive detection equipment that outpace the capabilities of routine metabolic panels.
  • Consequently, healthcare administrators increasingly centralize these advanced diagnostics, achieving nearly double the analytical efficiency compared to decentralized hospital facilities. This centralization fundamentally optimizes supply chain logistics for specialized reagents and specialized personnel deployment. Furthermore, complex autoimmune disease cascades detection relies heavily on multiplex bead arrays and cell-based assays to prevent false classifications in systemic rheumatologic diseases.
  • To support clinical trials and translational pharmacology, contract research organizations heavily depend on narrow-therapeutic-index immunosuppressant monitoring to ensure patient safety and quantify intricate pharmacokinetic responses. Such specialized monitoring reduces adverse pharmacological events by a significant margin compared to unmonitored treatment pathways.
  • Simultaneously, rare genetic disorder sequencing methodologies utilizing whole exome sequencing provide essential insights into inherited anomalies, fundamentally guiding individualized therapeutic interventions. The integration of these highly specialized procedures ensures that commercial reference laboratories remain indispensable for modern medical decision-making and precision healthcare delivery.
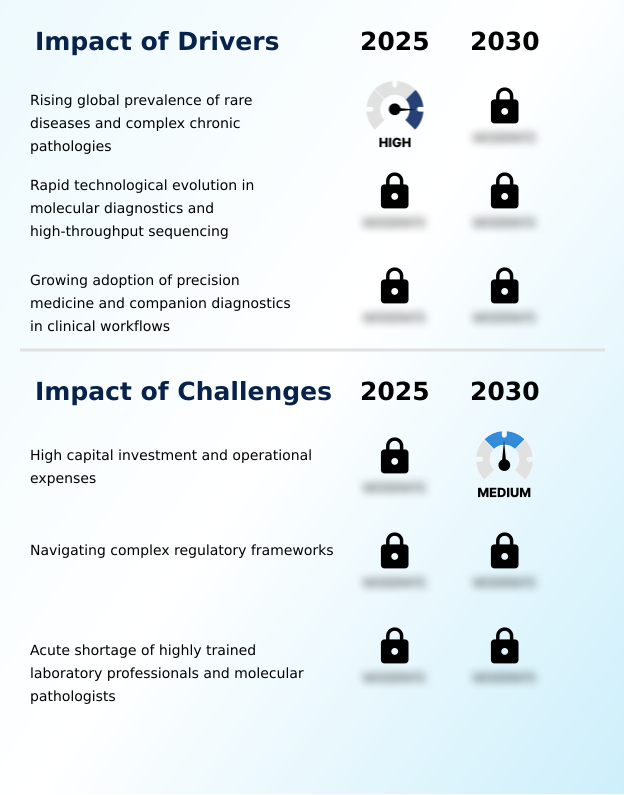
What are the key market drivers leading to the rise in the adoption of Esoteric Testing Industry?

  • The escalating incidence of rare diseases and complex chronic pathologies necessitates highly specialized diagnostic interventions, serving as the primary catalyst for diagnostic capacity expansion.

  • The escalating demand for precision medicine protocols accelerates expansion across the Esoteric Testing Market. Medical professionals increasingly require definitive molecular signatures to guide individualized therapeutic interventions, relying heavily on companion diagnostics and longitudinal biomarker quantification.
  • Implementing indirect immunofluorescence and cell-based transfection assays allows practitioners to pinpoint obscure autoimmune pathologies accurately. This targeted diagnostic approach reduces ineffective pharmaceutical administration by approximately 20% and lowers adverse drug reaction incidents by up to 15%.
  • To ensure rigorous biomarker verification and identify accurate surrogate endpoints, clinical networks integrate multiplex bead arrays and chromosomal microarray analysis under good clinical laboratory practice standards.
  • Furthermore, the adoption of fluorescence in situ hybridization empowers oncologists with vital genetic structural data, enabling healthcare networks to achieve superior clinical outcomes and optimize overarching treatment efficiency.

What are the market trends shaping the Esoteric Testing Industry?

  • The integration of artificial intelligence and machine learning algorithms for complex data interpretation represents a pivotal operational shift. This technological adoption fundamentally enhances the speed and accuracy of diagnostic bioinformatics.

  • The transition toward comprehensive multi-omics analysis fundamentally reshapes the Esoteric Testing Market. Clinical institutions are shifting away from single-modality testing in favor of integrated systems-biology approaches. This systemic adoption of high-order multiplex amplification and quantitative reverse transcription enhances the identification of multifactorial disease mechanisms.
  • By utilizing these advanced frameworks, diagnostic providers have improved rare biomarker detection rates by nearly 40% and reduced subsequent diagnostic iterations by approximately 25%. Translating these innovations into translational pharmacology requires single-molecule digital enzyme-linked assays to detect synthetic xenobiotics effectively. Furthermore, laboratories actively deploy chemiluminescence platforms and electrochemiluminescence systems to advance neurodegenerative biomarker profiling.
  • This technological synergy accelerates the definitive diagnosis of complex conditions like autoimmune encephalitis and paraneoplastic neurological syndromes, ensuring that reference laboratories maintain competitive differentiation and deliver holistic patient profiling.

What challenges does the Esoteric Testing Industry face during its growth?

  • Exorbitant capital requirements for sophisticated analytical platforms and the ongoing burden of high operational expenses significantly impede widespread diagnostic infrastructure expansion.

  • The Esoteric Testing Market encounters substantial structural limitations due to the exorbitant operational expenses associated with high-complexity diagnostic infrastructure. Procuring sophisticated analytical instrumentation like ultra-sensitive single-molecule immunoassay platforms places immense financial strain on decentralized clinical facilities. Implementing optical genome mapping and somatic genomic screening demands significant capital, often elevating cost per test by over 50% compared to routine diagnostic panels.
  • Accurately assessing pharmacodynamic responses and identifying inborn errors of metabolism requires extensive bioinformatic variant interpretation, extending assay commercialization timelines by an average of 18 months. Furthermore, interpreting complex cellular data for hematologic malignancies necessitates advanced fluorochrome unmixing algorithms.
  • The acute shortage of highly trained molecular pathologists to manage these computational demands forces diagnostic organizations to consolidate testing volumes within centralized reference hubs to maintain financial viability.

Exclusive Technavio Analysis on Customer Landscape

The esoteric testing market forecasting report includes the adoption lifecycle of the market, covering from the innovator’s stage to the laggard’s stage. It focuses on adoption rates in different regions based on penetration. Furthermore, the esoteric testing market report also includes key purchase criteria and drivers of price sensitivity to help companies evaluate and develop their market growth analysis strategies.
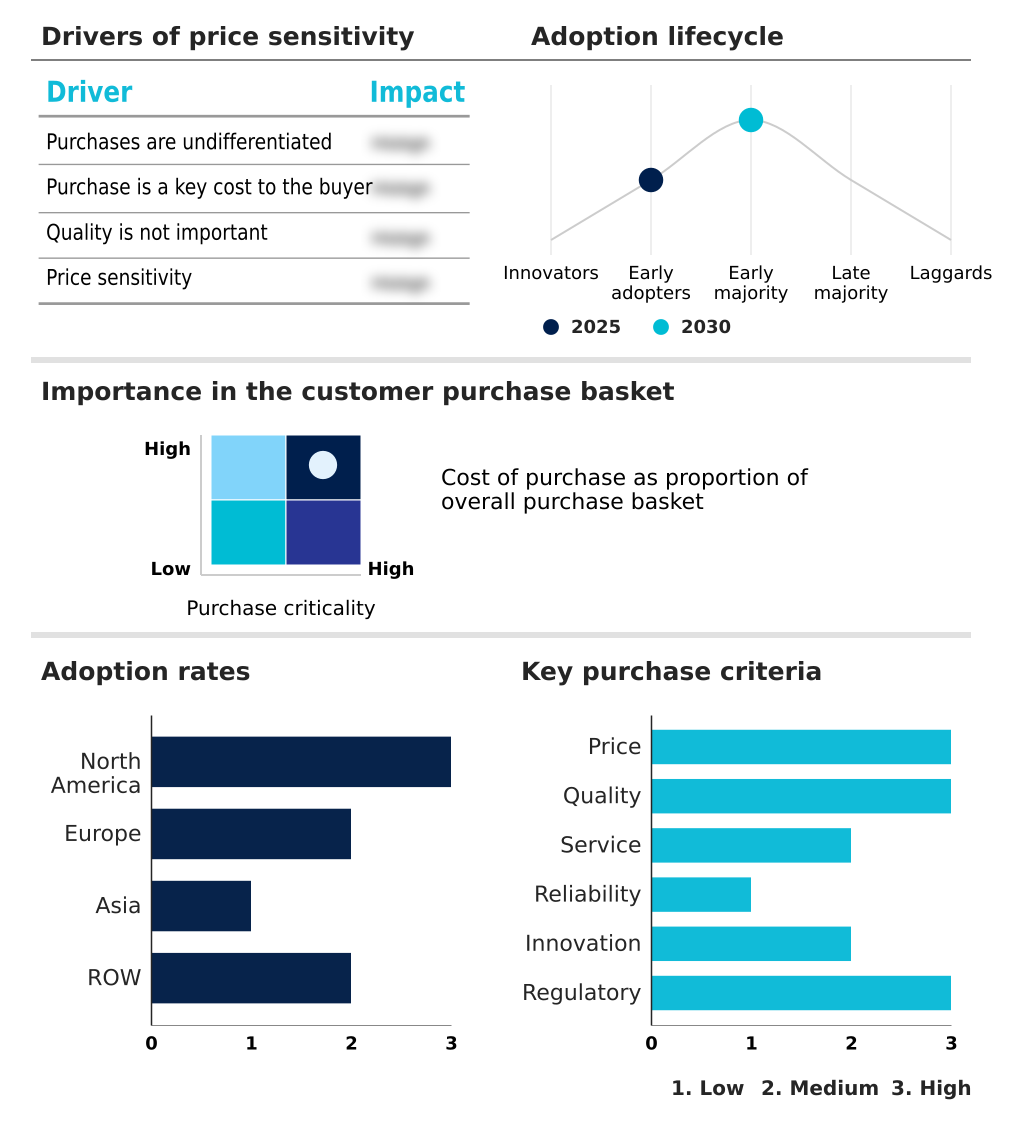
Customer Landscape of Esoteric Testing Industry

Competitive Landscape

Companies are implementing various strategies, such as strategic alliances, esoteric testing market forecast, partnerships, mergers and acquisitions, geographical expansion, and product/service launches, to enhance their presence in the industry.

Agendia Inc. - The provider offers specialized genomic breast cancer recurrence risk assessments and molecular subtype analysis assays to facilitate precise clinical treatment decisions and prognosis evaluations.

The industry research and growth report includes detailed analyses of the competitive landscape of the market and information about key companies, including:

  • Agendia Inc.
  • Ambry Genetics
  • ARUP Laboratories
  • BioReference Laboratories Inc.
  • Caris Life Sciences Inc.
  • Castle Biosciences Inc.
  • Cerba HealthCare
  • Eurofins Scientific SE
  • Exact Sciences Corp.
  • HU Group Holdings Inc.
  • Laboratory Holdings Inc.
  • Mayo Medical Laboratories
  • Myriad Genetics Inc.
  • Natera Inc.
  • NeoGenomics Laboratories Inc.
  • Quest Diagnostics Inc.
  • Sonic Healthcare Ltd.
  • SYNLAB International GmbH
  • Tempus AI Inc.
  • Unilabs AB

Qualitative and quantitative analysis of companies has been conducted to help clients understand the wider business environment as well as the strengths and weaknesses of key industry players. Data is qualitatively analyzed to categorize companies as pure play, category-focused, industry-focused, and diversified; it is quantitatively analyzed to categorize companies as dominant, leading, strong, tentative, and weak.

Recent Development and News in Esoteric testing market

  • In the Life Sciences Tools and Services industry, the implementation of the In Vitro Diagnostic Medical Devices Regulation (IVDR) imposed stringent clinical validation mandates, directly impacting Esoteric Testing demand by requiring laboratories to invest heavily in upgraded quality management systems to achieve a 100% compliance threshold for proprietary laboratory-developed assays.
  • The rapid adoption of next-generation sequencing platforms accelerated the decentralization of genomic profiling, shifting how Esoteric Testing services are delivered by enabling regional facilities to process high-throughput sequencing arrays and reduce outsourcing expenditures by approximately 15%.
  • Supply chain consolidations involving critical semiconductor components restricted the availability of high-resolution mass spectrometry instruments, constraining operational expansion for Esoteric Testing laboratories and increasing the average backlog of specialized toxicology screenings by up to 20% across affected academic medical networks.
  • The integration of AI-driven workflow interoperability standards optimized biological data processing efficiency, transforming Esoteric Testing capabilities by automating fluorochrome unmixing algorithms and bioinformatic variant interpretation to cut diagnostic reporting turnaround times by nearly 30% for complex hematologic malignancies.

Dive into Technavio’s robust research methodology, blending expert interviews, extensive data synthesis, and validated models for unparalleled Esoteric Testing Market insights. See full methodology.

Market Scope
Page number 307
Base year 2025
Historic period 2020-2024
Forecast period 2026-2030
Growth momentum & CAGR Accelerate at a CAGR of 13.3%
Market growth 2026-2030 USD 31469.9 million
Market structure Fragmented
YoY growth 2025-2026(%) 12.8%
Key countries US, Canada, Mexico, Germany, UK, France, Italy, Spain, The Netherlands, China, Japan, India, South Korea, Singapore, Thailand, Brazil, Saudi Arabia, South Africa, Israel, UAE, Argentina, Chile and Egypt
Competitive landscape Leading Companies, Market Positioning of Companies, Competitive Strategies, and Industry Risks

Request Free Sample

Research Analyst Overview

  • The Esoteric Testing Market exhibits a structural evolution propelled by the transition toward precision oncology and rare disease characterization. Healthcare administrators increasingly prioritize investments in high-throughput analytical platforms to manage complex specimen volumes.
  • The integration of cell-free deoxyribonucleic acid and circulating tumor deoxyribonucleic acid liquid biopsy assays directly influences strategic budgeting, shifting capital away from invasive surgical diagnostic suites toward outpatient molecular profiling. This operational pivot reduces inpatient diagnostic admission times by approximately 30%, optimizing overall clinical resource allocation.
  • Furthermore, the adoption of digital droplet polymerase chain reaction and single-molecule digital enzyme-linked assays provides unparalleled analytical sensitivity. Laboratories simultaneously deploy chemiluminescence platforms to quantify elusive disease markers. To navigate stringent regulatory frameworks, premier reference networks utilize optical genome mapping and fluorescence in situ hybridization.
  • These strategic technology acquisitions ensure that diagnostic organizations maintain resilient clinical supply chains and deliver definitive molecular insights.

What are the Key Data Covered in this Esoteric Testing Market Research and Growth Report?

  • What is the expected growth of the Esoteric Testing Market between 2026 and 2030?

    • USD 31.47 billion, at a CAGR of 13.3%

  • What segmentation does the market report cover?

    • The report is segmented by Type (Infectious disease, Endocrinology, Oncology, Immunology, and Others), End-user (Hospital laboratories, Clinical research laboratories, and Reference laboratories), Technology (Immunoassays, PCR, Mass spectrometry, Flow cytometry, and Others) and Geography (North America, Europe, Asia, Rest of World (ROW))

  • Which regions are analyzed in the report?

    • North America, Europe, Asia and Rest of World (ROW)

  • What are the key growth drivers and market challenges?

    • Rising global prevalence of rare diseases and complex chronic pathologies, High capital investment and operational expenses

  • Who are the major players in the Esoteric Testing Market?

    • Agendia Inc., Ambry Genetics, ARUP Laboratories, BioReference Laboratories Inc., Caris Life Sciences Inc., Castle Biosciences Inc., Cerba HealthCare, Eurofins Scientific SE, Exact Sciences Corp., HU Group Holdings Inc., Laboratory Holdings Inc., Mayo Medical Laboratories, Myriad Genetics Inc., Natera Inc., NeoGenomics Laboratories Inc., Quest Diagnostics Inc., Sonic Healthcare Ltd., SYNLAB International GmbH, Tempus AI Inc. and Unilabs AB

Market Research Insights

  • The Esoteric Testing Market operates as a critical infrastructure for specialized medical diagnostics, emphasizing the transition toward precision medicine. Clinical laboratories increasingly adopt ultra-sensitive single-molecule immunoassay platforms and somatic genomic screening to enhance diagnostic accuracy. This technological integration reduces erroneous clinical classifications by approximately 15%, directly lowering overarching patient management costs.
  • Furthermore, the deployment of targeted immunotherapies and companion diagnostics ensures tailored therapeutic interventions, improving successful treatment response rates by nearly 25% compared to generalized medical protocols. By optimizing clinical workflows with accurate biomarker verification, diagnostic organizations mitigate long-term operational risks.

We can help! Our analysts can customize this esoteric testing market research report to meet your requirements.

Get in touch

1. Executive Summary

1.1 Market overview

Executive Summary - Chart on Market Overview
Executive Summary - Data Table on Market Overview
Executive Summary - Chart on Global Market Characteristics
Executive Summary - Chart on Market by Geography
Executive Summary - Chart on Market Segmentation by Type
Executive Summary - Chart on Market Segmentation by End-user
Executive Summary - Chart on Market Segmentation by Technology
Executive Summary - Chart on Incremental Growth
Executive Summary - Data Table on Incremental Growth
Executive Summary - Chart on Company Market Positioning

2. Technavio Analysis

2.1 Analysis of price sensitivity, lifecycle, customer purchase basket, adoption rates, and purchase criteria

2.2 Criticality of inputs and Factors of differentiation

Chart on Overview on criticality of inputs and factors of differentiation

2.3 Factors of disruption

Chart on Overview on factors of disruption

2.4 Impact of drivers and challenges

Chart on Impact of drivers and challenges in 2025 and 2030

3. Market Landscape

3.1 Market ecosystem

Chart on Parent Market
Data Table on - Parent Market

3.2 Market characteristics

Chart on Market characteristics analysis

3.3 Value chain analysis

Chart on Value chain analysis

4. Market Sizing

4.1 Market definition

Data Table on Offerings of companies included in the market definition

4.2 Market segment analysis

Market segments

4.3 Market size 2025

4.4 Market outlook: Forecast for 2025-2030

Chart on Global - Market size and forecast 2025-2030 ($ million)
Data Table on Global - Market size and forecast 2025-2030 ($ million)
Chart on Global Market: Year-over-year growth 2025-2030 (%)
Data Table on Global Market: Year-over-year growth 2025-2030 (%)

5. Historic Market Size

5.1 Global Esoteric Testing Market 2020 - 2024

Historic Market Size - Data Table on Global Esoteric Testing Market 2020 - 2024 ($ million)

5.2 Type segment analysis 2020 - 2024

Historic Market Size - Type Segment 2020 - 2024 ($ million)

5.3 End-user segment analysis 2020 - 2024

Historic Market Size - End-user Segment 2020 - 2024 ($ million)

5.4 Technology segment analysis 2020 - 2024

Historic Market Size - Technology Segment 2020 - 2024 ($ million)

5.5 Geography segment analysis 2020 - 2024

Historic Market Size - Geography Segment 2020 - 2024 ($ million)

5.6 Country segment analysis 2020 - 2024

Historic Market Size - Country Segment 2020 - 2024 ($ million)

6. Qualitative Analysis

6.1 Impact of AI on Global Esoteric Testing Market

6.2 Impact of Geopolitical Conflicts on Global Esoteric Testing Market

7. Five Forces Analysis

7.1 Five forces summary

Five forces analysis - Comparison between 2025 and 2030

7.2 Bargaining power of buyers

Bargaining power of buyers - Impact of key factors 2025 and 2030

7.3 Bargaining power of suppliers

Bargaining power of suppliers - Impact of key factors in 2025 and 2030

7.4 Threat of new entrants

Threat of new entrants - Impact of key factors in 2025 and 2030

7.5 Threat of substitutes

Threat of substitutes - Impact of key factors in 2025 and 2030

7.6 Threat of rivalry

Threat of rivalry - Impact of key factors in 2025 and 2030

7.7 Market condition

Chart on Market condition - Five forces 2025 and 2030

8. Market Segmentation by Type

8.1 Market segments

Chart on Type - Market share 2025-2030 (%)
Data Table on Type - Market share 2025-2030 (%)

8.2 Comparison by Type

Chart on Comparison by Type
Data Table on Comparison by Type

8.3 Infectious disease - Market size and forecast 2025-2030

Chart on Infectious disease - Market size and forecast 2025-2030 ($ million)
Data Table on Infectious disease - Market size and forecast 2025-2030 ($ million)
Chart on Infectious disease - Year-over-year growth 2025-2030 (%)
Data Table on Infectious disease - Year-over-year growth 2025-2030 (%)

8.4 Endocrinology - Market size and forecast 2025-2030

Chart on Endocrinology - Market size and forecast 2025-2030 ($ million)
Data Table on Endocrinology - Market size and forecast 2025-2030 ($ million)
Chart on Endocrinology - Year-over-year growth 2025-2030 (%)
Data Table on Endocrinology - Year-over-year growth 2025-2030 (%)

8.5 Oncology - Market size and forecast 2025-2030

Chart on Oncology - Market size and forecast 2025-2030 ($ million)
Data Table on Oncology - Market size and forecast 2025-2030 ($ million)
Chart on Oncology - Year-over-year growth 2025-2030 (%)
Data Table on Oncology - Year-over-year growth 2025-2030 (%)

8.6 Immunology - Market size and forecast 2025-2030

Chart on Immunology - Market size and forecast 2025-2030 ($ million)
Data Table on Immunology - Market size and forecast 2025-2030 ($ million)
Chart on Immunology - Year-over-year growth 2025-2030 (%)
Data Table on Immunology - Year-over-year growth 2025-2030 (%)

8.7 Others - Market size and forecast 2025-2030

Chart on Others - Market size and forecast 2025-2030 ($ million)
Data Table on Others - Market size and forecast 2025-2030 ($ million)
Chart on Others - Year-over-year growth 2025-2030 (%)
Data Table on Others - Year-over-year growth 2025-2030 (%)

8.8 Market opportunity by Type

Market opportunity by Type ($ million)
Data Table on Market opportunity by Type ($ million)

9. Market Segmentation by End-user

9.1 Market segments

Chart on End-user - Market share 2025-2030 (%)
Data Table on End-user - Market share 2025-2030 (%)

9.2 Comparison by End-user

Chart on Comparison by End-user
Data Table on Comparison by End-user

9.3 Hospital laboratories - Market size and forecast 2025-2030

Chart on Hospital laboratories - Market size and forecast 2025-2030 ($ million)
Data Table on Hospital laboratories - Market size and forecast 2025-2030 ($ million)
Chart on Hospital laboratories - Year-over-year growth 2025-2030 (%)
Data Table on Hospital laboratories - Year-over-year growth 2025-2030 (%)

9.4 Clinical research laboratories - Market size and forecast 2025-2030

Chart on Clinical research laboratories - Market size and forecast 2025-2030 ($ million)
Data Table on Clinical research laboratories - Market size and forecast 2025-2030 ($ million)
Chart on Clinical research laboratories - Year-over-year growth 2025-2030 (%)
Data Table on Clinical research laboratories - Year-over-year growth 2025-2030 (%)

9.5 Reference laboratories - Market size and forecast 2025-2030

Chart on Reference laboratories - Market size and forecast 2025-2030 ($ million)
Data Table on Reference laboratories - Market size and forecast 2025-2030 ($ million)
Chart on Reference laboratories - Year-over-year growth 2025-2030 (%)
Data Table on Reference laboratories - Year-over-year growth 2025-2030 (%)

9.6 Market opportunity by End-user

Market opportunity by End-user ($ million)
Data Table on Market opportunity by End-user ($ million)

10. Market Segmentation by Technology

10.1 Market segments

Chart on Technology - Market share 2025-2030 (%)
Data Table on Technology - Market share 2025-2030 (%)

10.2 Comparison by Technology

Chart on Comparison by Technology
Data Table on Comparison by Technology

10.3 Immunoassays - Market size and forecast 2025-2030

Chart on Immunoassays - Market size and forecast 2025-2030 ($ million)
Data Table on Immunoassays - Market size and forecast 2025-2030 ($ million)
Chart on Immunoassays - Year-over-year growth 2025-2030 (%)
Data Table on Immunoassays - Year-over-year growth 2025-2030 (%)

10.4 PCR - Market size and forecast 2025-2030

Chart on PCR - Market size and forecast 2025-2030 ($ million)
Data Table on PCR - Market size and forecast 2025-2030 ($ million)
Chart on PCR - Year-over-year growth 2025-2030 (%)
Data Table on PCR - Year-over-year growth 2025-2030 (%)

10.5 Mass spectrometry - Market size and forecast 2025-2030

Chart on Mass spectrometry - Market size and forecast 2025-2030 ($ million)
Data Table on Mass spectrometry - Market size and forecast 2025-2030 ($ million)
Chart on Mass spectrometry - Year-over-year growth 2025-2030 (%)
Data Table on Mass spectrometry - Year-over-year growth 2025-2030 (%)

10.6 Flow cytometry - Market size and forecast 2025-2030

Chart on Flow cytometry - Market size and forecast 2025-2030 ($ million)
Data Table on Flow cytometry - Market size and forecast 2025-2030 ($ million)
Chart on Flow cytometry - Year-over-year growth 2025-2030 (%)
Data Table on Flow cytometry - Year-over-year growth 2025-2030 (%)

10.7 Others - Market size and forecast 2025-2030

Chart on Others - Market size and forecast 2025-2030 ($ million)
Data Table on Others - Market size and forecast 2025-2030 ($ million)
Chart on Others - Year-over-year growth 2025-2030 (%)
Data Table on Others - Year-over-year growth 2025-2030 (%)

10.8 Market opportunity by Technology

Market opportunity by Technology ($ million)
Data Table on Market opportunity by Technology ($ million)

11. Customer Landscape

11.1 Customer landscape overview

Analysis of price sensitivity, lifecycle, customer purchase basket, adoption rates, and purchase criteria

12. Geographic Landscape

12.1 Geographic segmentation

Chart on Market share by geography 2025-2030 (%)
Data Table on Market share by geography 2025-2030 (%)

12.2 Geographic comparison

Chart on Geographic comparison
Data Table on Geographic comparison

12.3 North America - Market size and forecast 2025-2030

Chart on North America - Market size and forecast 2025-2030 ($ million)
Data Table on North America - Market size and forecast 2025-2030 ($ million)
Chart on North America - Year-over-year growth 2025-2030 (%)
Data Table on North America - Year-over-year growth 2025-2030 (%)
Chart on Regional Comparison - North America
Data Table on Regional Comparison - North America

12.3.1 US - Market size and forecast 2025-2030

Chart on US - Market size and forecast 2025-2030 ($ million)
Data Table on US - Market size and forecast 2025-2030 ($ million)
Chart on US - Year-over-year growth 2025-2030 (%)
Data Table on US - Year-over-year growth 2025-2030 (%)

12.3.2 Canada - Market size and forecast 2025-2030

Chart on Canada - Market size and forecast 2025-2030 ($ million)
Data Table on Canada - Market size and forecast 2025-2030 ($ million)
Chart on Canada - Year-over-year growth 2025-2030 (%)
Data Table on Canada - Year-over-year growth 2025-2030 (%)

12.3.3 Mexico - Market size and forecast 2025-2030

Chart on Mexico - Market size and forecast 2025-2030 ($ million)
Data Table on Mexico - Market size and forecast 2025-2030 ($ million)
Chart on Mexico - Year-over-year growth 2025-2030 (%)
Data Table on Mexico - Year-over-year growth 2025-2030 (%)

12.4 Europe - Market size and forecast 2025-2030

Chart on Europe - Market size and forecast 2025-2030 ($ million)
Data Table on Europe - Market size and forecast 2025-2030 ($ million)
Chart on Europe - Year-over-year growth 2025-2030 (%)
Data Table on Europe - Year-over-year growth 2025-2030 (%)
Chart on Regional Comparison - Europe
Data Table on Regional Comparison - Europe

12.4.1 Germany - Market size and forecast 2025-2030

Chart on Germany - Market size and forecast 2025-2030 ($ million)
Data Table on Germany - Market size and forecast 2025-2030 ($ million)
Chart on Germany - Year-over-year growth 2025-2030 (%)
Data Table on Germany - Year-over-year growth 2025-2030 (%)

12.4.2 UK - Market size and forecast 2025-2030

Chart on UK - Market size and forecast 2025-2030 ($ million)
Data Table on UK - Market size and forecast 2025-2030 ($ million)
Chart on UK - Year-over-year growth 2025-2030 (%)
Data Table on UK - Year-over-year growth 2025-2030 (%)

12.4.3 France - Market size and forecast 2025-2030

Chart on France - Market size and forecast 2025-2030 ($ million)
Data Table on France - Market size and forecast 2025-2030 ($ million)
Chart on France - Year-over-year growth 2025-2030 (%)
Data Table on France - Year-over-year growth 2025-2030 (%)

12.4.4 Italy - Market size and forecast 2025-2030

Chart on Italy - Market size and forecast 2025-2030 ($ million)
Data Table on Italy - Market size and forecast 2025-2030 ($ million)
Chart on Italy - Year-over-year growth 2025-2030 (%)
Data Table on Italy - Year-over-year growth 2025-2030 (%)

12.4.5 Spain - Market size and forecast 2025-2030

Chart on Spain - Market size and forecast 2025-2030 ($ million)
Data Table on Spain - Market size and forecast 2025-2030 ($ million)
Chart on Spain - Year-over-year growth 2025-2030 (%)
Data Table on Spain - Year-over-year growth 2025-2030 (%)

12.4.6 The Netherlands - Market size and forecast 2025-2030

Chart on The Netherlands - Market size and forecast 2025-2030 ($ million)
Data Table on The Netherlands - Market size and forecast 2025-2030 ($ million)
Chart on The Netherlands - Year-over-year growth 2025-2030 (%)
Data Table on The Netherlands - Year-over-year growth 2025-2030 (%)

12.5 Asia - Market size and forecast 2025-2030

Chart on Asia - Market size and forecast 2025-2030 ($ million)
Data Table on Asia - Market size and forecast 2025-2030 ($ million)
Chart on Asia - Year-over-year growth 2025-2030 (%)
Data Table on Asia - Year-over-year growth 2025-2030 (%)
Chart on Regional Comparison - Asia
Data Table on Regional Comparison - Asia

12.5.1 China - Market size and forecast 2025-2030

Chart on China - Market size and forecast 2025-2030 ($ million)
Data Table on China - Market size and forecast 2025-2030 ($ million)
Chart on China - Year-over-year growth 2025-2030 (%)
Data Table on China - Year-over-year growth 2025-2030 (%)

12.5.2 Japan - Market size and forecast 2025-2030

Chart on Japan - Market size and forecast 2025-2030 ($ million)
Data Table on Japan - Market size and forecast 2025-2030 ($ million)
Chart on Japan - Year-over-year growth 2025-2030 (%)
Data Table on Japan - Year-over-year growth 2025-2030 (%)

12.5.3 India - Market size and forecast 2025-2030

Chart on India - Market size and forecast 2025-2030 ($ million)
Data Table on India - Market size and forecast 2025-2030 ($ million)
Chart on India - Year-over-year growth 2025-2030 (%)
Data Table on India - Year-over-year growth 2025-2030 (%)

12.5.4 South Korea - Market size and forecast 2025-2030

Chart on South Korea - Market size and forecast 2025-2030 ($ million)
Data Table on South Korea - Market size and forecast 2025-2030 ($ million)
Chart on South Korea - Year-over-year growth 2025-2030 (%)
Data Table on South Korea - Year-over-year growth 2025-2030 (%)

12.5.5 Singapore - Market size and forecast 2025-2030

Chart on Singapore - Market size and forecast 2025-2030 ($ million)
Data Table on Singapore - Market size and forecast 2025-2030 ($ million)
Chart on Singapore - Year-over-year growth 2025-2030 (%)
Data Table on Singapore - Year-over-year growth 2025-2030 (%)

12.5.6 Thailand - Market size and forecast 2025-2030

Chart on Thailand - Market size and forecast 2025-2030 ($ million)
Data Table on Thailand - Market size and forecast 2025-2030 ($ million)
Chart on Thailand - Year-over-year growth 2025-2030 (%)
Data Table on Thailand - Year-over-year growth 2025-2030 (%)

12.6 Rest of World (ROW) - Market size and forecast 2025-2030

Chart on Rest of World (ROW) - Market size and forecast 2025-2030 ($ million)
Data Table on Rest of World (ROW) - Market size and forecast 2025-2030 ($ million)
Chart on Rest of World (ROW) - Year-over-year growth 2025-2030 (%)
Data Table on Rest of World (ROW) - Year-over-year growth 2025-2030 (%)
Chart on Regional Comparison - Rest of World (ROW)
Data Table on Regional Comparison - Rest of World (ROW)

12.6.1 Brazil - Market size and forecast 2025-2030

Chart on Brazil - Market size and forecast 2025-2030 ($ million)
Data Table on Brazil - Market size and forecast 2025-2030 ($ million)
Chart on Brazil - Year-over-year growth 2025-2030 (%)
Data Table on Brazil - Year-over-year growth 2025-2030 (%)

12.6.2 Saudi Arabia - Market size and forecast 2025-2030

Chart on Saudi Arabia - Market size and forecast 2025-2030 ($ million)
Data Table on Saudi Arabia - Market size and forecast 2025-2030 ($ million)
Chart on Saudi Arabia - Year-over-year growth 2025-2030 (%)
Data Table on Saudi Arabia - Year-over-year growth 2025-2030 (%)

12.6.3 South Africa - Market size and forecast 2025-2030

Chart on South Africa - Market size and forecast 2025-2030 ($ million)
Data Table on South Africa - Market size and forecast 2025-2030 ($ million)
Chart on South Africa - Year-over-year growth 2025-2030 (%)
Data Table on South Africa - Year-over-year growth 2025-2030 (%)

12.6.4 Israel - Market size and forecast 2025-2030

Chart on Israel - Market size and forecast 2025-2030 ($ million)
Data Table on Israel - Market size and forecast 2025-2030 ($ million)
Chart on Israel - Year-over-year growth 2025-2030 (%)
Data Table on Israel - Year-over-year growth 2025-2030 (%)

12.6.5 UAE - Market size and forecast 2025-2030

Chart on UAE - Market size and forecast 2025-2030 ($ million)
Data Table on UAE - Market size and forecast 2025-2030 ($ million)
Chart on UAE - Year-over-year growth 2025-2030 (%)
Data Table on UAE - Year-over-year growth 2025-2030 (%)

12.6.6 Argentina - Market size and forecast 2025-2030

Chart on Argentina - Market size and forecast 2025-2030 ($ million)
Data Table on Argentina - Market size and forecast 2025-2030 ($ million)
Chart on Argentina - Year-over-year growth 2025-2030 (%)
Data Table on Argentina - Year-over-year growth 2025-2030 (%)

12.6.7 Chile - Market size and forecast 2025-2030

Chart on Chile - Market size and forecast 2025-2030 ($ million)
Data Table on Chile - Market size and forecast 2025-2030 ($ million)
Chart on Chile - Year-over-year growth 2025-2030 (%)
Data Table on Chile - Year-over-year growth 2025-2030 (%)

12.6.8 Egypt - Market size and forecast 2025-2030

Chart on Egypt - Market size and forecast 2025-2030 ($ million)
Data Table on Egypt - Market size and forecast 2025-2030 ($ million)
Chart on Egypt - Year-over-year growth 2025-2030 (%)
Data Table on Egypt - Year-over-year growth 2025-2030 (%)

12.7 Market opportunity by geography

Market opportunity by geography ($ million)
Data Tables on Market opportunity by geography ($ million)

13. Drivers, Challenges, and Opportunity

13.1 Market drivers

Rising global prevalence of rare diseases and complex chronic pathologies
Rapid technological evolution in molecular diagnostics and high-throughput sequencing
Growing adoption of precision medicine and companion diagnostics in clinical workflows

13.2 Market challenges

High capital investment and operational expenses
Navigating complex regulatory frameworks
Acute shortage of highly trained laboratory professionals and molecular pathologists

13.3 Impact of drivers and challenges

Impact of drivers and challenges in 2025 and 2030

13.4 Market opportunities

Integration of AI and machine learning in complex data interpretation
Proliferation of multi-omics approaches for holistic biological insights
Expansion of decentralized and patient-centric esoteric testing models

14. Competitive Landscape

14.1 Overview

14.2

Overview on criticality of inputs and factors of differentiation

14.3 Landscape disruption

Overview on factors of disruption

14.4 Industry risks

Impact of key risks on business

15. Competitive Analysis

15.1 Companies profiled

Companies covered

15.2 Company ranking index

15.3 Market positioning of companies

Matrix on companies position and classification

15.4 Agendia Inc.

Agendia Inc. - Overview
Agendia Inc. - Product / Service
Agendia Inc. - Key offerings
SWOT

15.5 Ambry Genetics

Ambry Genetics - Overview
Ambry Genetics - Product / Service
Ambry Genetics - Key offerings
SWOT

15.6 ARUP Laboratories

ARUP Laboratories - Overview
ARUP Laboratories - Product / Service
ARUP Laboratories - Key offerings
SWOT

15.7 BioReference Laboratories Inc.

BioReference Laboratories Inc. - Overview
BioReference Laboratories Inc. - Product / Service
BioReference Laboratories Inc. - Key offerings
SWOT

15.8 Cerba HealthCare

Cerba HealthCare - Overview
Cerba HealthCare - Product / Service
Cerba HealthCare - Key offerings
SWOT

15.9 Eurofins Scientific SE

Eurofins Scientific SE - Overview
Eurofins Scientific SE - Business segments
Eurofins Scientific SE - Key offerings
Eurofins Scientific SE - Segment focus
SWOT

15.10 HU Group Holdings Inc.

HU Group Holdings Inc. - Overview
HU Group Holdings Inc. - Product / Service
HU Group Holdings Inc. - Key offerings
SWOT

15.11 Laboratory Holdings Inc.

Laboratory Holdings Inc. - Overview
Laboratory Holdings Inc. - Business segments
Laboratory Holdings Inc. - Key offerings
Laboratory Holdings Inc. - Segment focus
SWOT

15.12 Mayo Medical Laboratories

Mayo Medical Laboratories - Overview
Mayo Medical Laboratories - Product / Service
Mayo Medical Laboratories - Key offerings
SWOT

15.13 Myriad Genetics Inc.

Myriad Genetics Inc. - Overview
Myriad Genetics Inc. - Product / Service
Myriad Genetics Inc. - Key offerings
SWOT

15.14 Quest Diagnostics Inc.

Quest Diagnostics Inc. - Overview
Quest Diagnostics Inc. - Business segments
Quest Diagnostics Inc. - Key offerings
Quest Diagnostics Inc. - Segment focus
SWOT

15.15 Sonic Healthcare Ltd.

Sonic Healthcare Ltd. - Overview
Sonic Healthcare Ltd. - Business segments
Sonic Healthcare Ltd. - Key offerings
Sonic Healthcare Ltd. - Segment focus
SWOT

15.16 SYNLAB International GmbH

SYNLAB International GmbH - Overview
SYNLAB International GmbH - Product / Service
SYNLAB International GmbH - Key offerings
SWOT

15.17 Tempus AI Inc.

Tempus AI Inc. - Overview
Tempus AI Inc. - Product / Service
Tempus AI Inc. - Key offerings
SWOT

15.18 Unilabs AB

Unilabs AB - Overview
Unilabs AB - Product / Service
Unilabs AB - Key offerings
SWOT

16. Appendix

16.1 Scope of the report

Market definition
Objectives
Notes and caveats

16.2 Inclusions and exclusions checklist

Inclusions checklist
Exclusions checklist

16.3 Currency conversion rates for US$

16.4 Research methodology

16.5 Data procurement

Information sources

16.6 Data validation

16.7 Validation techniques employed for market sizing

16.8 Data synthesis

16.9 360 degree market analysis

16.10 List of abbreviations

Research Methodology

Technavio presents a detailed picture of the market by way of study, synthesis, and summation of data from multiple sources. The analysts have presented the various facets of the market with a particular focus on identifying the key industry influencers. The data thus presented is comprehensive, reliable, and the result of extensive research, both primary and secondary.

INFORMATION SOURCES

Primary sources

  • Manufacturers and suppliers
  • Channel partners
  • Industry experts
  • Strategic decision makers

Secondary sources

  • Industry journals and periodicals
  • Government data
  • Financial reports of key industry players
  • Historical data
  • Press releases

DATA ANALYSIS

Data Synthesis

  • Collation of data
  • Estimation of key figures
  • Analysis of derived insights

Data Validation

  • Triangulation with data models
  • Reference against proprietary databases
  • Corroboration with industry experts

REPORT WRITING

Qualitative

  • Market drivers
  • Market challenges
  • Market trends
  • Five forces analysis

Quantitative

  • Market size and forecast
  • Market segmentation
  • Geographical insights
  • Competitive landscape

Interested in this report?

Get your sample now to see our research methodology and insights!

Download Now

Frequently Asked Questions

Esoteric Testing market growth will increase by USD 31469.9 million during 2026-2030.

The Esoteric Testing market is expected to grow at a CAGR of 13.3% during 2026-2030.

Esoteric Testing market is segmented by Type (Infectious disease, Endocrinology, Oncology, Immunology, Others) End-user (Hospital laboratories, Clinical research laboratories, Reference laboratories) Technology (Immunoassays, PCR, Mass spectrometry, Flow cytometry, Others)

Agendia Inc., Ambry Genetics, ARUP Laboratories, BioReference Laboratories Inc., Caris Life Sciences Inc., Castle Biosciences Inc., Cerba HealthCare, Eurofins Scientific SE, Exact Sciences Corp., HU Group Holdings Inc., Laboratory Holdings Inc., Mayo Medical Laboratories, Myriad Genetics Inc., Natera Inc., NeoGenomics Laboratories Inc., Quest Diagnostics Inc., Sonic Healthcare Ltd., SYNLAB International GmbH, Tempus AI Inc., Unilabs AB are a few of the key vendors in the Esoteric Testing market.

North America will register the highest growth rate of 37.6% among the other regions. Therefore, the Esoteric Testing market in North America is expected to garner significant business opportunities for the vendors during the forecast period.

US, Canada, Mexico, Germany, UK, France, Italy, Spain, The Netherlands, China, Japan, India, South Korea, Singapore, Thailand, Brazil, Saudi Arabia, South Africa, Israel, UAE, Argentina, Chile, Egypt

  • Rising global prevalence of rare diseases and complex chronic pathologies is the driving factor this market.

The Esoteric Testing market vendors should focus on grabbing business opportunities from the Type segment as it accounted for the largest market share in the base year.
RIA - Research AI Assistant
Ask RIA
