Ethernet Test Equipment Market Analysis, Size, and Forecast 2026-2030: North America (US, Canada, and Mexico), APAC (China, Japan, and South Korea), Europe (Germany, UK, and France), Middle East and Africa (Saudi Arabia, UAE, and South Africa), South America (Brazil, Argentina, and Chile), and Rest of World (ROW)

Ethernet Test Equipment Market Analysis, Size, and Forecast 2026-2030:
North America (US, Canada, and Mexico), APAC (China, Japan, and South Korea), Europe (Germany, UK, and France), Middle East and Africa (Saudi Arabia, UAE, and South Africa), South America (Brazil, Argentina, and Chile), and Rest of World (ROW)

Published: Oct 2026 295 Pages SKU: IRTNTR40510

Market Overview at a Glance

$801.9 Mn
Market Opportunity
6.1%
CAGR 2025 - 2030
34.3%
APAC Growth
$705.4 Mn
Automotive segment 2024

Ethernet Test Equipment Market Size 2026-2030

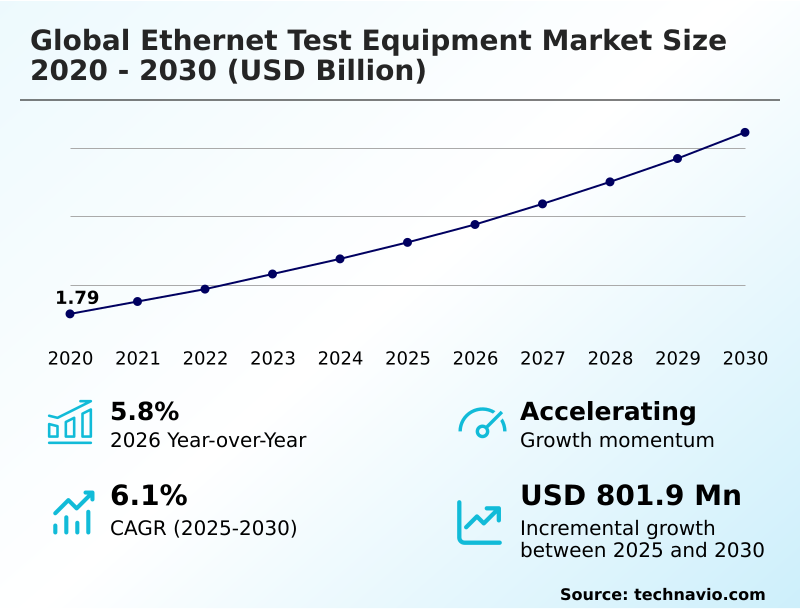
The ethernet test equipment market size is valued to increase by USD 801.9 million, at a CAGR of 6.1% from 2025 to 2030. Massive global proliferation of artificial intelligence workloads driving immediate high throughput back end network testing mandates will drive the ethernet test equipment market.

Major Market Trends & Insights

  • APAC dominated the market and accounted for a 34.3% growth during the forecast period.
  • By End-user - Automotive segment was valued at USD 705.4 million in 2024
  • By Product - Ten GbE segment accounted for the largest market revenue share in 2024

Market Size & Forecast

  • Market Opportunities: USD 1.32 billion
  • Market Future Opportunities: USD 801.9 million
  • CAGR from 2025 to 2030 : 6.1%

Market Summary

  • The Ethernet Test Equipment Market exhibits unprecedented expansion as data intensive processing environments demand flawless physical and protocol layer validation. In modern hyperscale computing facilities network administrators face immense pressure to prevent routing failures that disrupt mission critical operations.
  • To mitigate this risk operators deploy continuous automated validation loops that analyze synthetic traffic packets effectively reducing network diagnostic resolution times by 40% compared to traditional passive troubleshooting models.
  • The massive proliferation of artificial intelligence workloads functions as a primary demand driver compelling hardware developers to procure advanced bit error rate testers to ensure zero packet loss interconnectivity across graphic processing clusters.
  • Conversely structural validation impediments severely challenge deployment schedules as validating ultra high speed interfaces with complex pulse amplitude modulation exponentially increases hardware sensitivity to signal attenuation and clock jitter. Maintaining precise signal integrity analysis across high capacity links requires continuous technological refinement.
  • Consequently testing infrastructure must integrate sophisticated error correction evaluation algorithms to distinguish actual network anomalies from internal tool imperfections ensuring absolute transmission reliability.

What will be the Size of the Ethernet Test Equipment Market during the forecast period?
Get Key Insights on Market Forecast (PDF) Get Free Sample

How is the Ethernet Test Equipment Market Segmented?

The ethernet test equipment industry research report provides comprehensive data (region-wise segment analysis), with forecasts and estimates in "USD million" for the period 2026-2030, as well as historical data from 2020-2024 for the following segments.

  • End-user
    • Automotive
    • Telecommunication
    • Manufacturing
    • Others
  • Product
    • Ten GbE
    • One GbE
    • Forty GbE and above
  • Product type
    • Hardware
    • Software
    • Solutions
  • Geography
    • North America
      • US
      • Canada
      • Mexico
    • APAC
      • China
      • Japan
      • South Korea
      • India
      • Australia
      • Indonesia
    • Europe
      • Germany
      • UK
      • France
      • Italy
      • Spain
      • The Netherlands
    • Middle East and Africa
      • Saudi Arabia
      • UAE
      • South Africa
      • Israel
      • Turkey
    • South America
      • Brazil
      • Argentina
      • Chile

By End-user Insights

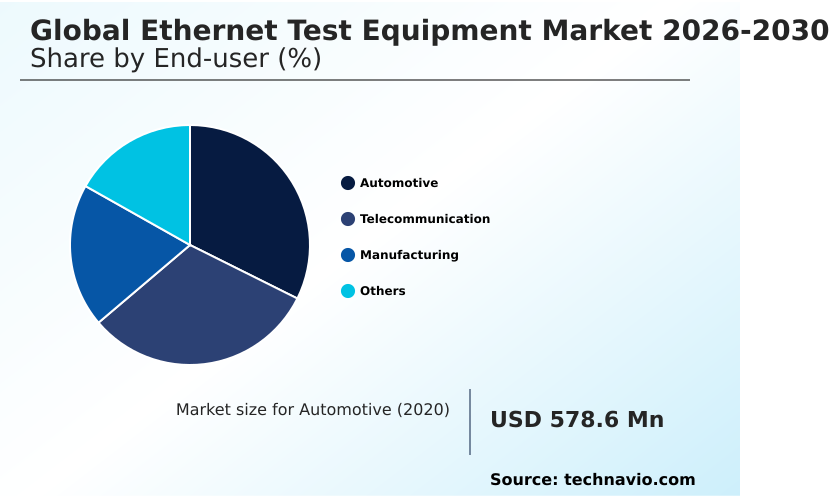
The automotive segment is estimated to witness significant growth during the forecast period.

The integration of software defined networking within modern vehicles has fundamentally reshaped automotive electronic architecture mandating rigorous signal integrity analysis for decentralized mobility platforms. As advanced driver assistance systems demand unprecedented bandwidth legacy buses fail to support deterministic latency control.

Consequently manufacturers are deploying specialized testing infrastructure across the industrial automation framework to execute precise return loss measurement and media dependent interface evaluations.

Validating these time sensitive networking protocols ensures that critical domains including the programmable logic controller and localized edge computing facility process massive telemetry data without destructive delay.

By implementing robust diagnostic software engineering teams have successfully improved packet error detection by 15%. This transition to multi gigabit backbones drives a 22% reduction in signal degradation proving that advanced diagnostic instrumentation is essential for securing autonomous transit ecosystems.
Get Free Sample

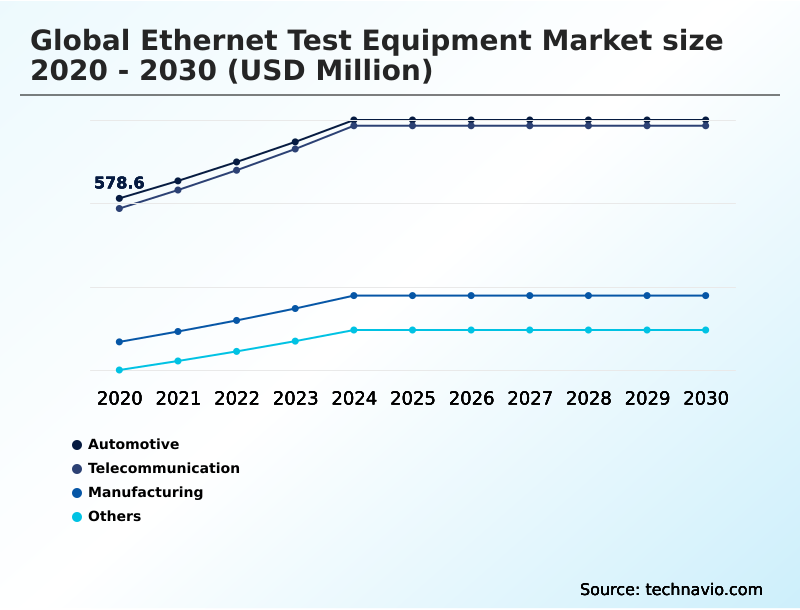
The Automotive segment was valued at USD 705.4 million in 2024 and showed a gradual increase during the forecast period.
Get Free Sample

Regional Analysis

APAC is estimated to contribute 34.3% to the growth of the global market during the forecast period.Technavio’s analysts have elaborately explained the regional trends and drivers that shape the market during the forecast period.
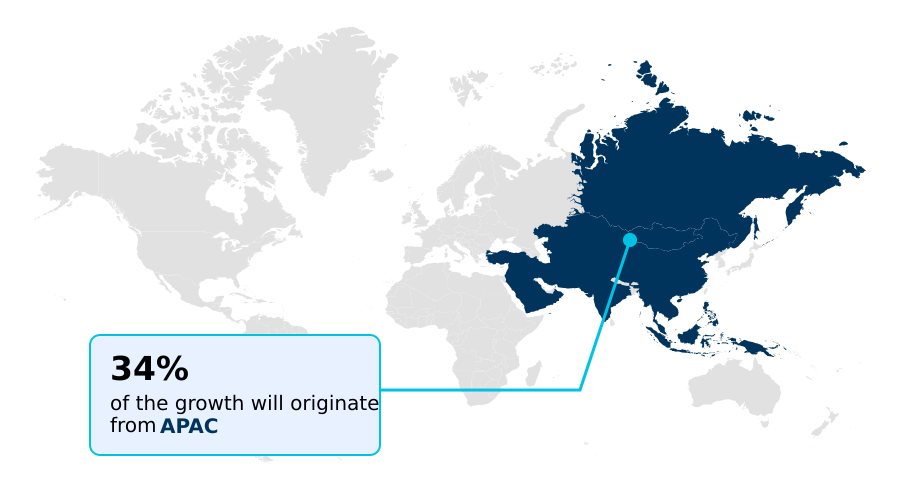
See How Ethernet Test Equipment Market Demand is Rising in APAC Get Free Sample

The geographic distribution of network validation infrastructure reveals profound contrasts between North America and APAC.

North America maintains a dominant infrastructure footprint due to aggressive hyperscale computing fabric deployments where automated diagnostic systems for throughput validation and latency measurement have accelerated data center commissioning speeds by 25%.

In contrast APAC demonstrates highly accelerated adoption rates driven by massive municipal smart grid initiatives and rapid 5G rollouts achieving a 30% reduction in production line downtime through specialized semiconductor fabrication testing.

While North American operators prioritize multi layer protocol analysis software to secure complex digital memory processing networks Asian hubs focus on network anomaly detection for robotics synchronization.

This divergence requires providers to deliver high density virtualized network emulator platforms to Western cloud providers while supplying ruggedized commercial avionics system testers to Eastern manufacturing centers ultimately improving global test efficiency by 18%.

Market Dynamics

Our researchers analyzed the data with 2025 as the base year, along with the key drivers, trends, and challenges. A holistic analysis of drivers will help companies refine their marketing strategies to gain a competitive advantage.

  • The contemporary telecommunications and enterprise networking sectors face an unprecedented architectural transformation compelling technology administrators to adopt highly sophisticated diagnostic methodologies. As data centers migrate toward extreme bandwidth capacities high speed optical fabric validation has become a mandatory compliance checkpoint for securing uninterrupted cloud service delivery.
  • Network engineering teams increasingly rely on rigorous time sensitive networking latency measurement to guarantee absolute synchronization across decentralized industrial arrays effectively yielding a 35% improvement in operational planning accuracy over legacy asynchronous protocols.
  • Furthermore the integration of complex machine learning algorithms necessitates hyperscale artificial intelligence traffic emulation allowing infrastructure developers to proactively stress test back end routing topologies before catastrophic bottlenecks emerge in live production environments. This proactive approach significantly reduces supply chain hardware replacement costs by isolating faulty transceivers during early stage deployment.
  • Simultaneously the rapid modernization of passenger vehicles requires comprehensive automotive in vehicle network diagnostics to verify the safety and real time responsiveness of advanced driver assistance matrices.
  • To support these ultra dense signaling requirements hardware engineers must execute meticulous pulse amplitude modulation signal integrity assessments ensuring that intricate multi level voltage transmissions remain resilient against severe thermal noise and localized electromagnetic interference ultimately establishing a robust foundation for next generation automated connectivity.
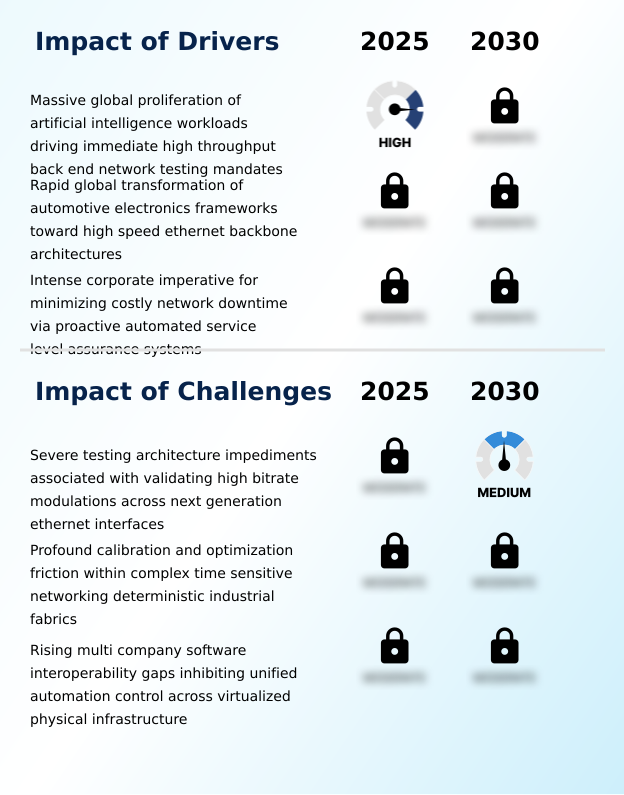
What are the key market drivers leading to the rise in the adoption of Ethernet Test Equipment Industry?

  • The massive proliferation of artificial intelligence workloads creates an immediate mandate for high throughput back end network testing to ensure optimal computational resource utilization and zero packet loss interconnectivity.

  • The explosive proliferation of processing workloads creates a massive immediate mandate for ultra low latency interconnect networks.
  • To support these massive computational matrices infrastructure operators deploy advanced traffic generator modules and a precise bit error rate tester to guarantee total fabric stability.
  • This intense corporate imperative to eliminate costly downtime forces enterprise administrators to execute continuous optical transceiver testing.
  • By adopting automated packet analyzer loops across the metropolitan communication exchange hyper connected institutions have successfully reduced catastrophic routing failures by 40% generating a 22% improvement in overall service assurance compliance.
  • This structural demand shock propels the rapid procurement of diagnostic arrays for the storage area network ensuring that high resolution data streams flow safely across the cloud scale backhaul.
  • Furthermore rigorous forward error correction and cybersecurity vulnerability testing protect every vital application programming interface from destructive transmission delays.

What are the market trends shaping the Ethernet Test Equipment Industry?

  • The widespread deployment of machine learning traffic generation models enables highly predictive anomaly detection analytics across complex network architectures. This structural shift provides operators with autonomous diagnostic capabilities that dynamically mirror real world production workloads.

  • The widespread integration of machine learning algorithms into edge based diagnostic hardware represents a structural paradigm shift in performance validation. Next generation instrumentation dynamically synthesizes chaotic data streams to evaluate near end crosstalk and structural anomalies across an artificial intelligence cluster effectively reflecting real world workloads.
  • This trend toward embedded intelligence allows network administrators to execute precise quality of service auditing autonomously during high bandwidth data streaming. By leveraging predictive analytics operators have improved critical fault prediction accuracy by 25% reducing resolution metrics by 35% compared to static methodologies. These efficiencies optimize resource allocation empowering administrators to streamline software defined networking deployments.
  • The rapid adoption of wireless distribution technology ensures seamless compliance across decentralized nodes enabling providers to cut localized optical carrier network transport costs while maintaining rigorous telemetry monitoring and hardware encryption validation for the digital financial network.

What challenges does the Ethernet Test Equipment Industry face during its growth?

  • Severe architectural impediments in validating high bitrate modulations across next generation interfaces present critical challenges for maintaining signal precision and mitigating localized electromagnetic interference.

  • Validating ultra high speed network interfaces introduces profound architectural impediments specifically when navigating the complexities of high density pulse amplitude modulation signaling. This sophisticated signaling mechanism exponentially increases hardware sensitivity to signal attenuation making accurate mode conversion evaluation highly difficult across the legacy copper backplane.
  • Diagnostic instrumentation must possess incredibly precise signal to noise ratios to distinguish anomalies during electromagnetic interference testing. Calibration friction within complex network functions virtualization environments frequently generates severe data fragmentation leading to a 30% increase in software interoperability failure rates across the open radio access network.
  • These testing barriers significantly delay final system commissioning reducing field deployment efficiency by 15% across the industrial internet of things. Consequently engineering teams face massive capital hurdles in developing highly sensitive error analysis chips capable of verifying absolute signal integrity across any dynamic tactical communication network.

Exclusive Technavio Analysis on Customer Landscape

The ethernet test equipment market forecasting report includes the adoption lifecycle of the market, covering from the innovator’s stage to the laggard’s stage. It focuses on adoption rates in different regions based on penetration. Furthermore, the ethernet test equipment market report also includes key purchase criteria and drivers of price sensitivity to help companies evaluate and develop their market growth analysis strategies.
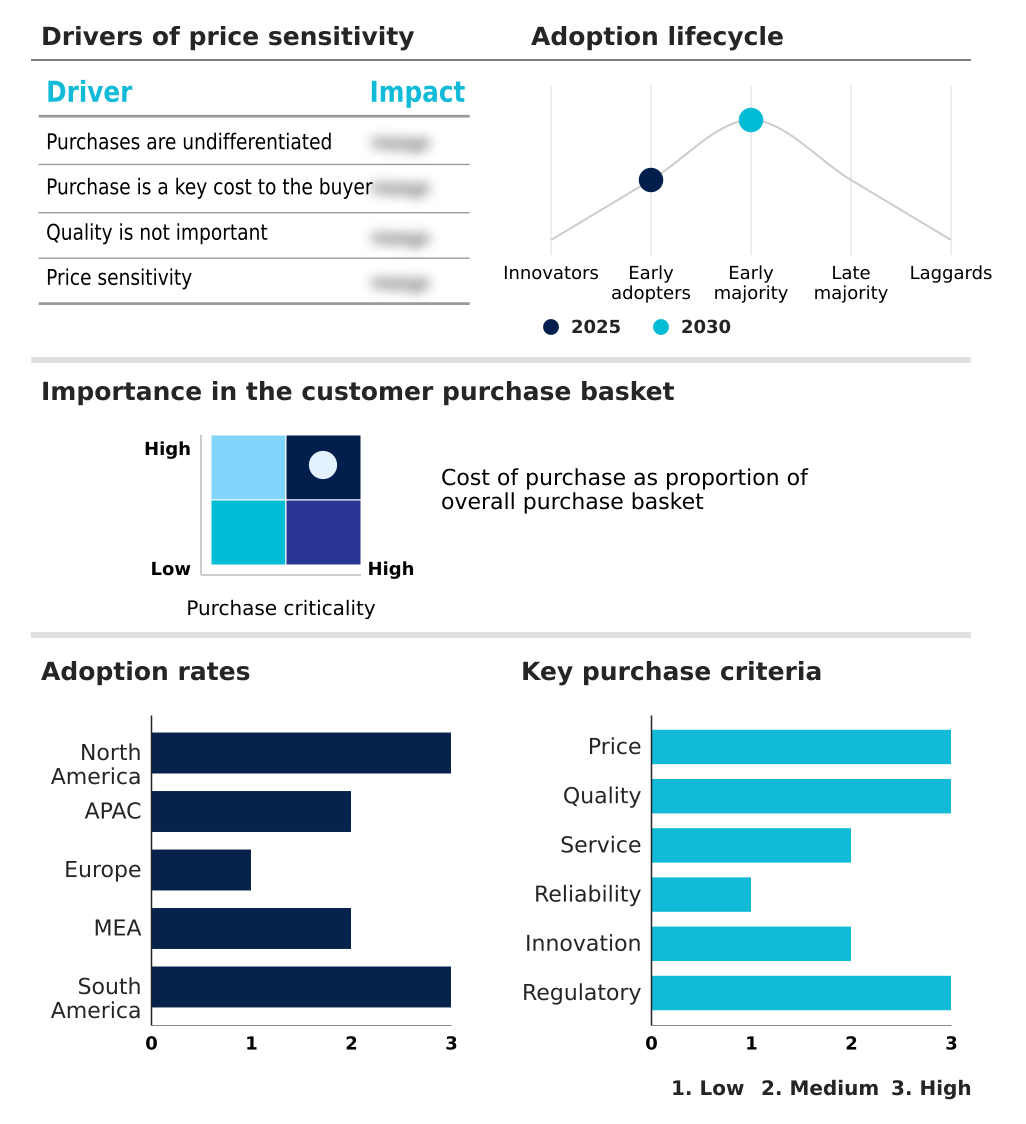
Customer Landscape of Ethernet Test Equipment Industry

Competitive Landscape

Companies are implementing various strategies, such as strategic alliances, ethernet test equipment market forecast, partnerships, mergers and acquisitions, geographical expansion, and product/service launches, to enhance their presence in the industry.

Anritsu Corp. - Advanced network validation platforms provide comprehensive throughput analysis traffic generation and latency tracking capabilities to ensure flawless protocol execution across complex computing fabrics.

The industry research and growth report includes detailed analyses of the competitive landscape of the market and information about key companies, including:

  • Anritsu Corp.
  • Apposite Technologies LLC
  • ByteBlower
  • Deviser Instruments Co Ltd
  • EXFO Inc.
  • Fortinet Inc.
  • GAO Tek Inc.
  • GL Communications Inc.
  • Ideal Networks Ltd
  • Keysight Technologies Inc.
  • National Instruments Corp.
  • NetAlly LLC
  • NetScout Systems Inc.
  • Rohde and Schwarz GmbH
  • Tektronix Inc.
  • Trend Networks Ltd
  • VeEX Inc.
  • Veryx Technologies Pvt Ltd
  • Viavi Solutions Inc.
  • Yokogawa Test and Measurement

Qualitative and quantitative analysis of companies has been conducted to help clients understand the wider business environment as well as the strengths and weaknesses of key industry players. Data is qualitatively analyzed to categorize companies as pure play, category-focused, industry-focused, and diversified; it is quantitatively analyzed to categorize companies as dominant, leading, strong, tentative, and weak.

Recent Development and News in Ethernet test equipment market

  • In the Electronic Equipment and Instruments industry the rapid deployment of massive artificial intelligence cluster architectures increased the mandatory requirement for advanced forward error correction validation directly impacting Ethernet Test Equipment demand by accelerating the procurement of high capacity traffic generator modules.
  • The universal transition toward industrial internet of things manufacturing protocols fundamentally altered factory floor electromagnetic interference testing requirements pulling substantial demand for ruggedized Ethernet Test Equipment capable of performing real time quality of service auditing within extreme thermal environments.
  • Strict compliance mandates surrounding tactical communication network security forced defense equipment manufacturers to overhaul baseline hardware encryption validation procedures directly escalating the utilization of specialized Ethernet Test Equipment to verify deterministic latency control across encrypted channels.
  • The architectural shift toward open radio access network infrastructure across global telecommunications required unprecedented synchronization accuracy between diverse baseband units thereby increasing Ethernet Test Equipment demand to ensure flawless protocol analysis software interoperability among multi vendor optical carrier network components.

Dive into Technavio’s robust research methodology, blending expert interviews, extensive data synthesis, and validated models for unparalleled Ethernet Test Equipment Market insights. See full methodology.

Market Scope
Page number 295
Base year 2025
Historic period 2020-2024
Forecast period 2026-2030
Growth momentum & CAGR Accelerate at a CAGR of 6.1%
Market growth 2026-2030 USD 801.9 million
Market structure Fragmented
YoY growth 2025-2026(%) 5.8%
Key countries US, Canada, Mexico, China, Japan, South Korea, India, Australia, Indonesia, Germany, UK, France, Italy, Spain, The Netherlands, Saudi Arabia, UAE, South Africa, Israel, Turkey, Brazil, Argentina and Chile
Competitive landscape Leading Companies, Market Positioning of Companies, Competitive Strategies, and Industry Risks

Request Free Sample

Research Analyst Overview

  • The architectural evolution of digital communications infrastructure forces enterprise executives to fundamentally reassess their capital expenditure strategies regarding physical layer diagnostics. As corporate boards demand absolute data reliability the integration of advanced network anomaly detection technologies directly informs strategic compliance and budgeting decisions.
  • By deploying intelligent traffic generator modules organizations proactively identify fiber connectivity faults resulting in a 40% reduction in unexpected network downtime compared to reactive maintenance workflows. This measurable business outcome highlights the operational necessity of continuous throughput validation across dense cloud environments.
  • Modern engineering teams utilize sophisticated bit error rate tester configurations to execute precise latency measurement and optical transceiver testing thereby de risking the deployment of ultra high speed interconnects. Furthermore the mandatory implementation of forward error correction evaluations enables infrastructure managers to guarantee flawless packet delivery.
  • Prioritizing robust packet analyzer solutions ensures that mission critical topologies remain resilient against severe signal attenuation proving that proactive network validation is an indispensable mechanism for safeguarding long term technological investments and maximizing structural processing efficiency.

What are the Key Data Covered in this Ethernet Test Equipment Market Research and Growth Report?

  • What is the expected growth of the Ethernet Test Equipment Market between 2026 and 2030?

    • USD 801.9 million, at a CAGR of 6.1%

  • What segmentation does the market report cover?

    • The report is segmented by End-user (Automotive, Telecommunication, Manufacturing, and Others), Product (Ten GbE, One GbE, and Forty GbE and above), Product Type (Hardware, Software, and Solutions) and Geography (North America, APAC, Europe, Middle East and Africa, South America)

  • Which regions are analyzed in the report?

    • North America, APAC, Europe, Middle East and Africa and South America

  • What are the key growth drivers and market challenges?

    • Massive global proliferation of artificial intelligence workloads driving immediate high throughput back end network testing mandates, Severe testing architecture impediments associated with validating high bitrate modulations across next generation ethernet interfaces

  • Who are the major players in the Ethernet Test Equipment Market?

    • Anritsu Corp., Apposite Technologies LLC, ByteBlower, Deviser Instruments Co Ltd, EXFO Inc., Fortinet Inc., GAO Tek Inc., GL Communications Inc., Ideal Networks Ltd, Keysight Technologies Inc., National Instruments Corp., NetAlly LLC, NetScout Systems Inc., Rohde and Schwarz GmbH, Tektronix Inc., Trend Networks Ltd, VeEX Inc., Veryx Technologies Pvt Ltd, Viavi Solutions Inc. and Yokogawa Test and Measurement

Market Research Insights

  • Advanced diagnostic frameworks fundamentally secure the operational stability of the modern hyperscale computing fabric and the expanding industrial internet of things. By integrating sophisticated telemetry monitoring protocols enterprise network operators achieve a 28% improvement in structural fault detection compared to legacy manual troubleshooting practices.
  • This transition toward automated validation reduces catastrophic downtime risks across critical storage area network infrastructure driving a 35% enhancement in overall data center return on investment. Furthermore as telecommunications providers rapidly scale cloud scale backhaul architectures continuous compliance testing ensures seamless interoperability.
  • The systematic deployment of high capacity diagnostic instrumentation accelerates the commissioning of metropolitan communication exchange nodes by 20% proving that proactive signal validation is essential for maintaining strict service level agreements and optimizing long term infrastructure performance.

We can help! Our analysts can customize this ethernet test equipment market research report to meet your requirements.

Get in touch

1. Executive Summary

1.1 Market overview

Executive Summary - Chart on Market Overview
Executive Summary - Data Table on Market Overview
Executive Summary - Chart on Global Market Characteristics
Executive Summary - Chart on Market by Geography
Executive Summary - Chart on Market Segmentation by End-user
Executive Summary - Chart on Market Segmentation by Product
Executive Summary - Chart on Market Segmentation by Product Type
Executive Summary - Chart on Incremental Growth
Executive Summary - Data Table on Incremental Growth
Executive Summary - Chart on Company Market Positioning

2. Technavio Analysis

2.1 Analysis of price sensitivity, lifecycle, customer purchase basket, adoption rates, and purchase criteria

2.2 Criticality of inputs and Factors of differentiation

Chart on Overview on criticality of inputs and factors of differentiation

2.3 Factors of disruption

Chart on Overview on factors of disruption

2.4 Impact of drivers and challenges

Chart on Impact of drivers and challenges in 2025 and 2030

3. Market Landscape

3.1 Market ecosystem

Chart on Parent Market
Data Table on - Parent Market

3.2 Market characteristics

Chart on Market characteristics analysis

3.3 Value chain analysis

Chart on Value chain analysis

4. Market Sizing

4.1 Market definition

Data Table on Offerings of companies included in the market definition

4.2 Market segment analysis

Market segments

4.3 Market size 2025

4.4 Market outlook: Forecast for 2025-2030

Chart on Global - Market size and forecast 2025-2030 ($ million)
Data Table on Global - Market size and forecast 2025-2030 ($ million)
Chart on Global Market: Year-over-year growth 2025-2030 (%)
Data Table on Global Market: Year-over-year growth 2025-2030 (%)

5. Historic Market Size

5.1 Global Ethernet Test Equipment Market 2020 - 2024

Historic Market Size - Data Table on Global Ethernet Test Equipment Market 2020 - 2024 ($ million)

5.2 End-user segment analysis 2020 - 2024

Historic Market Size - End-user Segment 2020 - 2024 ($ million)

5.3 Product segment analysis 2020 - 2024

Historic Market Size - Product Segment 2020 - 2024 ($ million)

5.4 Product Type segment analysis 2020 - 2024

Historic Market Size - Product Type Segment 2020 - 2024 ($ million)

5.5 Geography segment analysis 2020 - 2024

Historic Market Size - Geography Segment 2020 - 2024 ($ million)

5.6 Country segment analysis 2020 - 2024

Historic Market Size - Country Segment 2020 - 2024 ($ million)

6. Qualitative Analysis

6.1 Impact of AI on global ethernet test equipment market

6.2 Impact of geopolitical conflicts on global ethernet test equipment market

7. Five Forces Analysis

7.1 Five forces summary

Five forces analysis - Comparison between 2025 and 2030

7.2 Bargaining power of buyers

Bargaining power of buyers - Impact of key factors 2025 and 2030

7.3 Bargaining power of suppliers

Bargaining power of suppliers - Impact of key factors in 2025 and 2030

7.4 Threat of new entrants

Threat of new entrants - Impact of key factors in 2025 and 2030

7.5 Threat of substitutes

Threat of substitutes - Impact of key factors in 2025 and 2030

7.6 Threat of rivalry

Threat of rivalry - Impact of key factors in 2025 and 2030

7.7 Market condition

Chart on Market condition - Five forces 2025 and 2030

8. Market Segmentation by End-user

8.1 Market segments

Chart on End-user - Market share 2025-2030 (%)
Data Table on End-user - Market share 2025-2030 (%)

8.2 Comparison by End-user

Chart on Comparison by End-user
Data Table on Comparison by End-user

8.3 Automotive - Market size and forecast 2025-2030

Chart on Automotive - Market size and forecast 2025-2030 ($ million)
Data Table on Automotive - Market size and forecast 2025-2030 ($ million)
Chart on Automotive - Year-over-year growth 2025-2030 (%)
Data Table on Automotive - Year-over-year growth 2025-2030 (%)

8.4 Telecommunication - Market size and forecast 2025-2030

Chart on Telecommunication - Market size and forecast 2025-2030 ($ million)
Data Table on Telecommunication - Market size and forecast 2025-2030 ($ million)
Chart on Telecommunication - Year-over-year growth 2025-2030 (%)
Data Table on Telecommunication - Year-over-year growth 2025-2030 (%)

8.5 Manufacturing - Market size and forecast 2025-2030

Chart on Manufacturing - Market size and forecast 2025-2030 ($ million)
Data Table on Manufacturing - Market size and forecast 2025-2030 ($ million)
Chart on Manufacturing - Year-over-year growth 2025-2030 (%)
Data Table on Manufacturing - Year-over-year growth 2025-2030 (%)

8.6 Others - Market size and forecast 2025-2030

Chart on Others - Market size and forecast 2025-2030 ($ million)
Data Table on Others - Market size and forecast 2025-2030 ($ million)
Chart on Others - Year-over-year growth 2025-2030 (%)
Data Table on Others - Year-over-year growth 2025-2030 (%)

8.7 Market opportunity by End-user

Market opportunity by End-user ($ million)
Data Table on Market opportunity by End-user ($ million)

9. Market Segmentation by Product

9.1 Market segments

Chart on Product - Market share 2025-2030 (%)
Data Table on Product - Market share 2025-2030 (%)

9.2 Comparison by Product

Chart on Comparison by Product
Data Table on Comparison by Product

9.3 Ten GbE - Market size and forecast 2025-2030

Chart on Ten GbE - Market size and forecast 2025-2030 ($ million)
Data Table on Ten GbE - Market size and forecast 2025-2030 ($ million)
Chart on Ten GbE - Year-over-year growth 2025-2030 (%)
Data Table on Ten GbE - Year-over-year growth 2025-2030 (%)

9.4 One GbE - Market size and forecast 2025-2030

Chart on One GbE - Market size and forecast 2025-2030 ($ million)
Data Table on One GbE - Market size and forecast 2025-2030 ($ million)
Chart on One GbE - Year-over-year growth 2025-2030 (%)
Data Table on One GbE - Year-over-year growth 2025-2030 (%)

9.5 Forty GbE and above - Market size and forecast 2025-2030

Chart on Forty GbE and above - Market size and forecast 2025-2030 ($ million)
Data Table on Forty GbE and above - Market size and forecast 2025-2030 ($ million)
Chart on Forty GbE and above - Year-over-year growth 2025-2030 (%)
Data Table on Forty GbE and above - Year-over-year growth 2025-2030 (%)

9.6 Market opportunity by Product

Market opportunity by Product ($ million)
Data Table on Market opportunity by Product ($ million)

10. Market Segmentation by Product Type

10.1 Market segments

Chart on Product Type - Market share 2025-2030 (%)
Data Table on Product Type - Market share 2025-2030 (%)

10.2 Comparison by Product Type

Chart on Comparison by Product Type
Data Table on Comparison by Product Type

10.3 Hardware - Market size and forecast 2025-2030

Chart on Hardware - Market size and forecast 2025-2030 ($ million)
Data Table on Hardware - Market size and forecast 2025-2030 ($ million)
Chart on Hardware - Year-over-year growth 2025-2030 (%)
Data Table on Hardware - Year-over-year growth 2025-2030 (%)

10.4 Software - Market size and forecast 2025-2030

Chart on Software - Market size and forecast 2025-2030 ($ million)
Data Table on Software - Market size and forecast 2025-2030 ($ million)
Chart on Software - Year-over-year growth 2025-2030 (%)
Data Table on Software - Year-over-year growth 2025-2030 (%)

10.5 Solutions - Market size and forecast 2025-2030

Chart on Solutions - Market size and forecast 2025-2030 ($ million)
Data Table on Solutions - Market size and forecast 2025-2030 ($ million)
Chart on Solutions - Year-over-year growth 2025-2030 (%)
Data Table on Solutions - Year-over-year growth 2025-2030 (%)

10.6 Market opportunity by Product Type

Market opportunity by Product Type ($ million)
Data Table on Market opportunity by Product Type ($ million)

11. Customer Landscape

11.1 Customer landscape overview

Analysis of price sensitivity, lifecycle, customer purchase basket, adoption rates, and purchase criteria

12. Geographic Landscape

12.1 Geographic segmentation

Chart on Market share by geography 2025-2030 (%)
Data Table on Market share by geography 2025-2030 (%)

12.2 Geographic comparison

Chart on Geographic comparison
Data Table on Geographic comparison

12.3 North America - Market size and forecast 2025-2030

Chart on North America - Market size and forecast 2025-2030 ($ million)
Data Table on North America - Market size and forecast 2025-2030 ($ million)
Chart on North America - Year-over-year growth 2025-2030 (%)
Data Table on North America - Year-over-year growth 2025-2030 (%)
Chart on Regional Comparison - North America
Data Table on Regional Comparison - North America

12.3.1 US - Market size and forecast 2025-2030

Chart on US - Market size and forecast 2025-2030 ($ million)
Data Table on US - Market size and forecast 2025-2030 ($ million)
Chart on US - Year-over-year growth 2025-2030 (%)
Data Table on US - Year-over-year growth 2025-2030 (%)

12.3.2 Canada - Market size and forecast 2025-2030

Chart on Canada - Market size and forecast 2025-2030 ($ million)
Data Table on Canada - Market size and forecast 2025-2030 ($ million)
Chart on Canada - Year-over-year growth 2025-2030 (%)
Data Table on Canada - Year-over-year growth 2025-2030 (%)

12.3.3 Mexico - Market size and forecast 2025-2030

Chart on Mexico - Market size and forecast 2025-2030 ($ million)
Data Table on Mexico - Market size and forecast 2025-2030 ($ million)
Chart on Mexico - Year-over-year growth 2025-2030 (%)
Data Table on Mexico - Year-over-year growth 2025-2030 (%)

12.4 APAC - Market size and forecast 2025-2030

Chart on APAC - Market size and forecast 2025-2030 ($ million)
Data Table on APAC - Market size and forecast 2025-2030 ($ million)
Chart on APAC - Year-over-year growth 2025-2030 (%)
Data Table on APAC - Year-over-year growth 2025-2030 (%)
Chart on Regional Comparison - APAC
Data Table on Regional Comparison - APAC

12.4.1 China - Market size and forecast 2025-2030

Chart on China - Market size and forecast 2025-2030 ($ million)
Data Table on China - Market size and forecast 2025-2030 ($ million)
Chart on China - Year-over-year growth 2025-2030 (%)
Data Table on China - Year-over-year growth 2025-2030 (%)

12.4.2 Japan - Market size and forecast 2025-2030

Chart on Japan - Market size and forecast 2025-2030 ($ million)
Data Table on Japan - Market size and forecast 2025-2030 ($ million)
Chart on Japan - Year-over-year growth 2025-2030 (%)
Data Table on Japan - Year-over-year growth 2025-2030 (%)

12.4.3 South Korea - Market size and forecast 2025-2030

Chart on South Korea - Market size and forecast 2025-2030 ($ million)
Data Table on South Korea - Market size and forecast 2025-2030 ($ million)
Chart on South Korea - Year-over-year growth 2025-2030 (%)
Data Table on South Korea - Year-over-year growth 2025-2030 (%)

12.4.4 India - Market size and forecast 2025-2030

Chart on India - Market size and forecast 2025-2030 ($ million)
Data Table on India - Market size and forecast 2025-2030 ($ million)
Chart on India - Year-over-year growth 2025-2030 (%)
Data Table on India - Year-over-year growth 2025-2030 (%)

12.4.5 Australia - Market size and forecast 2025-2030

Chart on Australia - Market size and forecast 2025-2030 ($ million)
Data Table on Australia - Market size and forecast 2025-2030 ($ million)
Chart on Australia - Year-over-year growth 2025-2030 (%)
Data Table on Australia - Year-over-year growth 2025-2030 (%)

12.4.6 Indonesia - Market size and forecast 2025-2030

Chart on Indonesia - Market size and forecast 2025-2030 ($ million)
Data Table on Indonesia - Market size and forecast 2025-2030 ($ million)
Chart on Indonesia - Year-over-year growth 2025-2030 (%)
Data Table on Indonesia - Year-over-year growth 2025-2030 (%)

12.5 Europe - Market size and forecast 2025-2030

Chart on Europe - Market size and forecast 2025-2030 ($ million)
Data Table on Europe - Market size and forecast 2025-2030 ($ million)
Chart on Europe - Year-over-year growth 2025-2030 (%)
Data Table on Europe - Year-over-year growth 2025-2030 (%)
Chart on Regional Comparison - Europe
Data Table on Regional Comparison - Europe

12.5.1 Germany - Market size and forecast 2025-2030

Chart on Germany - Market size and forecast 2025-2030 ($ million)
Data Table on Germany - Market size and forecast 2025-2030 ($ million)
Chart on Germany - Year-over-year growth 2025-2030 (%)
Data Table on Germany - Year-over-year growth 2025-2030 (%)

12.5.2 UK - Market size and forecast 2025-2030

Chart on UK - Market size and forecast 2025-2030 ($ million)
Data Table on UK - Market size and forecast 2025-2030 ($ million)
Chart on UK - Year-over-year growth 2025-2030 (%)
Data Table on UK - Year-over-year growth 2025-2030 (%)

12.5.3 France - Market size and forecast 2025-2030

Chart on France - Market size and forecast 2025-2030 ($ million)
Data Table on France - Market size and forecast 2025-2030 ($ million)
Chart on France - Year-over-year growth 2025-2030 (%)
Data Table on France - Year-over-year growth 2025-2030 (%)

12.5.4 Italy - Market size and forecast 2025-2030

Chart on Italy - Market size and forecast 2025-2030 ($ million)
Data Table on Italy - Market size and forecast 2025-2030 ($ million)
Chart on Italy - Year-over-year growth 2025-2030 (%)
Data Table on Italy - Year-over-year growth 2025-2030 (%)

12.5.5 Spain - Market size and forecast 2025-2030

Chart on Spain - Market size and forecast 2025-2030 ($ million)
Data Table on Spain - Market size and forecast 2025-2030 ($ million)
Chart on Spain - Year-over-year growth 2025-2030 (%)
Data Table on Spain - Year-over-year growth 2025-2030 (%)

12.5.6 The Netherlands - Market size and forecast 2025-2030

Chart on The Netherlands - Market size and forecast 2025-2030 ($ million)
Data Table on The Netherlands - Market size and forecast 2025-2030 ($ million)
Chart on The Netherlands - Year-over-year growth 2025-2030 (%)
Data Table on The Netherlands - Year-over-year growth 2025-2030 (%)

12.6 Middle East and Africa - Market size and forecast 2025-2030

Chart on Middle East and Africa - Market size and forecast 2025-2030 ($ million)
Data Table on Middle East and Africa - Market size and forecast 2025-2030 ($ million)
Chart on Middle East and Africa - Year-over-year growth 2025-2030 (%)
Data Table on Middle East and Africa - Year-over-year growth 2025-2030 (%)
Chart on Regional Comparison - Middle East and Africa
Data Table on Regional Comparison - Middle East and Africa

12.6.1 Saudi Arabia - Market size and forecast 2025-2030

Chart on Saudi Arabia - Market size and forecast 2025-2030 ($ million)
Data Table on Saudi Arabia - Market size and forecast 2025-2030 ($ million)
Chart on Saudi Arabia - Year-over-year growth 2025-2030 (%)
Data Table on Saudi Arabia - Year-over-year growth 2025-2030 (%)

12.6.2 UAE - Market size and forecast 2025-2030

Chart on UAE - Market size and forecast 2025-2030 ($ million)
Data Table on UAE - Market size and forecast 2025-2030 ($ million)
Chart on UAE - Year-over-year growth 2025-2030 (%)
Data Table on UAE - Year-over-year growth 2025-2030 (%)

12.6.3 South Africa - Market size and forecast 2025-2030

Chart on South Africa - Market size and forecast 2025-2030 ($ million)
Data Table on South Africa - Market size and forecast 2025-2030 ($ million)
Chart on South Africa - Year-over-year growth 2025-2030 (%)
Data Table on South Africa - Year-over-year growth 2025-2030 (%)

12.6.4 Israel - Market size and forecast 2025-2030

Chart on Israel - Market size and forecast 2025-2030 ($ million)
Data Table on Israel - Market size and forecast 2025-2030 ($ million)
Chart on Israel - Year-over-year growth 2025-2030 (%)
Data Table on Israel - Year-over-year growth 2025-2030 (%)

12.6.5 Turkey - Market size and forecast 2025-2030

Chart on Turkey - Market size and forecast 2025-2030 ($ million)
Data Table on Turkey - Market size and forecast 2025-2030 ($ million)
Chart on Turkey - Year-over-year growth 2025-2030 (%)
Data Table on Turkey - Year-over-year growth 2025-2030 (%)

12.7 South America - Market size and forecast 2025-2030

Chart on South America - Market size and forecast 2025-2030 ($ million)
Data Table on South America - Market size and forecast 2025-2030 ($ million)
Chart on South America - Year-over-year growth 2025-2030 (%)
Data Table on South America - Year-over-year growth 2025-2030 (%)
Chart on Regional Comparison - South America
Data Table on Regional Comparison - South America

12.7.1 Brazil - Market size and forecast 2025-2030

Chart on Brazil - Market size and forecast 2025-2030 ($ million)
Data Table on Brazil - Market size and forecast 2025-2030 ($ million)
Chart on Brazil - Year-over-year growth 2025-2030 (%)
Data Table on Brazil - Year-over-year growth 2025-2030 (%)

12.7.2 Argentina - Market size and forecast 2025-2030

Chart on Argentina - Market size and forecast 2025-2030 ($ million)
Data Table on Argentina - Market size and forecast 2025-2030 ($ million)
Chart on Argentina - Year-over-year growth 2025-2030 (%)
Data Table on Argentina - Year-over-year growth 2025-2030 (%)

12.7.3 Chile - Market size and forecast 2025-2030

Chart on Chile - Market size and forecast 2025-2030 ($ million)
Data Table on Chile - Market size and forecast 2025-2030 ($ million)
Chart on Chile - Year-over-year growth 2025-2030 (%)
Data Table on Chile - Year-over-year growth 2025-2030 (%)

12.8 Market opportunity by geography

Market opportunity by geography ($ million)
Data Tables on Market opportunity by geography ($ million)

13. Drivers, Challenges, and Opportunity

13.1 Market drivers

Massive global proliferation of artificial intelligence workloads driving immediate high throughput back end network testing mandates
Rapid global transformation of automotive electronics frameworks toward high speed ethernet backbone architectures
Intense corporate imperative for minimizing costly network downtime via proactive automated service level assurance systems

13.2 Market challenges

Severe testing architecture impediments associated with validating high bitrate modulations across next generation ethernet interfaces
Profound calibration and optimization friction within complex time sensitive networking deterministic industrial fabrics
Rising multi company software interoperability gaps inhibiting unified automation control across virtualized physical infrastructure

13.3 Impact of drivers and challenges

Impact of drivers and challenges in 2025 and 2030

13.4 Market opportunities

Widespread platform deployment of machine learning traffic generation models for highly predictive anomaly detection analytics
Rapid technical transition toward compact lightweight handheld field units supporting multi gigabit multi rate operations
Strategic industry consolidation through focused high value corporate mergers and unified validation platform integration

14. Competitive Landscape

14.1 Overview

14.2

Overview on criticality of inputs and factors of differentiation

14.3 Landscape disruption

Overview on factors of disruption

14.4 Industry risks

Impact of key risks on business

15. Competitive Analysis

15.1 Companies profiled

Companies covered

15.2 Company ranking index

15.3 Market positioning of companies

Matrix on companies position and classification

15.4 Anritsu Corp.

Anritsu Corp. - Overview
Anritsu Corp. - Business segments
Anritsu Corp. - Key offerings
Anritsu Corp. - Segment focus
SWOT

15.5 Deviser Instruments Co Ltd

Deviser Instruments Co Ltd - Overview
Deviser Instruments Co Ltd - Product / Service
Deviser Instruments Co Ltd - Key offerings
SWOT

15.6 EXFO Inc.

EXFO Inc. - Overview
EXFO Inc. - Product / Service
EXFO Inc. - Key offerings
SWOT

15.7 Fortinet Inc.

Fortinet Inc. - Overview
Fortinet Inc. - Business segments
Fortinet Inc. - Key offerings
Fortinet Inc. - Segment focus
SWOT

15.8 GAO Tek Inc.

GAO Tek Inc. - Overview
GAO Tek Inc. - Product / Service
GAO Tek Inc. - Key offerings
SWOT

15.9 Ideal Networks Ltd

Ideal Networks Ltd - Overview
Ideal Networks Ltd - Product / Service
Ideal Networks Ltd - Key offerings
SWOT

15.10 Keysight Technologies Inc.

Keysight Technologies Inc. - Overview
Keysight Technologies Inc. - Business segments
Keysight Technologies Inc. - Key offerings
Keysight Technologies Inc. - Segment focus
SWOT

15.11 National Instruments Corp.

National Instruments Corp. - Overview
National Instruments Corp. - Product / Service
National Instruments Corp. - Key offerings
SWOT

15.12 NetAlly LLC

NetAlly LLC - Overview
NetAlly LLC - Product / Service
NetAlly LLC - Key offerings
SWOT

15.13 NetScout Systems Inc.

NetScout Systems Inc. - Overview
NetScout Systems Inc. - Product / Service
NetScout Systems Inc. - Key offerings
SWOT

15.14 Rohde and Schwarz GmbH

Rohde and Schwarz GmbH - Overview
Rohde and Schwarz GmbH - Product / Service
Rohde and Schwarz GmbH - Key offerings
SWOT

15.15 Tektronix Inc.

Tektronix Inc. - Overview
Tektronix Inc. - Product / Service
Tektronix Inc. - Key offerings
SWOT

15.16 Trend Networks Ltd

Trend Networks Ltd - Overview
Trend Networks Ltd - Product / Service
Trend Networks Ltd - Key offerings
SWOT

15.17 VeEX Inc.

VeEX Inc. - Overview
VeEX Inc. - Product / Service
VeEX Inc. - Key offerings
SWOT

15.18 Yokogawa Test and Measurement

Yokogawa Test and Measurement - Overview
Yokogawa Test and Measurement - Product / Service
Yokogawa Test and Measurement - Key offerings
SWOT

16. Appendix

16.1 Scope of the report

Market definition
Objectives
Notes and caveats

16.2 Inclusions and exclusions checklist

Inclusions checklist
Exclusions checklist

16.3 Currency conversion rates for US$

16.4 Research methodology

16.5 Data procurement

Information sources

16.6 Data validation

16.7 Validation techniques employed for market sizing

16.8 Data synthesis

16.9 360 degree market analysis

16.10 List of abbreviations

Research Methodology

Technavio presents a detailed picture of the market by way of study, synthesis, and summation of data from multiple sources. The analysts have presented the various facets of the market with a particular focus on identifying the key industry influencers. The data thus presented is comprehensive, reliable, and the result of extensive research, both primary and secondary.

INFORMATION SOURCES

Primary sources

  • Manufacturers and suppliers
  • Channel partners
  • Industry experts
  • Strategic decision makers

Secondary sources

  • Industry journals and periodicals
  • Government data
  • Financial reports of key industry players
  • Historical data
  • Press releases

DATA ANALYSIS

Data Synthesis

  • Collation of data
  • Estimation of key figures
  • Analysis of derived insights

Data Validation

  • Triangulation with data models
  • Reference against proprietary databases
  • Corroboration with industry experts

REPORT WRITING

Qualitative

  • Market drivers
  • Market challenges
  • Market trends
  • Five forces analysis

Quantitative

  • Market size and forecast
  • Market segmentation
  • Geographical insights
  • Competitive landscape

Interested in this report?

Get your sample now to see our research methodology and insights!

Download Now

Frequently Asked Questions

Ethernet Test Equipment market growth will increase by USD 801.9 million during 2026-2030.

The Ethernet Test Equipment market is expected to grow at a CAGR of 6.1% during 2026-2030.

Ethernet Test Equipment market is segmented by End-user (Automotive, Telecommunication, Manufacturing, Others) Product (Ten GbE, One GbE, Forty GbE and above) Product type (Hardware, Software, Solutions)

Anritsu Corp., Apposite Technologies LLC, ByteBlower, Deviser Instruments Co Ltd, EXFO Inc., Fortinet Inc., GAO Tek Inc., GL Communications Inc., Ideal Networks Ltd, Keysight Technologies Inc., National Instruments Corp., NetAlly LLC, NetScout Systems Inc., Rohde and Schwarz GmbH, Tektronix Inc., Trend Networks Ltd, VeEX Inc., Veryx Technologies Pvt Ltd, Viavi Solutions Inc., Yokogawa Test and Measurement are a few of the key vendors in the Ethernet Test Equipment market.

APAC will register the highest growth rate of 34.3% among the other regions. Therefore, the Ethernet Test Equipment market in APAC is expected to garner significant business opportunities for the vendors during the forecast period.

US, Canada, Mexico, China, Japan, South Korea, India, Australia, Indonesia, Germany, UK, France, Italy, Spain, The Netherlands, Saudi Arabia, UAE, South Africa, Israel, Turkey, Brazil, Argentina, Chile

  • Massive global proliferation of artificial intelligence workloads driving immediate high throughput back end network testing mandates is the driving factor this market.

The Ethernet Test Equipment market vendors should focus on grabbing business opportunities from the End-user segment as it accounted for the largest market share in the base year.
RIA - Research AI Assistant
Ask RIA
