Ethnic Wear Market Analysis, Size, and Forecast 2026-2030: APAC (India, China, and Japan), North America (US, Canada, and Mexico), Europe (Germany, UK, and France), South America (Brazil and Argentina), Middle East and Africa (Saudi Arabia, UAE, and South Africa), and Rest of World (ROW)

Ethnic Wear Market Analysis, Size, and Forecast 2026-2030:
APAC (India, China, and Japan), North America (US, Canada, and Mexico), Europe (Germany, UK, and France), South America (Brazil and Argentina), Middle East and Africa (Saudi Arabia, UAE, and South Africa), and Rest of World (ROW)

Published: Mar 2026 276 Pages SKU: IRTNTR75350

Market Overview at a Glance

$48.29 B
Market Opportunity
8.3%
CAGR 2025 - 2030
43.4%
APAC Growth
$42.56 B
Women segment 2024

Ethnic Wear Market Size 2026-2030

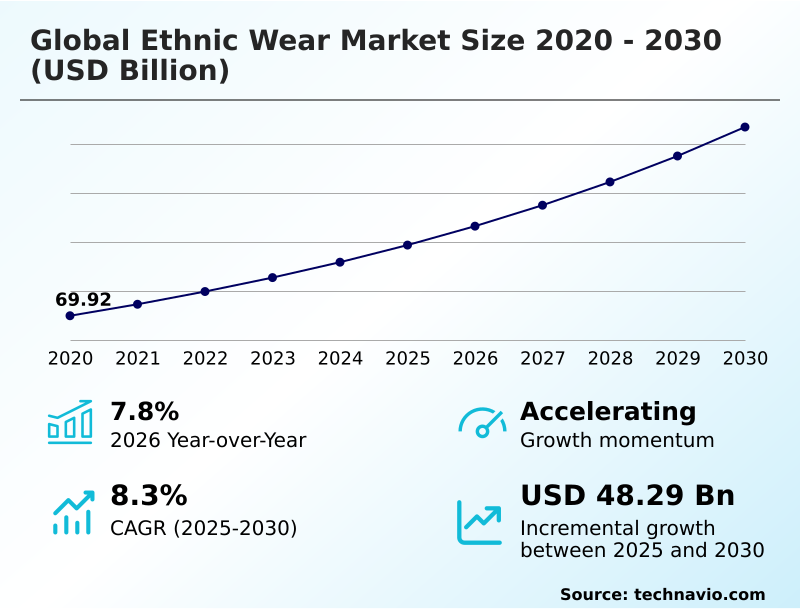
The ethnic wear market size is valued to increase by USD 48.29 billion, at a CAGR of 8.3% from 2025 to 2030. International market penetration and rise of global luxury flagships will drive the ethnic wear market.

Major Market Trends & Insights

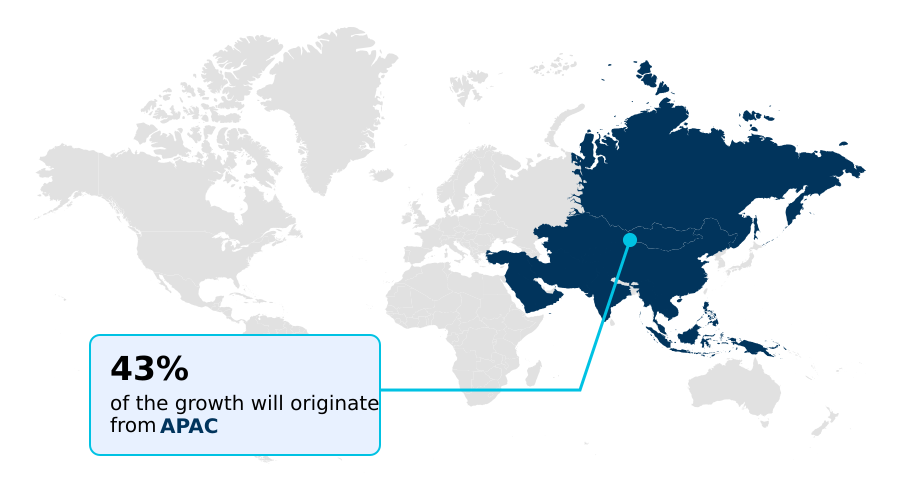
  • APAC dominated the market and accounted for a 43.4% growth during the forecast period.
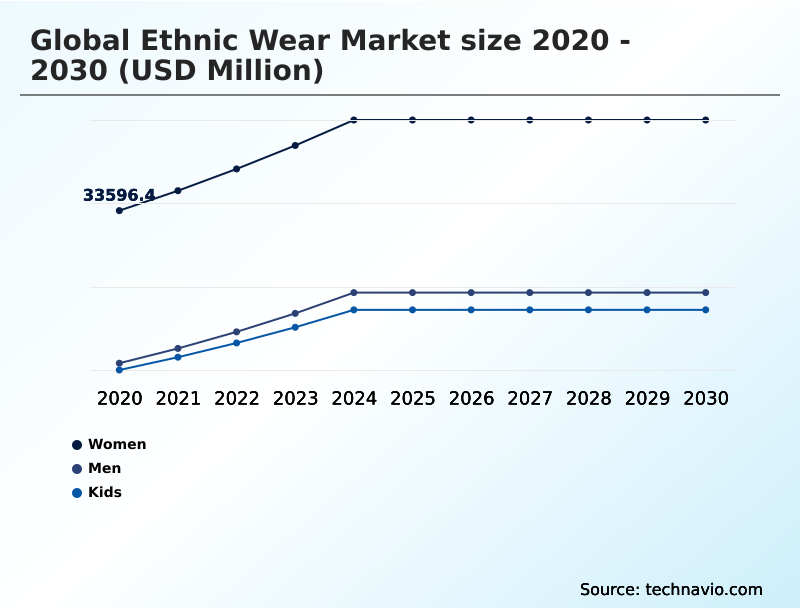
  • By End-user - Women segment was valued at USD 42.56 billion in 2024
  • By Distribution Channel - Offline segment accounted for the largest market revenue share in 2024

Market Size & Forecast

  • Market Opportunities: USD 77.20 billion
  • Market Future Opportunities: USD 48.29 billion
  • CAGR from 2025 to 2030 : 8.3%

Market Summary

  • The ethnic wear market is undergoing a significant transformation, driven by the convergence of heritage craftsmanship and modern commerce. This evolution is marked by a structural shift from fragmented, unorganized tailoring to branded, organized retail that offers consistency and contemporary designs.
  • A key dynamic is the industry's digital acceleration, where e-commerce and social commerce platforms are making traditional attire more accessible to a global audience, including the significant diaspora consumer base. Brands are increasingly adopting a phygital model, using physical stores as experience centers that complement online sales channels.
  • For instance, a company might leverage data analytics to forecast demand for specific festive collections in different regions, ensuring optimal inventory of occasion-wear ahead of cultural events. This strategy not only improves supply chain digitization and operational efficiency but also enhances the customer experience by aligning product availability with regional style preferences.
  • The emphasis on sustainability and ethical sourcing is also becoming a crucial differentiator, as consumers grow more conscious of the origins and impact of their purchases, favoring hand-crafted apparel and sustainable couture.

What will be the Size of the Ethnic Wear Market during the forecast period?

Get Key Insights on Market Forecast (PDF) Request Free Sample

How is the Ethnic Wear Market Segmented?

The ethnic wear industry research report provides comprehensive data (region-wise segment analysis), with forecasts and estimates in "USD million" for the period 2026-2030, as well as historical data from 2020-2024 for the following segments.

  • End-user
    • Women
    • Men
    • Kids
  • Distribution channel
    • Offline
    • Online
  • Price range
    • Economic
    • Medium
    • Premium
  • Geography
    • APAC
      • India
      • China
      • Japan
    • North America
      • US
      • Canada
      • Mexico
    • Europe
      • Germany
      • UK
      • France
    • South America
      • Brazil
      • Argentina
    • Middle East and Africa
      • Saudi Arabia
      • UAE
      • South Africa
    • Rest of World (ROW)

By End-user Insights

The women segment is estimated to witness significant growth during the forecast period.

The women's segment is the primary driver of the ethnic wear market, characterized by evolving consumer preferences that balance tradition with modern convenience. Demand is shifting toward comfortable yet aesthetically rich celebration wear, moving beyond traditional, heavy bridal couture.

Leading brands are now focusing on lightweight designer lehengas and versatile ready-to-wear ethnic outfits to cater to this trend. This evolution is supported by a transition toward heritage driven retail experiences that emphasize craftsmanship.

The adoption of AI to create personalized digital journeys and predict regional style preferences has enhanced customer engagement, with some brands reporting a 30% uplift in conversion rates for customized apparel.

This focus on sustainable couture and a seamless experience, including services like white glove delivery, defines the segment's trajectory.

Request Free Sample

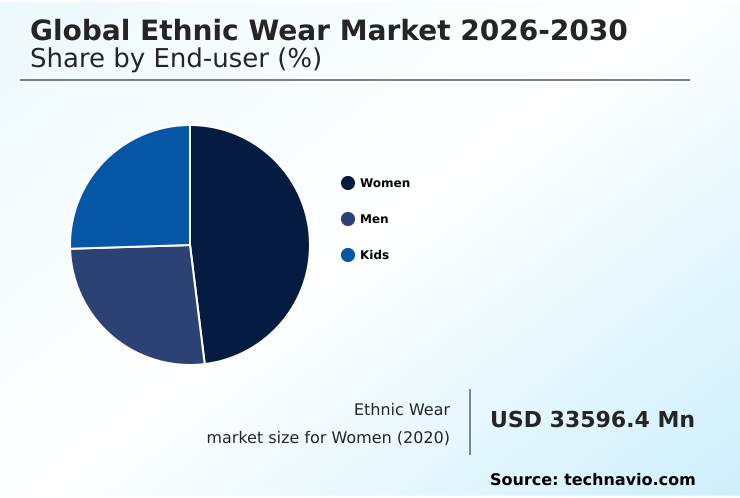
The Women segment was valued at USD 42.56 billion in 2024 and showed a gradual increase during the forecast period.

Request Free Sample

Regional Analysis

APAC is estimated to contribute 43.4% to the growth of the global market during the forecast period.Technavio’s analysts have elaborately explained the regional trends and drivers that shape the market during the forecast period.

See How Ethnic Wear Market Demand is Rising in APAC Request Free Sample

The geographic landscape is marked by strong regional dynamics, with APAC contributing over 43% of the market's incremental growth, driven by deep cultural traditions.

In India, growth is accelerating in Tier-2 and Tier-3 cities, where consumer demand is shifting from local tailors to organized retail offering branded designer pret labels and high-quality occasion-wear.

North America remains a crucial market, with a focus on bespoke bridal wear and hand-crafted apparel for the diaspora community.

Brands are creating phygital environment stores in these regions, using strong visual merchandising to showcase everything from hand-woven fabrics to designer lehengas.

This expansion improves distribution efficiency by over 20% compared to fragmented local supply chains, with trends like influencer-led live shopping helping to market printed kurtis and other styles globally.

Market Dynamics

Our researchers analyzed the data with 2025 as the base year, along with the key drivers, trends, and challenges. A holistic analysis of drivers will help companies refine their marketing strategies to gain a competitive advantage.

  • The future of the ethnic wear market hinges on a nuanced understanding of its evolving dynamics, particularly the globalization of traditional indian fashion. Successfully marketing ethnic wear to younger generations requires a balance, integrating fusion wear trends in ethnic apparel while respecting the role of craftsmanship in luxury ethnic wear.
  • Addressing the challenges in ethnic wear e-commerce is paramount; this includes mastering supply chain management for ethnic wear and implementing online personalization in ethnic fashion. A key focus is on creating a superior customer experience in ethnic wear retail. This involves a deep dive into luxury ethnic wear market dynamics and understanding the bridal couture market segmentation.
  • The industry is increasingly focused on ethnic wear for diaspora consumers, leveraging digital transformation in ethnic retail to reach them. The implementation of a phygital retail for luxury ethnic wear is becoming standard, supported by an effective omnichannel strategy for ethnic apparel.
  • Key considerations include the impact of social commerce on ethnic wear and using data analytics for ethnic wear forecasting to manage inventory for celebration wear for festive seasons. Firms that excel in sourcing hand-woven fabrics for fashion and championing sustainable practices in ethnic fashion are gaining a competitive edge.
  • These integrated strategies focused on artisanal heritage in modern ethnic wear are critical; businesses adopting them report inventory turnover rates nearly 50% higher than those reliant on traditional models.

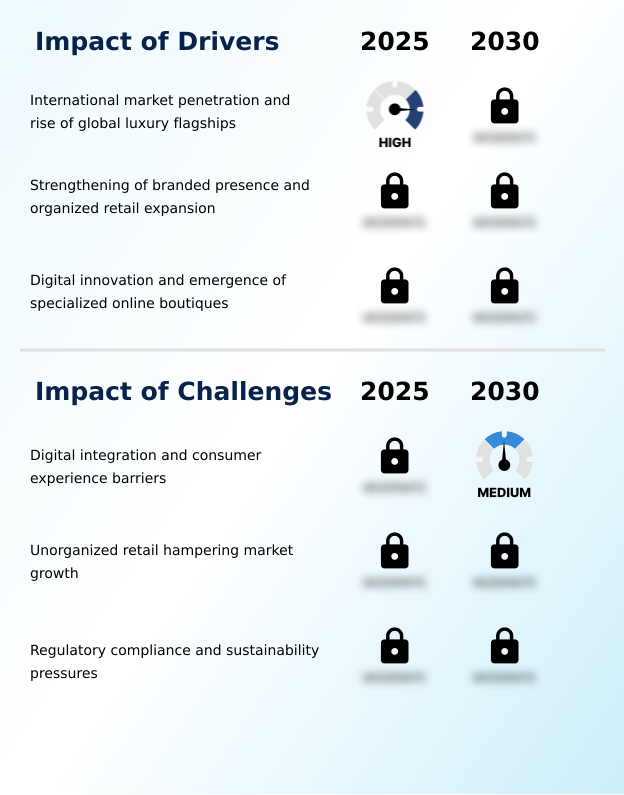
What are the key market drivers leading to the rise in the adoption of Ethnic Wear Industry?

  • International market penetration, coupled with the establishment of global luxury flagships, is a key driver for market expansion.

  • The market is propelled by organized retail expansion, with chains reporting a 20% increase in footfall at new locations. This organized retail shift captures new demand.
  • Simultaneously, cross-border e-commerce platforms are unlocking growth by reaching diaspora consumers, increasing export revenues by over 35%.
  • This global push is built on a narrative of artisanal heritage, mindful luxury, and sustainable practices, which resonates with audiences seeking authentic artisanal Indian design.
  • By showcasing high-quality textile craftsmanship and traditional indian craftsmanship in global fashion capitals, brands are elevating ethnic wear from niche attire to a recognized form of international couture, reinforcing its commercial scalability and cultural significance.

What are the market trends shaping the Ethnic Wear Industry?

  • The integration of advanced digital solutions is reshaping the market. High-end omnichannel platforms are becoming crucial for delivering seamless consumer experiences.

  • A key trend is the market’s pivot to sophisticated omnichannel strategies, creating a seamless phygital retail environment. The adoption of technologies like augmented reality try-on has reduced online return rates by up to 30%, while virtual styling consultations increase average order value. This digital shift is exemplified by the launch of a digital fine jewellery boutique, making collections globally accessible.
  • Data-led inventory planning has improved forecast accuracy by over 25%, supporting the overall omnichannel model. This integrated phygital experience is complemented by social commerce platforms and curated online trunk shows, which are fundamentally altering how heritage garments are marketed and sold to a new generation of shoppers.

What challenges does the Ethnic Wear Industry face during its growth?

  • Barriers to effective digital integration and the delivery of seamless consumer experiences present a key challenge to industry growth.

  • A primary challenge is bridging the gap between experiences rooted in heritage craftsmanship and modern digital expectations, particularly for high-value luxury ethnic garments. The absence of real-time inventory synchronization between online and offline channels results in stock discrepancies affecting up to 15% of orders.
  • Moreover, outdated customer relationship management systems hinder personalization, rendering marketing efforts 40% less effective than those of digitally native competitors. The complex logistics of managing custom-tailored indian ethnic wear and diverse stock like festive ethnic sets across borders amplifies the need for advanced supply chain digitization.
  • Successfully modernizing these systems is critical for maintaining brand consistency and meeting consumer demand for both indo-western couture ensembles and traditional apparel.

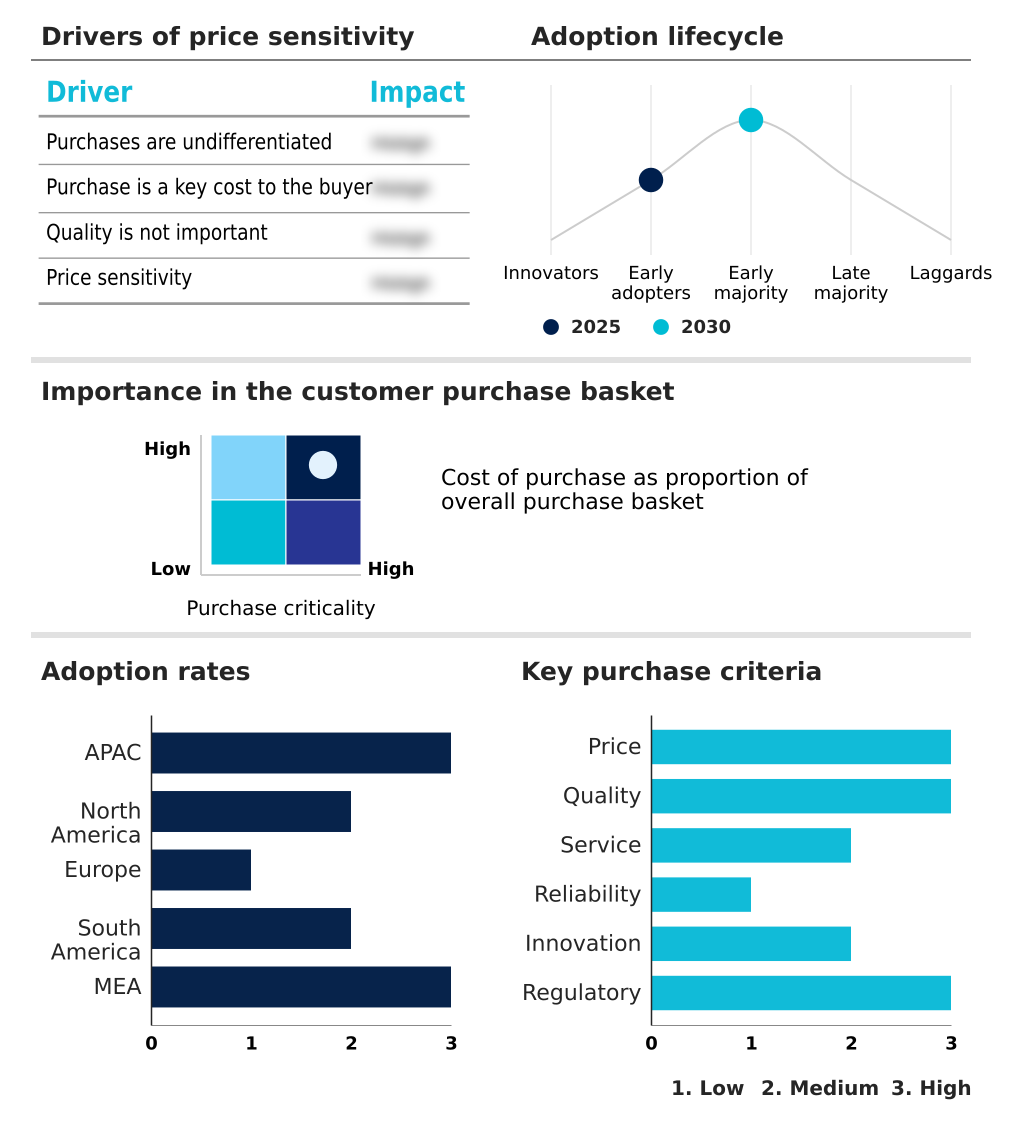
Exclusive Technavio Analysis on Customer Landscape

The ethnic wear market forecasting report includes the adoption lifecycle of the market, covering from the innovator’s stage to the laggard’s stage. It focuses on adoption rates in different regions based on penetration. Furthermore, the ethnic wear market report also includes key purchase criteria and drivers of price sensitivity to help companies evaluate and develop their market growth analysis strategies.

Customer Landscape of Ethnic Wear Industry

Competitive Landscape

Companies are implementing various strategies, such as strategic alliances, ethnic wear market forecast, partnerships, mergers and acquisitions, geographical expansion, and product/service launches, to enhance their presence in the industry.

Biba Fashion Ltd. - A portfolio defined by high-end, hand-crafted bridal ensembles and accessories, reflecting traditional Indian craftsmanship and luxury aesthetics.

The industry research and growth report includes detailed analyses of the competitive landscape of the market and information about key companies, including:

  • Biba Fashion Ltd.
  • Cbazaar
  • Fabindia Ltd.
  • Frontier Raas Pvt. Ltd.
  • High Street Essentials Pvt. Ltd.
  • House of Anita Dongre Ltd.
  • Kalki Fashion
  • Khaadi Corp. Ltd.
  • Koskii Tower Pvt. Ltd.
  • Nalli Silk Sarees Pvt. Ltd.
  • Neerus Ensembles Pvt. Ltd.
  • Peachmode
  • Purple Style Labs Ltd.
  • Ritika Pvt. Ltd.
  • Sabyasachi Calcutta LLP
  • Samyakk
  • Soch Apparels Pvt. Ltd.
  • Tahiliani Design Pvt. Ltd.
  • Utsav Fashion Pvt. Ltd.

Qualitative and quantitative analysis of companies has been conducted to help clients understand the wider business environment as well as the strengths and weaknesses of key industry players. Data is qualitatively analyzed to categorize companies as pure play, category-focused, industry-focused, and diversified; it is quantitatively analyzed to categorize companies as dominant, leading, strong, tentative, and weak.

Recent Development and News in Ethnic wear market

  • In September 2024, Biba expanded its international footprint with a new store launch in New Jersey, aiming to capture the growing diaspora market.
  • In October 2024, Vedant Fashions launched an integrated dual-brand flagship store in Pune, establishing a phygital environment that merges physical inventory with digital discovery tools.
  • In January 2025, Fabindia Limited announced its preparations for a maiden public offering, intending to fund expansion and leverage the increasing demand for ethically sourced and organic products.
  • In February 2025, Sabyasachi Calcutta LLP inaugurated a lavish flagship boutique in Hyderabad to showcase its exclusive fine jewelry and global couture collections.

Dive into Technavio’s robust research methodology, blending expert interviews, extensive data synthesis, and validated models for unparalleled Ethnic Wear Market insights. See full methodology.

Market Scope
Page number 276
Base year 2025
Historic period 2020-2024
Forecast period 2026-2030
Growth momentum & CAGR Accelerate at a CAGR of 8.3%
Market growth 2026-2030 USD 48291.8 million
Market structure Fragmented
YoY growth 2025-2026(%) 7.8%
Key countries India, China, Japan, South Korea, Australia, Indonesia, US, Canada, Mexico, Germany, UK, France, Italy, Spain, The Netherlands, Brazil, Argentina, Chile, Saudi Arabia, UAE, South Africa, Israel and Turkey
Competitive landscape Leading Companies, Market Positioning of Companies, Competitive Strategies, and Industry Risks

Request Free Sample

Research Analyst Overview

  • The ethnic wear market is defined by a strategic shift toward organized retail and a sophisticated omnichannel model. This transition integrates heritage craftsmanship with modern commerce, elevating artisanal heritage to a global stage. The product landscape is diverse, spanning from accessible ready-to-wear ethnic outfits to exclusive luxury ethnic garments.
  • Core offerings include hand-crafted apparel made from traditional hand-woven fabrics, alongside high-value bridal couture and bespoke bridal wear. The rise of designer pret labels offering fusion wear and indo-western couture ensembles caters to modern tastes. A focus on mindful luxury is driving demand for sustainable couture.
  • Technologically, the industry is creating a phygital retail environment with tools like augmented reality try-on and virtual styling consultations, which have increased average order values by over 15%. This showcases the importance of textile craftsmanship and traditional indian craftsmanship, whether in custom-tailored indian ethnic wear, occasion-wear, celebration wear, or a digital fine jewellery boutique.

What are the Key Data Covered in this Ethnic Wear Market Research and Growth Report?

  • What is the expected growth of the Ethnic Wear Market between 2026 and 2030?

    • USD 48.29 billion, at a CAGR of 8.3%

  • What segmentation does the market report cover?

    • The report is segmented by End-user (Women, Men, and Kids), Distribution Channel (Offline, and Online), Price Range (Economic, Medium, and Premium) and Geography (APAC, North America, Europe, South America, Middle East and Africa)

  • Which regions are analyzed in the report?

    • APAC, North America, Europe, South America and Middle East and Africa

  • What are the key growth drivers and market challenges?

    • International market penetration and rise of global luxury flagships, Digital integration and consumer experience barriers

  • Who are the major players in the Ethnic Wear Market?

    • Biba Fashion Ltd., Cbazaar, Fabindia Ltd., Frontier Raas Pvt. Ltd., High Street Essentials Pvt. Ltd., House of Anita Dongre Ltd., Kalki Fashion, Khaadi Corp. Ltd., Koskii Tower Pvt. Ltd., Nalli Silk Sarees Pvt. Ltd., Neerus Ensembles Pvt. Ltd., Peachmode, Purple Style Labs Ltd., Ritika Pvt. Ltd., Sabyasachi Calcutta LLP, Samyakk, Soch Apparels Pvt. Ltd., Tahiliani Design Pvt. Ltd. and Utsav Fashion Pvt. Ltd.

Market Research Insights

  • The market’s dynamism is fueled by the rapid adoption of omnichannel strategies, which are proving highly effective in engaging a diverse customer base. Brands that have successfully implemented an integrated phygital experience report customer engagement rates that are up to 30% higher than those of their brick-and-mortar-only counterparts.
  • The strategic use of social commerce platforms for influencer-led live shopping events has also yielded significant results, with some campaigns boosting sales for specific collections by over 50% in a single day. Furthermore, the expansion of cross-border e-commerce is critical, allowing brands to cater to diaspora consumers and new international markets.
  • This digital-first approach, balanced with heritage driven retail concepts, is essential for navigating the competitive landscape and capitalizing on emerging growth opportunities.

We can help! Our analysts can customize this ethnic wear market research report to meet your requirements.

Get in touch

1. Executive Summary

1.1 Market overview

Executive Summary - Chart on Market Overview
Executive Summary - Data Table on Market Overview
Executive Summary - Chart on Global Market Characteristics
Executive Summary - Chart on Market by Geography
Executive Summary - Chart on Market Segmentation by End-user
Executive Summary - Chart on Market Segmentation by Distribution Channel
Executive Summary - Chart on Market Segmentation by Price Range
Executive Summary - Chart on Incremental Growth
Executive Summary - Data Table on Incremental Growth
Executive Summary - Chart on Company Market Positioning

2. Technavio Analysis

2.1 Analysis of price sensitivity, lifecycle, customer purchase basket, adoption rates, and purchase criteria

2.2 Criticality of inputs and Factors of differentiation

Chart on Overview on criticality of inputs and factors of differentiation

2.3 Factors of disruption

Chart on Overview on factors of disruption

2.4 Impact of drivers and challenges

Chart on Impact of drivers and challenges in 2025 and 2030

3. Market Landscape

3.1 Market ecosystem

Chart on Parent Market
Data Table on - Parent Market

3.2 Market characteristics

Chart on Market characteristics analysis

3.3 Value chain analysis

Chart on Value chain analysis

4. Market Sizing

4.1 Market definition

Data Table on Offerings of companies included in the market definition

4.2 Market segment analysis

Market segments

4.3 Market size 2025

4.4 Market outlook: Forecast for 2025-2030

Chart on Global - Market size and forecast 2025-2030 ($ million)
Data Table on Global - Market size and forecast 2025-2030 ($ million)
Chart on Global Market: Year-over-year growth 2025-2030 (%)
Data Table on Global Market: Year-over-year growth 2025-2030 (%)

5. Historic Market Size

5.1 Global Ethnic Wear Market 2020 - 2024

Historic Market Size - Data Table on Global Ethnic Wear Market 2020 - 2024 ($ million)

5.2 End-user segment analysis 2020 - 2024

Historic Market Size - End-user Segment 2020 - 2024 ($ million)

5.3 Distribution Channel segment analysis 2020 - 2024

Historic Market Size - Distribution Channel Segment 2020 - 2024 ($ million)

5.4 Price Range segment analysis 2020 - 2024

Historic Market Size - Price Range Segment 2020 - 2024 ($ million)

5.5 Geography segment analysis 2020 - 2024

Historic Market Size - Geography Segment 2020 - 2024 ($ million)

5.6 Country segment analysis 2020 - 2024

Historic Market Size - Country Segment 2020 - 2024 ($ million)

6. Qualitative Analysis

6.1 Impact of AI on Global Ethnic Wear Market

7. Five Forces Analysis

7.1 Five forces summary

Five forces analysis - Comparison between 2025 and 2030

7.2 Bargaining power of buyers

Bargaining power of buyers - Impact of key factors 2025 and 2030

7.3 Bargaining power of suppliers

Bargaining power of suppliers - Impact of key factors in 2025 and 2030

7.4 Threat of new entrants

Threat of new entrants - Impact of key factors in 2025 and 2030

7.5 Threat of substitutes

Threat of substitutes - Impact of key factors in 2025 and 2030

7.6 Threat of rivalry

Threat of rivalry - Impact of key factors in 2025 and 2030

7.7 Market condition

Chart on Market condition - Five forces 2025 and 2030

8. Market Segmentation by End-user

8.1 Market segments

Chart on End-user - Market share 2025-2030 (%)
Data Table on End-user - Market share 2025-2030 (%)

8.2 Comparison by End-user

Chart on Comparison by End-user
Data Table on Comparison by End-user

8.3 Women - Market size and forecast 2025-2030

Chart on Women - Market size and forecast 2025-2030 ($ million)
Data Table on Women - Market size and forecast 2025-2030 ($ million)
Chart on Women - Year-over-year growth 2025-2030 (%)
Data Table on Women - Year-over-year growth 2025-2030 (%)

8.4 Men - Market size and forecast 2025-2030

Chart on Men - Market size and forecast 2025-2030 ($ million)
Data Table on Men - Market size and forecast 2025-2030 ($ million)
Chart on Men - Year-over-year growth 2025-2030 (%)
Data Table on Men - Year-over-year growth 2025-2030 (%)

8.5 Kids - Market size and forecast 2025-2030

Chart on Kids - Market size and forecast 2025-2030 ($ million)
Data Table on Kids - Market size and forecast 2025-2030 ($ million)
Chart on Kids - Year-over-year growth 2025-2030 (%)
Data Table on Kids - Year-over-year growth 2025-2030 (%)

8.6 Market opportunity by End-user

Market opportunity by End-user ($ million)
Data Table on Market opportunity by End-user ($ million)

9. Market Segmentation by Distribution Channel

9.1 Market segments

Chart on Distribution Channel - Market share 2025-2030 (%)
Data Table on Distribution Channel - Market share 2025-2030 (%)

9.2 Comparison by Distribution Channel

Chart on Comparison by Distribution Channel
Data Table on Comparison by Distribution Channel

9.3 Offline - Market size and forecast 2025-2030

Chart on Offline - Market size and forecast 2025-2030 ($ million)
Data Table on Offline - Market size and forecast 2025-2030 ($ million)
Chart on Offline - Year-over-year growth 2025-2030 (%)
Data Table on Offline - Year-over-year growth 2025-2030 (%)

9.4 Online - Market size and forecast 2025-2030

Chart on Online - Market size and forecast 2025-2030 ($ million)
Data Table on Online - Market size and forecast 2025-2030 ($ million)
Chart on Online - Year-over-year growth 2025-2030 (%)
Data Table on Online - Year-over-year growth 2025-2030 (%)

9.5 Market opportunity by Distribution Channel

Market opportunity by Distribution Channel ($ million)
Data Table on Market opportunity by Distribution Channel ($ million)

10. Market Segmentation by Price Range

10.1 Market segments

Chart on Price Range - Market share 2025-2030 (%)
Data Table on Price Range - Market share 2025-2030 (%)

10.2 Comparison by Price Range

Chart on Comparison by Price Range
Data Table on Comparison by Price Range

10.3 Economic - Market size and forecast 2025-2030

Chart on Economic - Market size and forecast 2025-2030 ($ million)
Data Table on Economic - Market size and forecast 2025-2030 ($ million)
Chart on Economic - Year-over-year growth 2025-2030 (%)
Data Table on Economic - Year-over-year growth 2025-2030 (%)

10.4 Medium - Market size and forecast 2025-2030

Chart on Medium - Market size and forecast 2025-2030 ($ million)
Data Table on Medium - Market size and forecast 2025-2030 ($ million)
Chart on Medium - Year-over-year growth 2025-2030 (%)
Data Table on Medium - Year-over-year growth 2025-2030 (%)

10.5 Premium - Market size and forecast 2025-2030

Chart on Premium - Market size and forecast 2025-2030 ($ million)
Data Table on Premium - Market size and forecast 2025-2030 ($ million)
Chart on Premium - Year-over-year growth 2025-2030 (%)
Data Table on Premium - Year-over-year growth 2025-2030 (%)

10.6 Market opportunity by Price Range

Market opportunity by Price Range ($ million)
Data Table on Market opportunity by Price Range ($ million)

11. Customer Landscape

11.1 Customer landscape overview

Analysis of price sensitivity, lifecycle, customer purchase basket, adoption rates, and purchase criteria

12. Geographic Landscape

12.1 Geographic segmentation

Chart on Market share by geography 2025-2030 (%)
Data Table on Market share by geography 2025-2030 (%)

12.2 Geographic comparison

Chart on Geographic comparison
Data Table on Geographic comparison

12.3 APAC - Market size and forecast 2025-2030

Chart on APAC - Market size and forecast 2025-2030 ($ million)
Data Table on APAC - Market size and forecast 2025-2030 ($ million)
Chart on APAC - Year-over-year growth 2025-2030 (%)
Data Table on APAC - Year-over-year growth 2025-2030 (%)
Chart on Regional Comparison - APAC
Data Table on Regional Comparison - APAC

12.3.1 India - Market size and forecast 2025-2030

Chart on India - Market size and forecast 2025-2030 ($ million)
Data Table on India - Market size and forecast 2025-2030 ($ million)
Chart on India - Year-over-year growth 2025-2030 (%)
Data Table on India - Year-over-year growth 2025-2030 (%)

12.3.2 China - Market size and forecast 2025-2030

Chart on China - Market size and forecast 2025-2030 ($ million)
Data Table on China - Market size and forecast 2025-2030 ($ million)
Chart on China - Year-over-year growth 2025-2030 (%)
Data Table on China - Year-over-year growth 2025-2030 (%)

12.3.3 Japan - Market size and forecast 2025-2030

Chart on Japan - Market size and forecast 2025-2030 ($ million)
Data Table on Japan - Market size and forecast 2025-2030 ($ million)
Chart on Japan - Year-over-year growth 2025-2030 (%)
Data Table on Japan - Year-over-year growth 2025-2030 (%)

12.3.4 South Korea - Market size and forecast 2025-2030

Chart on South Korea - Market size and forecast 2025-2030 ($ million)
Data Table on South Korea - Market size and forecast 2025-2030 ($ million)
Chart on South Korea - Year-over-year growth 2025-2030 (%)
Data Table on South Korea - Year-over-year growth 2025-2030 (%)

12.3.5 Australia - Market size and forecast 2025-2030

Chart on Australia - Market size and forecast 2025-2030 ($ million)
Data Table on Australia - Market size and forecast 2025-2030 ($ million)
Chart on Australia - Year-over-year growth 2025-2030 (%)
Data Table on Australia - Year-over-year growth 2025-2030 (%)

12.3.6 Indonesia - Market size and forecast 2025-2030

Chart on Indonesia - Market size and forecast 2025-2030 ($ million)
Data Table on Indonesia - Market size and forecast 2025-2030 ($ million)
Chart on Indonesia - Year-over-year growth 2025-2030 (%)
Data Table on Indonesia - Year-over-year growth 2025-2030 (%)

12.4 North America - Market size and forecast 2025-2030

Chart on North America - Market size and forecast 2025-2030 ($ million)
Data Table on North America - Market size and forecast 2025-2030 ($ million)
Chart on North America - Year-over-year growth 2025-2030 (%)
Data Table on North America - Year-over-year growth 2025-2030 (%)
Chart on Regional Comparison - North America
Data Table on Regional Comparison - North America

12.4.1 US - Market size and forecast 2025-2030

Chart on US - Market size and forecast 2025-2030 ($ million)
Data Table on US - Market size and forecast 2025-2030 ($ million)
Chart on US - Year-over-year growth 2025-2030 (%)
Data Table on US - Year-over-year growth 2025-2030 (%)

12.4.2 Canada - Market size and forecast 2025-2030

Chart on Canada - Market size and forecast 2025-2030 ($ million)
Data Table on Canada - Market size and forecast 2025-2030 ($ million)
Chart on Canada - Year-over-year growth 2025-2030 (%)
Data Table on Canada - Year-over-year growth 2025-2030 (%)

12.4.3 Mexico - Market size and forecast 2025-2030

Chart on Mexico - Market size and forecast 2025-2030 ($ million)
Data Table on Mexico - Market size and forecast 2025-2030 ($ million)
Chart on Mexico - Year-over-year growth 2025-2030 (%)
Data Table on Mexico - Year-over-year growth 2025-2030 (%)

12.5 Europe - Market size and forecast 2025-2030

Chart on Europe - Market size and forecast 2025-2030 ($ million)
Data Table on Europe - Market size and forecast 2025-2030 ($ million)
Chart on Europe - Year-over-year growth 2025-2030 (%)
Data Table on Europe - Year-over-year growth 2025-2030 (%)
Chart on Regional Comparison - Europe
Data Table on Regional Comparison - Europe

12.5.1 Germany - Market size and forecast 2025-2030

Chart on Germany - Market size and forecast 2025-2030 ($ million)
Data Table on Germany - Market size and forecast 2025-2030 ($ million)
Chart on Germany - Year-over-year growth 2025-2030 (%)
Data Table on Germany - Year-over-year growth 2025-2030 (%)

12.5.2 UK - Market size and forecast 2025-2030

Chart on UK - Market size and forecast 2025-2030 ($ million)
Data Table on UK - Market size and forecast 2025-2030 ($ million)
Chart on UK - Year-over-year growth 2025-2030 (%)
Data Table on UK - Year-over-year growth 2025-2030 (%)

12.5.3 France - Market size and forecast 2025-2030

Chart on France - Market size and forecast 2025-2030 ($ million)
Data Table on France - Market size and forecast 2025-2030 ($ million)
Chart on France - Year-over-year growth 2025-2030 (%)
Data Table on France - Year-over-year growth 2025-2030 (%)

12.5.4 Italy - Market size and forecast 2025-2030

Chart on Italy - Market size and forecast 2025-2030 ($ million)
Data Table on Italy - Market size and forecast 2025-2030 ($ million)
Chart on Italy - Year-over-year growth 2025-2030 (%)
Data Table on Italy - Year-over-year growth 2025-2030 (%)

12.5.5 Spain - Market size and forecast 2025-2030

Chart on Spain - Market size and forecast 2025-2030 ($ million)
Data Table on Spain - Market size and forecast 2025-2030 ($ million)
Chart on Spain - Year-over-year growth 2025-2030 (%)
Data Table on Spain - Year-over-year growth 2025-2030 (%)

12.5.6 The Netherlands - Market size and forecast 2025-2030

Chart on The Netherlands - Market size and forecast 2025-2030 ($ million)
Data Table on The Netherlands - Market size and forecast 2025-2030 ($ million)
Chart on The Netherlands - Year-over-year growth 2025-2030 (%)
Data Table on The Netherlands - Year-over-year growth 2025-2030 (%)

12.6 South America - Market size and forecast 2025-2030

Chart on South America - Market size and forecast 2025-2030 ($ million)
Data Table on South America - Market size and forecast 2025-2030 ($ million)
Chart on South America - Year-over-year growth 2025-2030 (%)
Data Table on South America - Year-over-year growth 2025-2030 (%)
Chart on Regional Comparison - South America
Data Table on Regional Comparison - South America

12.6.1 Brazil - Market size and forecast 2025-2030

Chart on Brazil - Market size and forecast 2025-2030 ($ million)
Data Table on Brazil - Market size and forecast 2025-2030 ($ million)
Chart on Brazil - Year-over-year growth 2025-2030 (%)
Data Table on Brazil - Year-over-year growth 2025-2030 (%)

12.6.2 Argentina - Market size and forecast 2025-2030

Chart on Argentina - Market size and forecast 2025-2030 ($ million)
Data Table on Argentina - Market size and forecast 2025-2030 ($ million)
Chart on Argentina - Year-over-year growth 2025-2030 (%)
Data Table on Argentina - Year-over-year growth 2025-2030 (%)

12.6.3 Chile - Market size and forecast 2025-2030

Chart on Chile - Market size and forecast 2025-2030 ($ million)
Data Table on Chile - Market size and forecast 2025-2030 ($ million)
Chart on Chile - Year-over-year growth 2025-2030 (%)
Data Table on Chile - Year-over-year growth 2025-2030 (%)

12.7 Middle East and Africa - Market size and forecast 2025-2030

Chart on Middle East and Africa - Market size and forecast 2025-2030 ($ million)
Data Table on Middle East and Africa - Market size and forecast 2025-2030 ($ million)
Chart on Middle East and Africa - Year-over-year growth 2025-2030 (%)
Data Table on Middle East and Africa - Year-over-year growth 2025-2030 (%)
Chart on Regional Comparison - Middle East and Africa
Data Table on Regional Comparison - Middle East and Africa

12.7.1 Saudi Arabia - Market size and forecast 2025-2030

Chart on Saudi Arabia - Market size and forecast 2025-2030 ($ million)
Data Table on Saudi Arabia - Market size and forecast 2025-2030 ($ million)
Chart on Saudi Arabia - Year-over-year growth 2025-2030 (%)
Data Table on Saudi Arabia - Year-over-year growth 2025-2030 (%)

12.7.2 UAE - Market size and forecast 2025-2030

Chart on UAE - Market size and forecast 2025-2030 ($ million)
Data Table on UAE - Market size and forecast 2025-2030 ($ million)
Chart on UAE - Year-over-year growth 2025-2030 (%)
Data Table on UAE - Year-over-year growth 2025-2030 (%)

12.7.3 South Africa - Market size and forecast 2025-2030

Chart on South Africa - Market size and forecast 2025-2030 ($ million)
Data Table on South Africa - Market size and forecast 2025-2030 ($ million)
Chart on South Africa - Year-over-year growth 2025-2030 (%)
Data Table on South Africa - Year-over-year growth 2025-2030 (%)

12.7.4 Israel - Market size and forecast 2025-2030

Chart on Israel - Market size and forecast 2025-2030 ($ million)
Data Table on Israel - Market size and forecast 2025-2030 ($ million)
Chart on Israel - Year-over-year growth 2025-2030 (%)
Data Table on Israel - Year-over-year growth 2025-2030 (%)

12.7.5 Turkey - Market size and forecast 2025-2030

Chart on Turkey - Market size and forecast 2025-2030 ($ million)
Data Table on Turkey - Market size and forecast 2025-2030 ($ million)
Chart on Turkey - Year-over-year growth 2025-2030 (%)
Data Table on Turkey - Year-over-year growth 2025-2030 (%)

12.8 Market opportunity by geography

Market opportunity by geography ($ million)
Data Tables on Market opportunity by geography ($ million)

13. Drivers, Challenges, and Opportunity

13.1 Market drivers

International market penetration and rise of global luxury flagships
Strengthening of branded presence and organized retail expansion
Digital innovation and emergence of specialized online boutiques

13.2 Market challenges

Digital integration and consumer experience barriers
Unorganized retail hampering market growth
Regulatory compliance and sustainability pressures

13.3 Impact of drivers and challenges

Impact of drivers and challenges in 2025 and 2030

13.4 Market opportunities

Integration of advanced digital solutions and high end omnichannel platforms
Expansion of specialized branded retail and lifestyle destinations
Globalization of luxury ethnic wear and international flagship presence

14. Competitive Landscape

14.1 Overview

14.2

Overview on criticality of inputs and factors of differentiation

14.3 Landscape disruption

Overview on factors of disruption

14.4 Industry risks

Impact of key risks on business

15. Competitive Analysis

15.1 Companies profiled

Companies covered

15.2 Company ranking index

15.3 Market positioning of companies

Matrix on companies position and classification

15.4 Biba Fashion Ltd.

Biba Fashion Ltd. - Overview
Biba Fashion Ltd. - Product / Service
Biba Fashion Ltd. - Key offerings
SWOT

15.5 Cbazaar

Cbazaar - Overview
Cbazaar - Product / Service
Cbazaar - Key offerings
SWOT

15.6 Fabindia Ltd.

Fabindia Ltd. - Overview
Fabindia Ltd. - Product / Service
Fabindia Ltd. - Key offerings
SWOT

15.7 Frontier Raas Pvt. Ltd.

Frontier Raas Pvt. Ltd. - Overview
Frontier Raas Pvt. Ltd. - Product / Service
Frontier Raas Pvt. Ltd. - Key offerings
SWOT

15.8 House of Anita Dongre Ltd.

House of Anita Dongre Ltd. - Overview
House of Anita Dongre Ltd. - Product / Service
House of Anita Dongre Ltd. - Key offerings
SWOT

15.9 Kalki Fashion

Kalki Fashion - Overview
Kalki Fashion - Product / Service
Kalki Fashion - Key offerings
SWOT

15.10 Koskii Tower Pvt. Ltd.

Koskii Tower Pvt. Ltd. - Overview
Koskii Tower Pvt. Ltd. - Product / Service
Koskii Tower Pvt. Ltd. - Key offerings
SWOT

15.11 Nalli Silk Sarees Pvt. Ltd.

Nalli Silk Sarees Pvt. Ltd. - Overview
Nalli Silk Sarees Pvt. Ltd. - Product / Service
Nalli Silk Sarees Pvt. Ltd. - Key offerings
SWOT

15.12 Neerus Ensembles Pvt. Ltd.

Neerus Ensembles Pvt. Ltd. - Overview
Neerus Ensembles Pvt. Ltd. - Product / Service
Neerus Ensembles Pvt. Ltd. - Key offerings
SWOT

15.13 Purple Style Labs Ltd.

Purple Style Labs Ltd. - Overview
Purple Style Labs Ltd. - Product / Service
Purple Style Labs Ltd. - Key offerings
SWOT

15.14 Ritika Pvt. Ltd.

Ritika Pvt. Ltd. - Overview
Ritika Pvt. Ltd. - Product / Service
Ritika Pvt. Ltd. - Key offerings
SWOT

15.15 Sabyasachi Calcutta LLP

Sabyasachi Calcutta LLP - Overview
Sabyasachi Calcutta LLP - Product / Service
Sabyasachi Calcutta LLP - Key offerings
SWOT

15.16 Soch Apparels Pvt. Ltd.

Soch Apparels Pvt. Ltd. - Overview
Soch Apparels Pvt. Ltd. - Product / Service
Soch Apparels Pvt. Ltd. - Key offerings
SWOT

15.17 Tahiliani Design Pvt. Ltd.

Tahiliani Design Pvt. Ltd. - Overview
Tahiliani Design Pvt. Ltd. - Product / Service
Tahiliani Design Pvt. Ltd. - Key offerings
SWOT

15.18 Utsav Fashion Pvt. Ltd.

Utsav Fashion Pvt. Ltd. - Overview
Utsav Fashion Pvt. Ltd. - Product / Service
Utsav Fashion Pvt. Ltd. - Key offerings
SWOT

16. Appendix

16.1 Scope of the report

Market definition
Objectives
Notes and caveats

16.2 Inclusions and exclusions checklist

Inclusions checklist
Exclusions checklist

16.3 Currency conversion rates for US$

16.4 Research methodology

16.5 Data procurement

Information sources

16.6 Data validation

16.7 Validation techniques employed for market sizing

16.8 Data synthesis

16.9 360 degree market analysis

16.10 List of abbreviations

Research Methodology

Technavio presents a detailed picture of the market by way of study, synthesis, and summation of data from multiple sources. The analysts have presented the various facets of the market with a particular focus on identifying the key industry influencers. The data thus presented is comprehensive, reliable, and the result of extensive research, both primary and secondary.

INFORMATION SOURCES

Primary sources

  • Manufacturers and suppliers
  • Channel partners
  • Industry experts
  • Strategic decision makers

Secondary sources

  • Industry journals and periodicals
  • Government data
  • Financial reports of key industry players
  • Historical data
  • Press releases

DATA ANALYSIS

Data Synthesis

  • Collation of data
  • Estimation of key figures
  • Analysis of derived insights

Data Validation

  • Triangulation with data models
  • Reference against proprietary databases
  • Corroboration with industry experts

REPORT WRITING

Qualitative

  • Market drivers
  • Market challenges
  • Market trends
  • Five forces analysis

Quantitative

  • Market size and forecast
  • Market segmentation
  • Geographical insights
  • Competitive landscape

Interested in this report?

Get your sample now to see our research methodology and insights!

Download Now

Frequently Asked Questions

Ethnic Wear market growth will increase by USD 48291.8 million during 2026-2030.

The Ethnic Wear market is expected to grow at a CAGR of 8.3% during 2026-2030.

Ethnic Wear market is segmented by End-user (Women, Men, Kids) Distribution channel (Offline, Online) Price range (Economic, Medium, Premium)

Biba Fashion Ltd., Cbazaar, Fabindia Ltd., Frontier Raas Pvt. Ltd., High Street Essentials Pvt. Ltd., House of Anita Dongre Ltd., Kalki Fashion, Khaadi Corp. Ltd., Koskii Tower Pvt. Ltd., Nalli Silk Sarees Pvt. Ltd., Neerus Ensembles Pvt. Ltd., Peachmode, Purple Style Labs Ltd., Ritika Pvt. Ltd., Sabyasachi Calcutta LLP, Samyakk, Soch Apparels Pvt. Ltd., Tahiliani Design Pvt. Ltd., Utsav Fashion Pvt. Ltd. are a few of the key vendors in the Ethnic Wear market.

APAC will register the highest growth rate of 43.4% among the other regions. Therefore, the Ethnic Wear market in APAC is expected to garner significant business opportunities for the vendors during the forecast period.

India, China, Japan, South Korea, Australia, Indonesia, US, Canada, Mexico, Germany, UK, France, Italy, Spain, The Netherlands, Brazil, Argentina, Chile, Saudi Arabia, UAE, South Africa, Israel, Turkey

  • International market penetration and rise of global luxury flagships is the driving factor this market.

The Ethnic Wear market vendors should focus on grabbing business opportunities from the End-user segment as it accounted for the largest market share in the base year.