
Europe Home Energy Management System Market Size 2025-2029
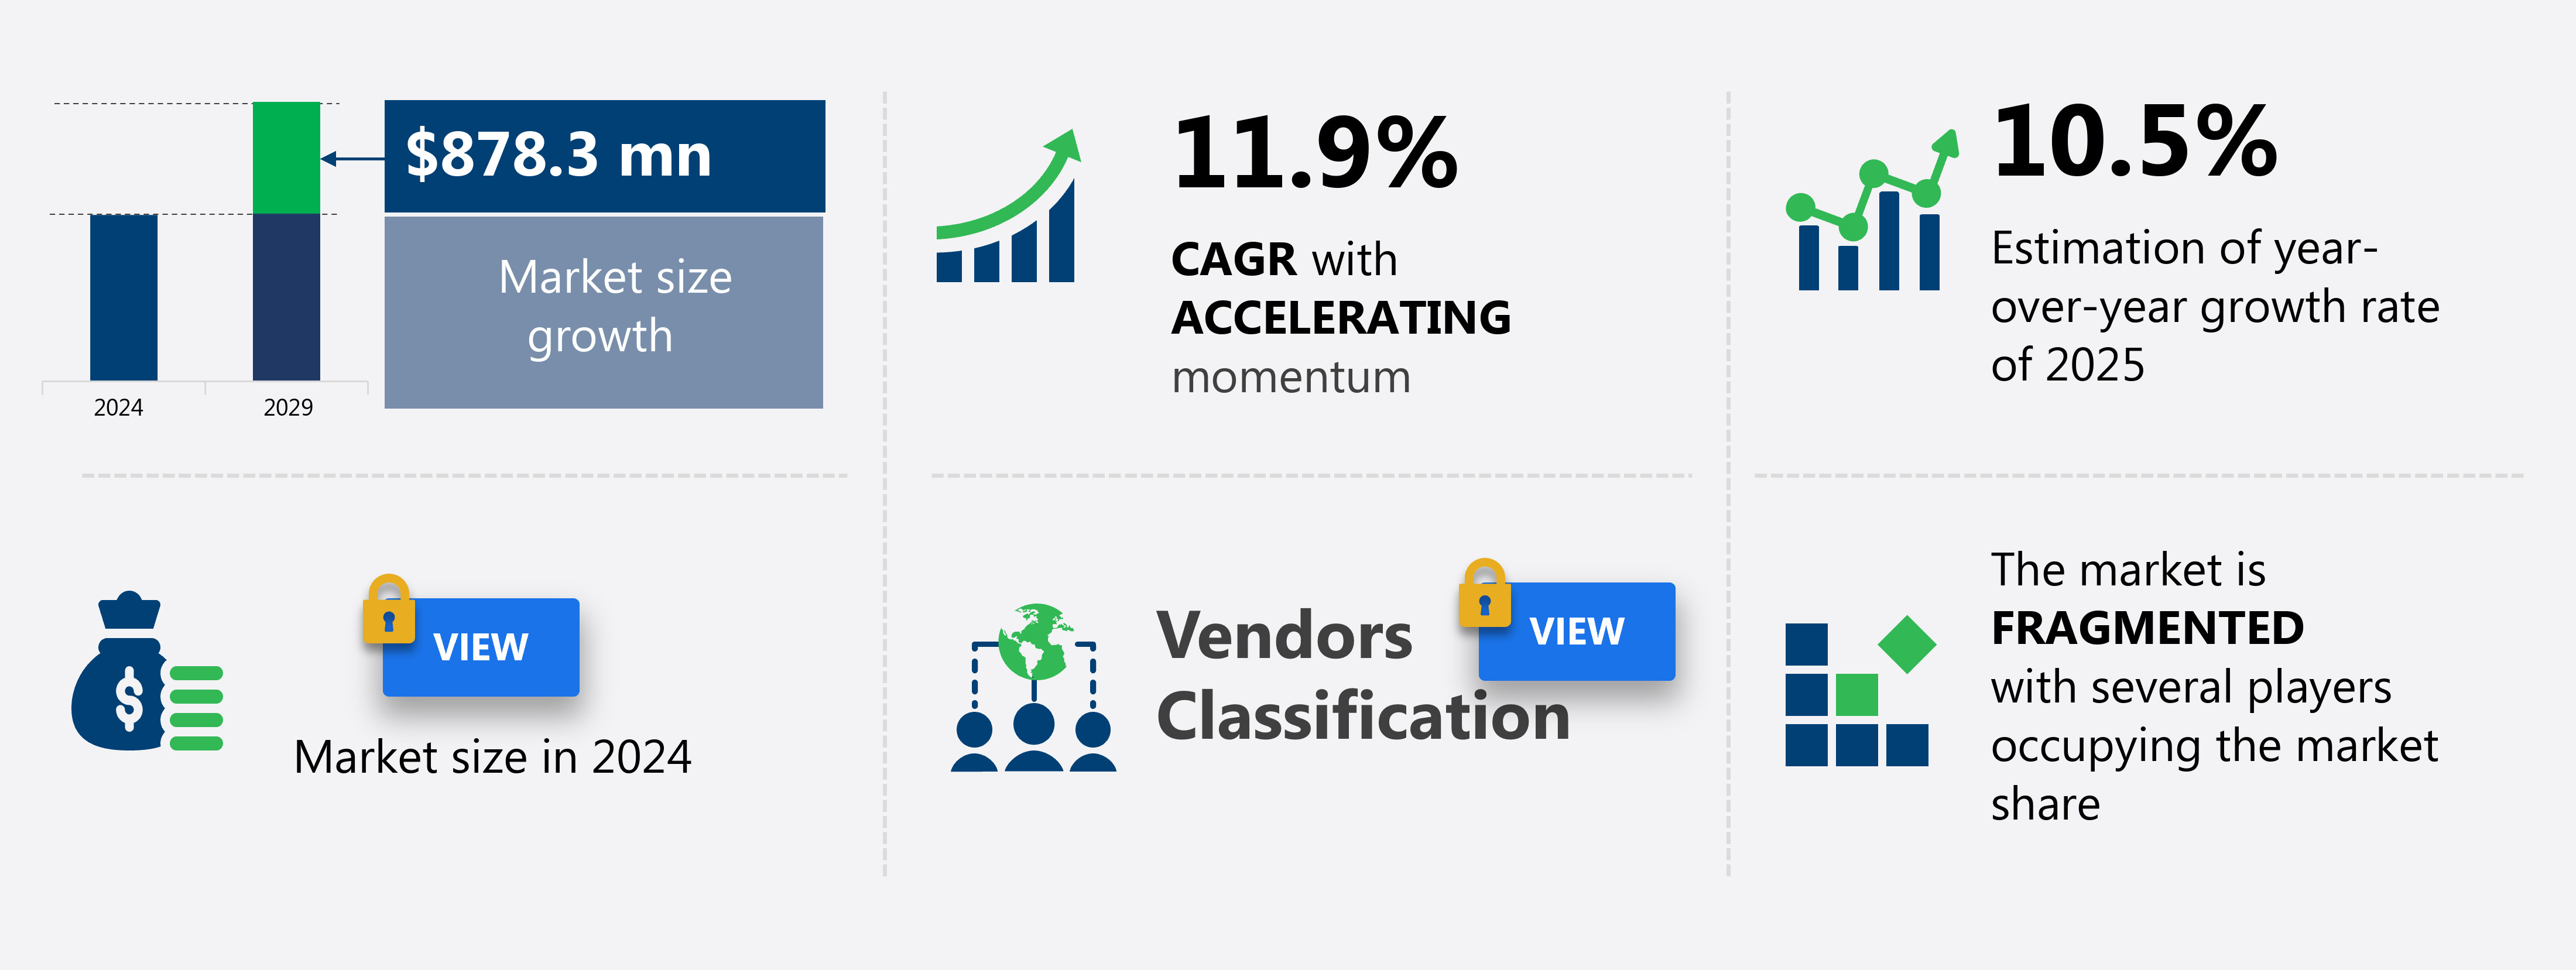
The Europe home energy management system market size is forecast to increase by USD 878.3 million, at a CAGR of 11.9% between 2024 and 2029.
- The market is witnessing significant growth due to various factors. Government regulations and incentives are driving the market, as governments worldwide are promoting energy efficiency and renewable energy adoption. Another trend influencing the market is the increasing acceptance of renewable energy sources, such as solar energy and wind energy, which require effective energy management systems to optimize energy usage. However, the high initial investment costs associated with HEMS implementation remain a challenge for market growth. Despite this, the benefits of energy savings, improved grid reliability, and enhanced energy security are compelling factors for consumers and utilities to invest in HEMS solutions. The market is expected to continue its growth trajectory, offering significant opportunities for technology innovations and business expansions.
What will be the Size of the market During the Forecast Period?
- The market encompasses a range of technologies and strategies aimed at optimizing energy consumption and efficiency in residential buildings. Key trends include the adoption of cloud-based energy management systems, energy conservation strategies, and smart grid technologies. These solutions enable real-time energy analytics and building performance optimization, facilitating energy efficiency upgrades and sustainable living. Distributed energy resources, such as solar panels and wind turbines, are increasingly integrated into home energy management systems, reducing grid dependency and promoting renewable energy integration.
- Building automation, HVAC control systems, and energy modeling software facilitate dynamic regulation and energy cost reduction. Energy-efficient appliances, lighting, and green building practices are essential components of this market, with energy audits and eco-friendly technology playing crucial roles in assessing and enhancing energy performance. The market is driven by growing awareness of energy efficiency standards and the desire for sustainable building design and smart home automation. Energy storage solutions and microgrids further expand the capabilities of home energy management systems, ensuring reliable energy supply and resilience.
How is this market segmented and which is the largest segment?
The market research report provides comprehensive data (region-wise segment analysis), with forecasts and estimates in "USD million" for the period 2025-2029, as well as historical data from 2019-2023 for the following segments.
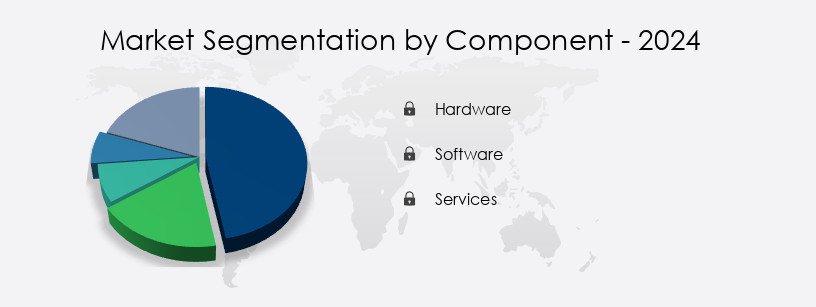
- Component
- Hardware
- Software
- Services
- Type
- Lighting controls
- Programmable communicating thermostats
- Intelligent HVAC Controllers
- Advanced central controllers
- Self-monitoring systems and services
- End-user
- Apartments
- Standalone homes
- Geography
- Europe
- Germany
- UK
- France
- Spain
- Europe
By Component Insights
- The hardware segment is estimated to witness significant growth during the forecast period.
The European home energy management system (HEMS) market consists of hardware components that enable efficient energy monitoring, control, and management within residential properties. Sensors are a key element, measuring parameters such as temperature, occupancy, humidity, and energy consumption in various appliances or zones. By analyzing this data in real-time, HEMS optimize energy usage, ensuring maximum efficiency. For example, occupancy sensors can detect unoccupied rooms and automatically adjust lighting and HVAC settings to conserve energy. Additionally, HEMS incorporate advanced technologies like hybrid cloud deployment, AI, and data analytics to enhance energy savings and peak demand management.
Wireless protocols such as Bluetooth, Z-Wave, and IoT-enabled devices facilitate seamless communication between devices and the central system. Energy storage solutions like thermal energy storage (TES) and battery storage, as well as renewable energy sources like wind turbines and solar photovoltaics, are integrated for energy independence and sustainability. HEMS also offer consumer convenience through voice-activated assistants like Google Assistant and smart thermostats, and provide energy monitoring and cost savings withIn the smart home ecosystem.
Get a glance at the market report of share of various segments Request Free Sample
Market Dynamics
Our market researchers analyzed the data with 2024 as the base year, along with the key drivers, trends, and challenges. A holistic analysis of drivers will help companies refine their marketing strategies to gain a competitive advantage.
What are the key market drivers leading to the rise in the adoption of Europe Home Energy Management System Market?
Government regulations and incentives is the key driver of the market.
- The market is driven by government regulations and incentives, encouraging homeowners to adopt energy-efficient solutions for optimizing energy use. The EU Climate Law, adopted in June 2021, legally binds the EU to reduce emissions by 55% by 2030 and achieve climate neutrality by 2050. This law promotes the widespread adoption of energy-saving technologies, including HEMS, which optimize energy consumption and integrate renewable sources. HEMS utilizes wireless protocols such as Bluetooth, Z-Wave, and Wi-Fi to connect smart devices, including HVAC systems, lighting systems, and energy-efficient appliances. Hybrid cloud deployment and AI-based analytics enable real-time energy consumption monitoring, enabling consumers to make corrective measures and save costs.
- Peak demand management and thermal energy storage systems, like TES and energy storage systems, ensure energy independence and efficient load management. Hybrid technology, such as wind turbines and solar power, integrates with HEMS, allowing for renewable energy sources to be utilized effectively. Smart cities and IoT-enabled devices contribute to real-time energy conservation and environmental awareness. Consumers can monitor and control energy usage through voice-activated assistants like Google Assistant and thermostats, enhancing consumer convenience. Energy goals, such as energy efficiency and sustainability, are at the forefront of HEMS adoption. Maintenance and installation costs are offset by long-term savings and the potential for energy independence.
- Energy consumption patterns are analyzed through AI-based analytics, enabling homeowners to make informed decisions and reduce inefficiencies. HEMS encompasses various components, including HVAC systems for heating and cooling, energy monitoring, lighting controls, and energy storage systems. The market's growth is fueled by the increasing demand for sustainable living and the integration of renewable energy sources into the smart home ecosystem. Home batteries and smart meters are essential components of HEMS, facilitating energy storage and consumption.
What are the market trends shaping the Europe Home Energy Management System Market?
Growing adoption of renewable energy is the upcoming trend In the market.
- The market is experiencing significant growth due to the increasing adoption of renewable energy sources, particularly solar panels and battery storage systems, In the residential sector. By the end of 2023, Europe's rooftop solar capacity surpassed 170 GW, with projections indicating a near doubling to 350 GW by 2027. HEMS plays a crucial role in optimizing energy generation, storage, and consumption from these resources, ensuring households can efficiently manage their renewable energy. Wireless protocols, such as Bluetooth and Z-Wave, enable seamless communication between smart devices, including HVAC systems, lighting systems, and energy-efficient appliances. Hybrid cloud deployment and AI-based analytics enable real-time energy consumption monitoring, enabling consumers to make corrective measures and reduce inefficiencies.
- Hybrid technology, including thermal energy storage (TES), energy storage systems, and peak demand management, further enhance energy savings. Smart cities and IoT-enabled devices are also driving the demand for HEMS, with real-time energy conservation and consumption pattern analysis providing significant cost savings. Energy efficiency and environmental awareness are key drivers, with consumers seeking to minimize their carbon footprint and reduce energy usage. Voice-activated assistants, such as Google Assistant, enable consumers to control their thermostats, lighting, and energy monitoring systems with ease, adding to the convenience of HEMS.
- The integration of wind turbines and other renewable energy sources further enhances the capabilities of HEMS, providing energy independence and load management. ML and AI-based analytics enable predictive maintenance and optimize energy usage, ensuring that households can maximize their energy savings and minimize their environmental impact. Overall, HEMS is a vital component of the smart home ecosystem, enabling consumers to live more sustainable lifestyles while reducing energy consumption and costs.
What challenges does the Europe Home Energy Management System Market face during the growth?
High initial investment costs is a key challenge affecting the market growth.
- Home Energy Management Systems (HEMS) in the marketplace are gaining traction due to their ability to optimize energy usage and promote sustainability. HEMS employ wireless protocols, such as Bluetooth, Z-Wave, and Wi-Fi, to connect various smart devices, including HVAC systems, lighting systems, and energy-efficient appliances. These systems leverage hybrid cloud deployment, AI, and data analytics to identify inefficiencies and suggest corrective measures in real-time. HEMS enable peak demand management, thermal energy storage, and the integration of renewable energy sources like wind turbines and solar photovoltaics. Smart cities are increasingly adopting these energy-efficient solutions to reduce energy consumption and promote environmental awareness.
- The primary challenge to the widespread adoption of HEMS is the high initial investment. Homeowners face substantial setup charges for both hardware components, such as smart meters, sensors, and energy storage systems, and software subscriptions for data analytics and AI-based analytics. For instance, a residential HEMS installation, including smart devices and software platforms, can cost between USD 1,000 and USD 5,000. Despite the upfront expense, HEMS offer significant long-term cost savings through energy conservation and the integration of renewable energy sources. Smart grids and IoT-enabled devices facilitate real-time energy consumption monitoring and conservation, while voice-activated assistants enable consumer convenience. Home batteries and energy storage systems further enhance energy independence and load management.
Exclusive Customer Landscape
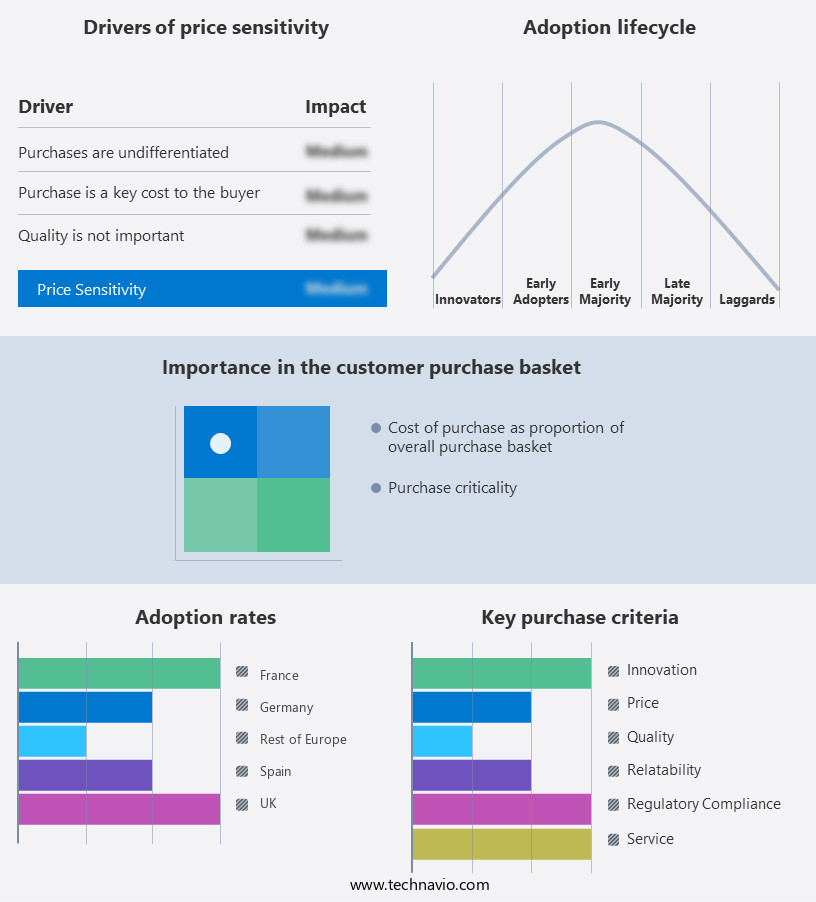
The market forecasting report includes the adoption lifecycle of the market, covering from the innovator's stage to the laggard's stage. It focuses on adoption rates in different regions based on penetration. Furthermore, the market report also includes key purchase criteria and drivers of price sensitivity to help companies evaluate and develop their market growth analysis strategies.
Customer Landscape
Key Companies & Market Insights
Companies are implementing various strategies, such as strategic alliances, market forecast, partnerships, mergers and acquisitions, geographical expansion, and product/service launches, to enhance their presence In the market.
1KOMMA5 GmbH - The company offers home energy management system such as Heartbeat which optimizes energy demand at home, resulting in an increase in photovoltaic self-consumption by 10%.
The market research and growth report includes detailed analyses of the competitive landscape of the market and information about key companies, including:
- 1KOMMA5 GmbH
- ABB Ltd.
- E.ON SE
- Eaton Corp. plc
- EDF Energy
- Enel Spa
- ENGIE SA
- GE Vernova Inc.
- Honeywell International Inc.
- Intel Corp.
- Johnson Controls International Plc
- NEC Corp.
- Octopus Energy Ltd.
- Panasonic Holdings Corp.
- Robert Bosch GmbH
- Schneider Electric SE
Qualitative and quantitative analysis of companies has been conducted to help clients understand the wider business environment as well as the strengths and weaknesses of key market players. Data is qualitatively analyzed to categorize companies as pure play, category-focused, industry-focused, and diversified; it is quantitatively analyzed to categorize companies as dominant, leading, strong, tentative, and weak.
Research Analyst Overview
The market is witnessing significant growth due to the increasing emphasis on energy savings and environmental awareness. These systems enable homeowners to effectively manage their energy consumption and optimize the use of various energy sources. Hybrid cloud deployment and wireless protocols, such as Bluetooth and Z-Wave, play a crucial role in the seamless integration of smart devices and building systems. The integration of HVAC systems, thermal energy storage, and AI-based analytics allows for peak demand management and real-time energy conservation. Smart cities and energy-efficient solutions are also driving the market, as renewable energy sources, such as wind turbines and solar power, become more prevalent.
Further, energy management systems provide valuable data analytics, enabling homeowners to identify inefficiencies and implement corrective measures. These systems can also be integrated with energy storage systems, such as batteries, to ensure energy independence and load management. The residential sector is a significant market for home energy management systems, as consumers seek to reduce energy usage and save costs. Energy goals and sustainable lifestyles are becoming increasingly important, with many homeowners opting for energy-efficient appliances and lighting systems. Maintenance and installation costs are important considerations for homeowners, with software subscription models and IoT-enabled devices offering cost savings and consumer convenience.
In addition, energy monitoring and voice-activated assistants are also popular features, allowing for real-time energy consumption tracking and control. Solar photovoltaics and solar power are becoming more common, with electrification and the integration of home batteries providing additional benefits. The market for home energy management systems is expected to continue growing, as more homeowners seek to reduce their environmental footprint and save on energy costs. The integration of AI and ML algorithms in energy management systems allows for advanced energy efficiency and automated corrective measures. Smart grids and thermal energy storage are also becoming more prevalent, enabling homeowners to effectively manage their energy consumption and optimize the use of renewable sources.
|
Market Scope |
|
|
Report Coverage |
Details |
|
Page number |
214 |
|
Base year |
2024 |
|
Historic period |
2019-2023 |
|
Forecast period |
2025-2029 |
|
Growth momentum & CAGR |
Accelerate at a CAGR of 11.9% |
|
Market Growth 2025-2029 |
USD 878.3 million |
|
Market structure |
Fragmented |
|
YoY growth 2024-2025(%) |
10.5 |
|
Key countries |
Germany, UK, France, Spain, and Rest of Europe |
|
Competitive landscape |
Leading Companies, Market Positioning of Companies, Competitive Strategies, and Industry Risks |
What are the Key Data Covered in this Market Research and Growth Report?
- CAGR of the market during the forecast period
- Detailed information on factors that will drive the market growth and forecasting between 2025 and 2029
- Precise estimation of the size of the market and its contribution of the market in focus to the parent market
- Accurate predictions about upcoming market growth and trends and changes in consumer behaviour
- Growth of the market across Europe
- Thorough analysis of the market's competitive landscape and detailed information about companies
- Comprehensive analysis of factors that will challenge the growth of market companies
We can help! Our analysts can customize this market research report to meet your requirements.