Europe Light Commercial Vehicle Market Size 2026-2030
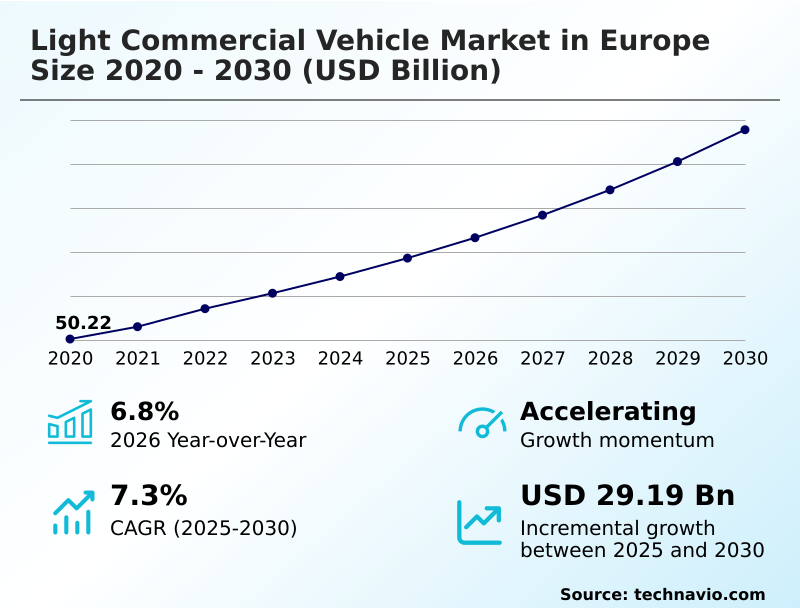
The europe light commercial vehicle market size is valued to increase by USD 29.19 billion, at a CAGR of 7.3% from 2025 to 2030. Stringent regulatory framework and government incentives will drive the europe light commercial vehicle market.
Major Market Trends & Insights
- By Type - Conventional fuel vehicles segment was valued at USD 56.60 billion in 2024
- By Vehicle Type - Light commercial pick-up trucks segment accounted for the largest market revenue share in 2024
Market Size & Forecast
- Market Opportunities: USD 47.57 billion
- Market Future Opportunities: USD 29.19 billion
- CAGR from 2025 to 2030 : 7.3%
Market Summary
- The light commercial vehicle market in Europe is undergoing a fundamental transformation, moving beyond traditional powertrains toward advanced and sustainable alternatives. This shift is driven by stringent emissions regulations and the growing operational demands of sectors like e-commerce and urban logistics.
- Key trends include the accelerated adoption of electric models, the integration of sophisticated telematics and fleet management systems for enhanced efficiency, and the development of specialized vehicles for last-mile delivery. For instance, a logistics firm can leverage a connected fleet to optimize delivery routes in real-time, reducing fuel consumption and improving on-time performance by double-digit percentages.
- However, the market faces challenges related to the high upfront cost of electric vehicles, the nascent state of charging infrastructure, and uncertainties in the total cost of ownership.
- The industry's evolution hinges on balancing these factors, with manufacturers focusing on developing a diverse portfolio of vehicles, including battery-electric, hydrogen, and highly efficient internal combustion engine models, to meet the varied requirements of commercial operators across the continent. This dynamic environment requires strategic fleet planning to navigate the transition effectively.
What will be the Size of the Europe Light Commercial Vehicle Market during the forecast period?
Get Key Insights on Market Forecast (PDF) Get Free Sample
How is the Europe Light Commercial Vehicle Market Segmented?
The europe light commercial vehicle industry research report provides comprehensive data (region-wise segment analysis), with forecasts and estimates in "USD million" for the period 2026-2030, as well as historical data from 2020-2024 for the following segments.
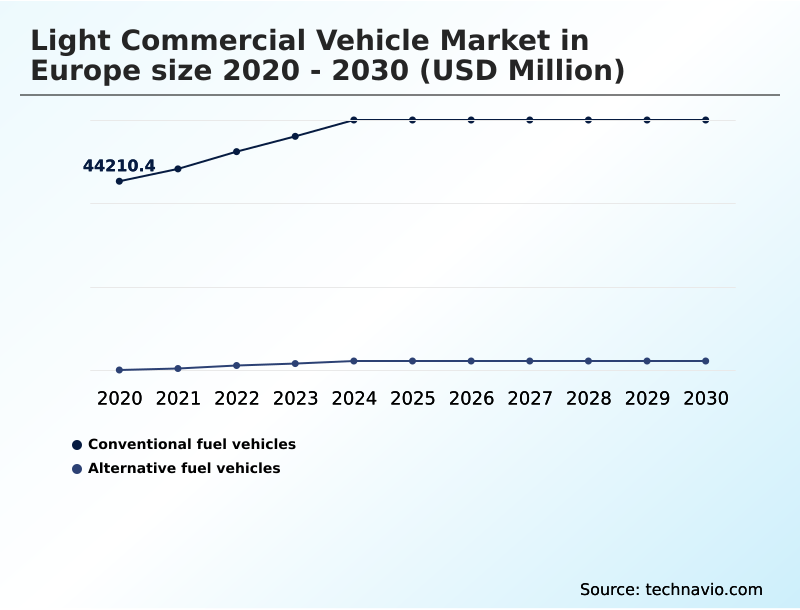
- Type
- Conventional fuel vehicles
- Alternative fuel vehicles
- Vehicle type
- Light commercial pick-up trucks
- Light commercial vans
- Variant
- ICE
- Hybrid and electric vehicles
- Geography
- Europe
- France
- UK
- Germany
- Europe
By Type Insights
The conventional fuel vehicles segment is estimated to witness significant growth during the forecast period.
The market is segmented by powertrain, where the internal combustion engine lcv segment is adapting to meet stringent diesel engine emission standards. These vehicles remain crucial for applications demanding high commercial vehicle payload capacity and extensive range.
Simultaneously, the alternative fuel segment, featuring both the zero-emission light commercial vehicle and the emerging hydrogen fuel cell lcv, is expanding.
Fleet procurement decisions are increasingly shaped by total lifecycle costs, tracked via fleet management software that can enhance route efficiency by over 15%.
The integration of telematics data for fleet efficiency and advanced electric drivetrain components is defining modern vehicle design.
Innovations such as lightweight composite materials and a regenerative braking system are becoming standard, while improved commercial vehicle safety ratings are a key focus for manufacturers.
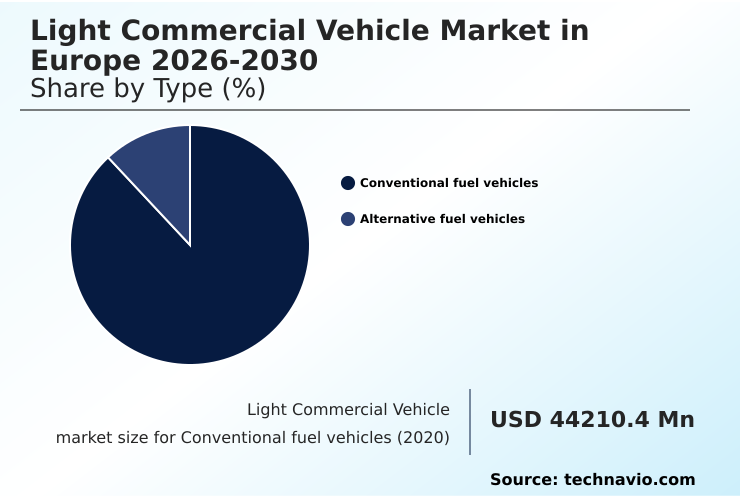
The Conventional fuel vehicles segment was valued at USD 56.60 billion in 2024 and showed a gradual increase during the forecast period.
Market Dynamics
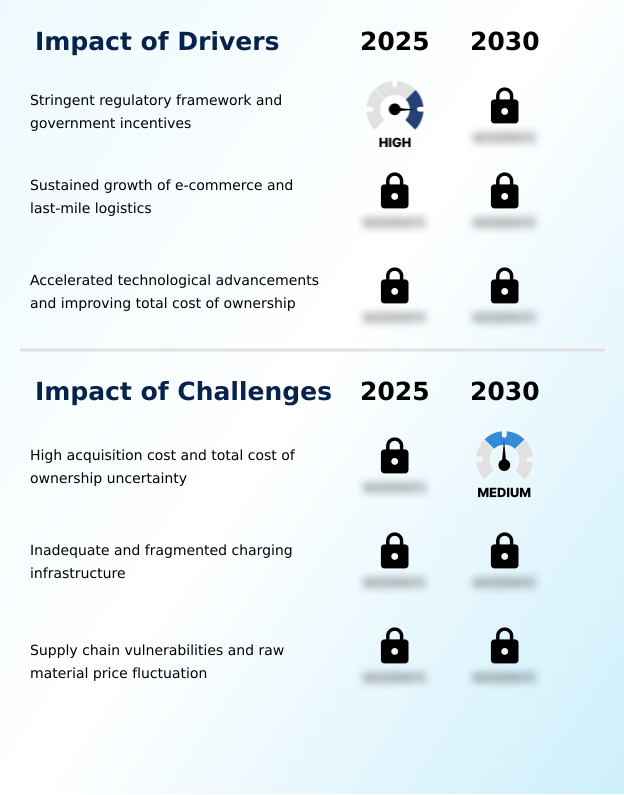
Our researchers analyzed the data with 2025 as the base year, along with the key drivers, trends, and challenges. A holistic analysis of drivers will help companies refine their marketing strategies to gain a competitive advantage.
- Strategic planning in the light commercial vehicle market in Europe requires a deep understanding of several interconnected factors. A primary consideration is the total cost of ownership for electric vans, which extends beyond the initial purchase to include operational expenses.
- Comparing diesel versus electric van maintenance reveals that electric models can offer significant long-term savings, although this is offset by uncertainties in residual value projections for electric lcvs.
- The impact of emission zones on urban delivery is a critical factor influencing fleet composition, making the adoption of adas in light commercial vehicles and superior connectivity features in modern commercial vans essential.
- The challenge of battery range anxiety in commercial vehicles is being addressed by advancements in commercial vehicle battery technology, but the availability of charging infrastructure for commercial fleets, especially overcoming the challenges of depot charging for large fleets, remains a significant hurdle.
- Evaluating the roi of converting fleets to electric lcvs is complex, dependent on government incentives for sme fleet electrification. The role of lcvs in last-mile logistics is undisputed, with operators exploring different powertrain options for light commercial vehicles and the integration of lcvs into smart city logistics.
- Success is also tied to navigating supply chain risks for ev battery components and leveraging platform sharing strategies among lcv manufacturers. The market is also seeing more adapting lcvs for specialized trade applications and optimizing payload and cargo space in electric vans. Efficiently using telematics for optimizing electric fleet routes is now a standard practice for leading operators.
What are the key market drivers leading to the rise in the adoption of Europe Light Commercial Vehicle Industry?
- The market's growth is primarily driven by a stringent regulatory framework and significant government incentives aimed at decarbonizing the road transport sector.
- Strict road transport emission regulations are the primary force shaping the market, with the fit for 55 package impact and eu green deal for transport mandating a shift to alternative fuel vehicle technology.
- These policies compel the adoption of the zero-emission light commercial vehicle and the zero-tailpipe-emission vehicle, particularly for the urban distribution network.
- Low emission zone (lez) compliance is now a critical operational requirement in over 300 European cities, making the urban logistics vehicle a necessity for continued market access.
- The growth of the e-commerce delivery fleet, which has expanded by nearly 40% in recent years, further fuels demand for sustainable logistics solutions.
- Government purchase incentives for evs and support for the municipal service vehicle segment accelerate this transition by offsetting initial capital costs.
What are the market trends shaping the Europe Light Commercial Vehicle Industry?
- The market is defined by an accelerated transition toward electrification. This fundamental transformation is driven by a confluence of regulatory mandates, technological maturation, and evolving commercial demands.
- The market is experiencing a rapid shift, defined by advanced powertrain electrification and the integration of commercial vehicle telematics. This trend supports sophisticated urban mobility solutions and is essential for commercial transport decarbonization. New electric light commercial vehicle platform designs are improving real-world driving range by over 20% compared to previous generations, a critical factor for the electrified logistics fleet.
- The adoption of connected vehicle services and a robust commercial vehicle connectivity platform allows for data-driven optimizations, enhancing the efficiency of the last-mile delivery solution. Integration of advanced driver-assistance systems (adas) is becoming standard, improving safety, while emerging vehicle-to-grid (v2g) capability is being explored, potentially reducing operational costs by 15% through energy grid participation.
- The market is also seeing early-stage exploration of the autonomous delivery vehicle.
What challenges does the Europe Light Commercial Vehicle Industry face during its growth?
- A key challenge affecting industry growth is the high initial acquisition cost of electric models, coupled with uncertainty regarding the total cost of ownership.
- Widespread adoption of electric models is constrained by a challenging total cost of ownership model and an underdeveloped public charging infrastructure. The high price of the commercial vehicle battery pack, which can account for up to 40% of the vehicle's cost, inflates the investment.
- Furthermore, concerns about commercial ev residual value and a complex commercial vehicle lifecycle cost make financial planning difficult. The semiconductor supply chain for automotive remains a vulnerability, while battery raw material sourcing introduces volatility. A comprehensive fleet electrification strategy must account for limited depot charging solutions and the need for specialized after-sales support for evs.
- Innovative models like charging-as-a-service (caas), battery leasing models, and strategies for end-of-life battery management are emerging to mitigate these barriers.
Exclusive Technavio Analysis on Customer Landscape
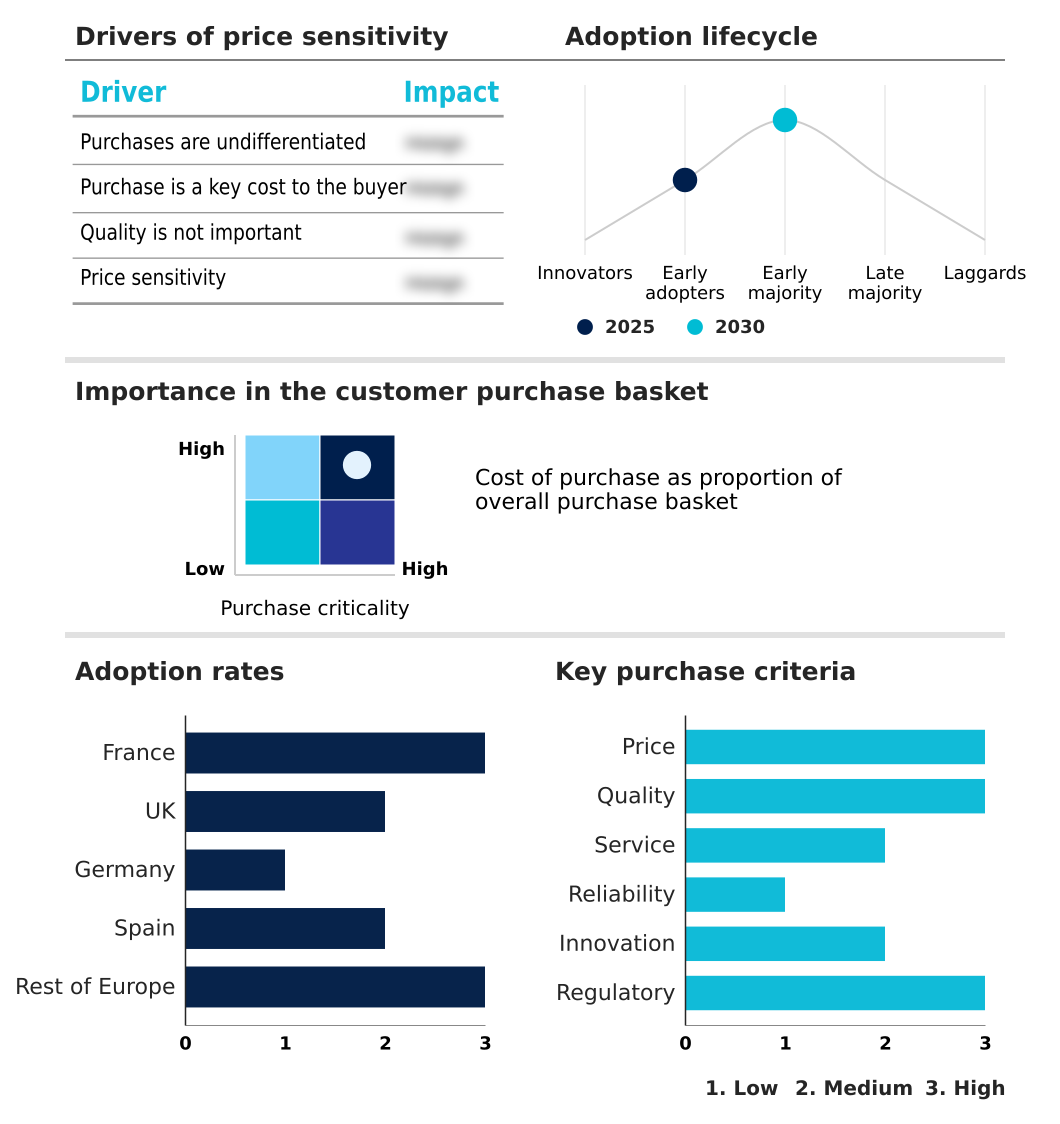
The europe light commercial vehicle market forecasting report includes the adoption lifecycle of the market, covering from the innovator’s stage to the laggard’s stage. It focuses on adoption rates in different regions based on penetration. Furthermore, the europe light commercial vehicle market report also includes key purchase criteria and drivers of price sensitivity to help companies evaluate and develop their market growth analysis strategies.
Customer Landscape of Europe Light Commercial Vehicle Industry
Competitive Landscape
Companies are implementing various strategies, such as strategic alliances, europe light commercial vehicle market forecast, partnerships, mergers and acquisitions, geographical expansion, and product/service launches, to enhance their presence in the industry.
Addex Group Pty. Ltd. - Delivers specialized electric commercial vehicles and integrated productivity software designed to enhance the efficiency of urban and last-mile delivery fleets.
The industry research and growth report includes detailed analyses of the competitive landscape of the market and information about key companies, including:
- Addex Group Pty. Ltd.
- Alke s.r.l.
- B ON
- Cenntro Inc.
- Ford Motor Co.
- Goupil
- Hyundai Motor Co.
- Isuzu Motors Ltd.
- Iveco Group N.V
- MAN Truck and Bus SE
- Mercedes Benz Group AG
- Mitsubishi Fuso
- Nissan Motor Co. Ltd.
- Piaggio and C. S.p.A.
- Renault SAS
- Rivian Automotive Inc.
- SAIC Motor Corp. Ltd.
- Stellantis NV
- Toyota Motor Corp.
- Volkswagen AG
Qualitative and quantitative analysis of companies has been conducted to help clients understand the wider business environment as well as the strengths and weaknesses of key industry players. Data is qualitatively analyzed to categorize companies as pure play, category-focused, industry-focused, and diversified; it is quantitatively analyzed to categorize companies as dominant, leading, strong, tentative, and weak.
Recent Development and News in Europe light commercial vehicle market
- In March 2025, Ford Pro announced the commencement of production for its all-new E-Transit Courier, a milestone marking the complete electrification of its Transit family of vans.
- In April 2025, the European Automobile Manufacturers Association published a report indicating that high initial capital outlay and unpredictable long-term ownership costs were significant factors deterring smaller businesses from electrifying fleets.
- In March 2025, Stellantis Pro One and Iveco Group announced an agreement for Stellantis to supply IVECO with two all-electric light commercial vehicle models, showcasing platform-sharing strategies to reduce costs.
- In June 2025, the European Parliament gave its final approval to the Clean City Logistics Mandate, a directive requiring a significant percentage of last-mile deliveries in major urban areas to be zero-emission.
Dive into Technavio’s robust research methodology, blending expert interviews, extensive data synthesis, and validated models for unparalleled Europe Light Commercial Vehicle Market insights. See full methodology.
| Market Scope | |
|---|---|
| Page number | 196 |
| Base year | 2025 |
| Historic period | 2020-2024 |
| Forecast period | 2026-2030 |
| Growth momentum & CAGR | Accelerate at a CAGR of 7.3% |
| Market growth 2026-2030 | USD 29187.1 million |
| Market structure | Fragmented |
| YoY growth 2025-2026(%) | 6.8% |
| Key countries | France, UK, Germany, Spain and Rest of Europe |
| Competitive landscape | Leading Companies, Market Positioning of Companies, Competitive Strategies, and Industry Risks |
Research Analyst Overview
- The light commercial vehicle market is at a pivotal juncture, defined by a structural shift toward powertrain electrification and sustainability. The development of a dedicated electric light commercial vehicle platform is enabling manufacturers to optimize vehicle design for electric power, improving both performance and commercial vehicle payload capacity. This is crucial for the expanding last-mile delivery solution sector.
- Boardroom decisions are now centered on the fleet electrification strategy, balancing regulatory pressures like low emission zone (lez) compliance with operational realities. The integration of commercial vehicle telematics and connected vehicle services provides granular data, allowing for urban delivery fleet optimization that can reduce operational costs by over 12%.
- While the zero-emission light commercial vehicle is the focus, the market will continue to see a mix of alternative fuel vehicle technology, including the hydrogen fuel cell lcv and advanced internal combustion engine lcv options that meet strict diesel engine emission standards. The adoption of advanced driver-assistance systems (adas) and enhanced commercial vehicle safety ratings are also key priorities.
What are the Key Data Covered in this Europe Light Commercial Vehicle Market Research and Growth Report?
-
What is the expected growth of the Europe Light Commercial Vehicle Market between 2026 and 2030?
-
USD 29.19 billion, at a CAGR of 7.3%
-
-
What segmentation does the market report cover?
-
The report is segmented by Type (Conventional fuel vehicles, and Alternative fuel vehicles), Vehicle Type (Light commercial pick-up trucks, and Light commercial vans), Variant (ICE, and Hybrid and electric vehicles) and Geography (Europe)
-
-
Which regions are analyzed in the report?
-
Europe
-
-
What are the key growth drivers and market challenges?
-
Stringent regulatory framework and government incentives, High acquisition cost and total cost of ownership uncertainty
-
-
Who are the major players in the Europe Light Commercial Vehicle Market?
-
Addex Group Pty. Ltd., Alke s.r.l., B ON, Cenntro Inc., Ford Motor Co., Goupil, Hyundai Motor Co., Isuzu Motors Ltd., Iveco Group N.V, MAN Truck and Bus SE, Mercedes Benz Group AG, Mitsubishi Fuso, Nissan Motor Co. Ltd., Piaggio and C. S.p.A., Renault SAS, Rivian Automotive Inc., SAIC Motor Corp. Ltd., Stellantis NV, Toyota Motor Corp. and Volkswagen AG
-
Market Research Insights
- The market is characterized by a strategic shift in fleet procurement decisions, driven by the need for commercial transport decarbonization and the expansion of the e-commerce delivery fleet. Urban mobility solutions are evolving, with operators leveraging telematics data for fleet efficiency to optimize return-to-base fleet operations, leading to a 15% reduction in idle times for some fleets.
- The focus on commercial vehicle lifecycle cost is intensifying, with battery leasing models emerging to reduce upfront investment. The reliability of the service and maintenance network is a key differentiator, impacting uptime, which has improved by up to 10% with proactive support. Innovations in lightweight composite materials and electric drivetrain components are enhancing performance.
- Smart charging management and mobile charging solutions are critical for maintaining operational continuity, while end-of-life battery management is an integral part of sustainable fleet strategy.
We can help! Our analysts can customize this europe light commercial vehicle market research report to meet your requirements.
 RIA -
RIA - 
