Events Industry Market Analysis, Size, and Forecast 2026-2030: Europe (Germany, UK, and France), North America (US, Canada, and Mexico), APAC (China, Japan, and India), Middle East and Africa (UAE, Saudi Arabia, and South Africa), South America (Brazil and Argentina), and Rest of World (ROW)

Events Industry Market Analysis, Size, and Forecast 2026-2030:
Europe (Germany, UK, and France), North America (US, Canada, and Mexico), APAC (China, Japan, and India), Middle East and Africa (UAE, Saudi Arabia, and South Africa), South America (Brazil and Argentina), and Rest of World (ROW)

Published: May 2026 299 Pages SKU: IRTNTR74592

Market Overview at a Glance

$1122 B
Market Opportunity
12.9%
CAGR 2025 - 2030
36.2%
Europe Growth
$335.2 B
Corporate events and seminar segment 2024

Events Industry Market Size 2026-2030

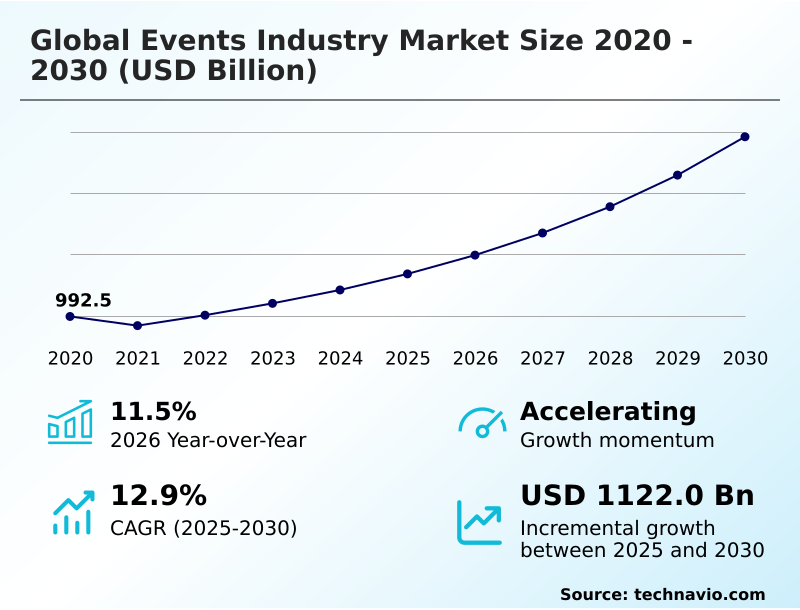
The events industry market size is valued to increase by USD 1122 billion, at a CAGR of 12.9% from 2025 to 2030. Technological integration and AI as operational co-pilot will drive the events industry market.

Major Market Trends & Insights

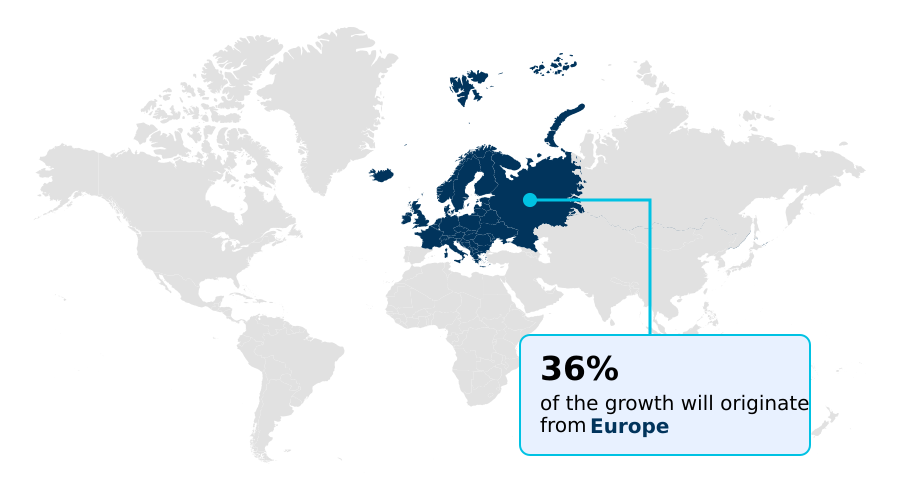
  • Europe dominated the market and accounted for a 36.2% growth during the forecast period.
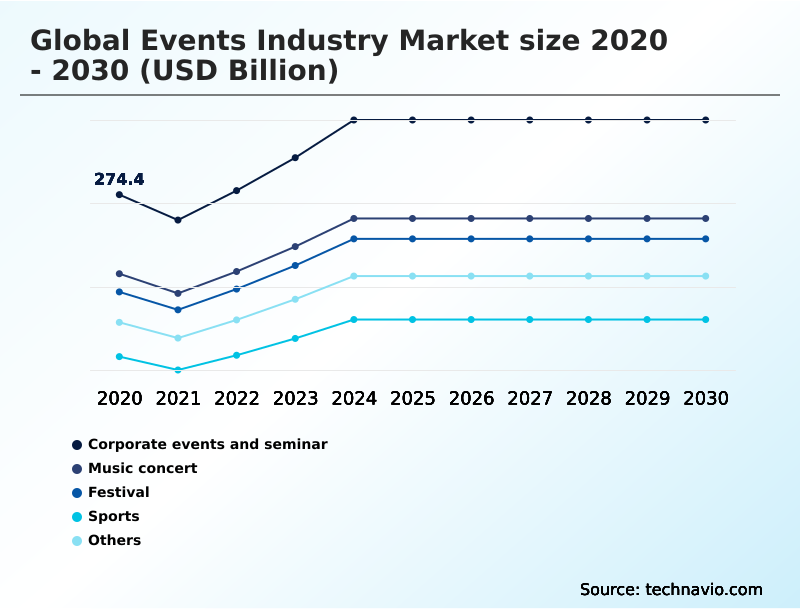
  • By Type - Corporate events and seminar segment was valued at USD 335.2 billion in 2024
  • By Source - Sponsorship segment accounted for the largest market revenue share in 2024

Market Size & Forecast

  • Market Opportunities: USD 1470.3 billion
  • Market Future Opportunities: USD 1122 billion
  • CAGR from 2025 to 2030 : 12.9%

Market Summary

  • The events industry market is undergoing a significant transformation, driven by the convergence of technology and a renewed focus on delivering measurable value. The sector is moving from a logistics-centric model to one centered on creating immersive experiences and fostering meaningful connections.
  • A key aspect of this shift is the widespread adoption of data-driven strategies to enhance attendee engagement and prove return on investment.
  • For instance, a multinational corporation can now use a unified event platform for its global sales kickoff to not only stream content but also to deploy AI-powered matchmaking, track engagement with interactive sessions, and receive real-time analytics on which topics resonate most.
  • This allows for dynamic adjustments and provides concrete data for post-event analysis, connecting event spending directly to business outcomes like lead generation and team performance. This evolution is also shaped by increasing sustainability mandates and the challenge of navigating a complex global regulatory environment, pushing organizers to innovate in areas like circular economy practices and data privacy.

What will be the Size of the Events Industry Market during the forecast period?

Get Key Insights on Market Forecast (PDF) Get Free Sample

How is the Events Industry Market Segmented?

The events industry industry research report provides comprehensive data (region-wise segment analysis), with forecasts and estimates in "USD billion" for the period 2026-2030, as well as historical data from 2020-2024 for the following segments.

  • Type
    • Corporate events and seminar
    • Music concert
    • Festival
    • Sports
    • Others
  • Source
    • Sponsorship
    • Ticket sale
    • Others
  • Age group
    • 21 to 40 years
    • Above 40 years
    • Below 20 years
  • Geography
    • Europe
      • Germany
      • UK
      • France
    • North America
      • US
      • Canada
      • Mexico
    • APAC
      • China
      • Japan
      • India
    • Middle East and Africa
      • UAE
      • Saudi Arabia
      • South Africa
    • South America
      • Brazil
      • Argentina
    • Rest of World (ROW)

By Type Insights

The corporate events and seminar segment is estimated to witness significant growth during the forecast period.

The corporate events and seminar segment is a cornerstone of the professional world, focusing on knowledge exchange, networking, and strategic alignment. These gatherings, from executive retreats to global summits, are now data-rich environments.

The integration of AI-powered matchmaking and QR-based content capture provides measurable return on investment, with advanced behavioral analytics platforms showing a 30% uplift in qualified lead generation for sponsors.

This focus on analytical outcomes, supported by end-to-end event management systems and AI-driven event orchestration, distinguishes corporate events.

A seamless attendee journey is paramount, as hybrid models using high-fidelity metaverse platforms and professional social networks expand reach while maintaining the intimacy of in-person sessions, all managed through a unified event technology.

Get Free Sample

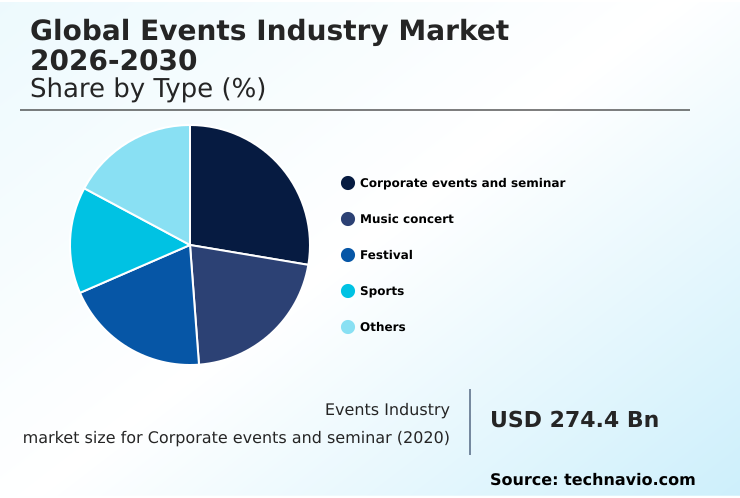
The Corporate events and seminar segment was valued at USD 335.2 billion in 2024 and showed a gradual increase during the forecast period.

Get Free Sample

Regional Analysis

Europe is estimated to contribute 36.2% to the growth of the global market during the forecast period.Technavio’s analysts have elaborately explained the regional trends and drivers that shape the market during the forecast period.

See How Events Industry Market Demand is Rising in Europe Get Free Sample

The geographic landscape is defined by distinct regional specializations and growth trajectories. In North America, the market is characterized by advanced adoption of agentic AI workflows and event technology sectors, focusing on ROI through sophisticated lead scoring.

Europe leads in regulatory-driven innovation, where ESG compliance automation and mandates for double materiality reporting have spurred a 30% increase in demand for green-certified venues and circular event design.

Meanwhile, the APAC region is the fastest-growing market, with governments investing heavily in smart technology infrastructure and 5G connectivity to host large-scale international events, with a reported 35% increase in attendance at major regional trade shows.

South America is professionalizing its sector, with a focus on localized supply chain strategies for its vibrant festival and corporate segments. These dynamics are pushing the industry towards global standards in both technology and sustainability.

Market Dynamics

Our researchers analyzed the data with 2025 as the base year, along with the key drivers, trends, and challenges. A holistic analysis of drivers will help companies refine their marketing strategies to gain a competitive advantage.

  • Successfully navigating the contemporary events landscape requires a holistic approach, starting with measuring ROI with event technology platforms to justify every investment. The implementation of AI for attendee matchmaking and networking has become a critical differentiator, with some platforms seeing a 2x lift in meeting acceptance rates.
  • Concurrently, implementing circular economy principles in events is moving from a talking point to a core operational mandate, particularly when navigating ESG compliance in event management. The impact of phygital models on engagement is profound, creating continuous touchpoints that extend far beyond the physical event.
  • However, this also introduces new challenges, requiring strategies for reducing digital fatigue at events to maintain audience attention. The role of AI in event lead generation is being redefined, moving from simple capture to predictive qualification. To support these large gatherings, developing a sustainable supply chain for large-scale events is essential for both environmental and brand integrity.
  • Ultimately, leveraging data analytics for personalized events is the key to creating unique experiences. Technology's role in event security management, especially with advanced biometrics, has also become non-negotiable. As organizers face the challenge of managing inflation in event budgeting, they must overcome event technology stack integration challenges to achieve efficiency.
  • This allows them to focus on creating immersive brand activation experiences and perfecting best practices for hybrid event design, all while analyzing attendee behavior with AI tools. The goal is balancing technology and human interaction in events to shape the future of virtual and hybrid meetings.
  • Digital twin technology for event planning helps model outcomes, while improving attendee journey with mobile apps ensures a seamless experience. Throughout this process, maintaining data privacy compliance for global events remains a paramount concern.

What are the key market drivers leading to the rise in the adoption of Events Industry Industry?

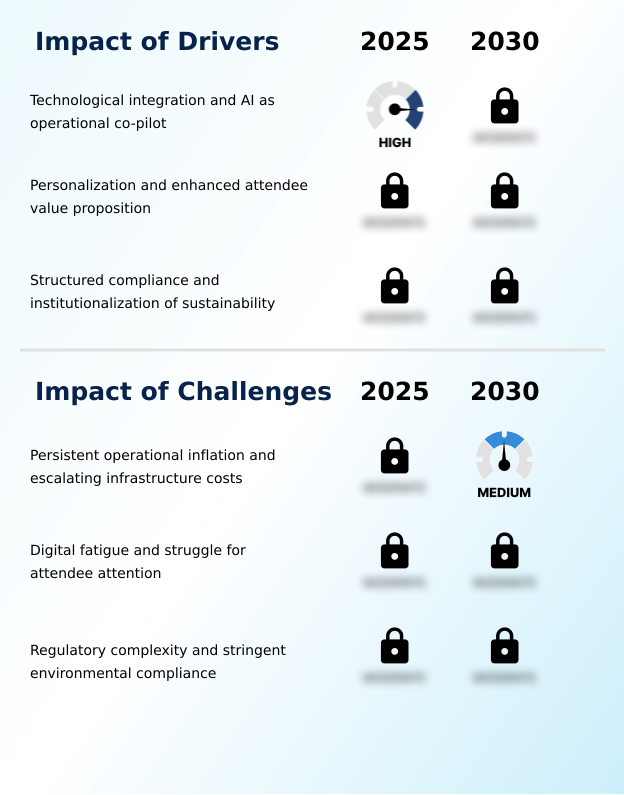
  • Technological integration, particularly the use of AI as an operational co-pilot, is a key driver accelerating market growth.

  • Market growth is fundamentally driven by technology's role in proving value and enhancing experience. The transition to AI as an operational co-pilot, using agentic AI workflows and predictive venue analytics, has improved operational efficiency by over 35% in some cases.
  • Hyper-personalization, delivered through algorithmic networking and choose-your-own-adventure app experiences, is another major driver, increasing attendee satisfaction scores by an average of 25%.
  • Furthermore, the formalization of ESG standards into regulatory requirements is compelling the industry to adopt sustainable practices, such as waste reduction and carbon footprint tracking.
  • This has stimulated innovation, with organizations using data integrity tools and predictive analytics not only for compliance but also to strengthen brand reputation and attract a more conscious audience.

What are the market trends shaping the Events Industry Industry?

  • A key market trend is the integration of agentic AI within unified event technology stacks. This evolution moves beyond basic automation to create intelligent, autonomous ecosystems.

  • Key market trends are defined by a move toward intelligent automation and deep personalization. The adoption of phygital journey mapping is creating continuous engagement, with hybrid events showing a 30% higher content retention rate among attendees compared to purely virtual formats.
  • Sustainability has also become a central trend, with the use of modular stage sets and circular economy principles reducing event-related waste by up to 50% in pioneering projects. Furthermore, real-time sentiment tracking and AI-powered matchmaking are transforming networking, creating more valuable interactions.
  • This is supported by advanced tools for bid analysis, post-event impact reports, and the deployment of generative AI agents for complex logistics, ensuring a more efficient and impactful event lifecycle.

What challenges does the Events Industry Industry face during its growth?

  • Persistent operational inflation and escalating infrastructure costs present a key challenge affecting the industry's growth trajectory.

  • The industry faces significant headwinds, primarily from persistent operational inflation, which has increased infrastructure costs by an average of 15% in major markets. This financial pressure is compounded by the challenge of digital fatigue, as attendee engagement on virtual platform gamification features has declined by up to 40% from peak levels, forcing a re-evaluation of hybrid models.
  • Organizers are increasingly requested to deliver 'phone-down experiences' to combat screen saturation. Moreover, navigating the complex and fragmented regulatory landscape, especially around Scope 3 emissions reporting and data privacy, presents a substantial challenge. This requires specialized expertise to ensure carbon-neutral operations and compliance, adding administrative layers and creating a difficult environment for smaller players in the event technology sector.

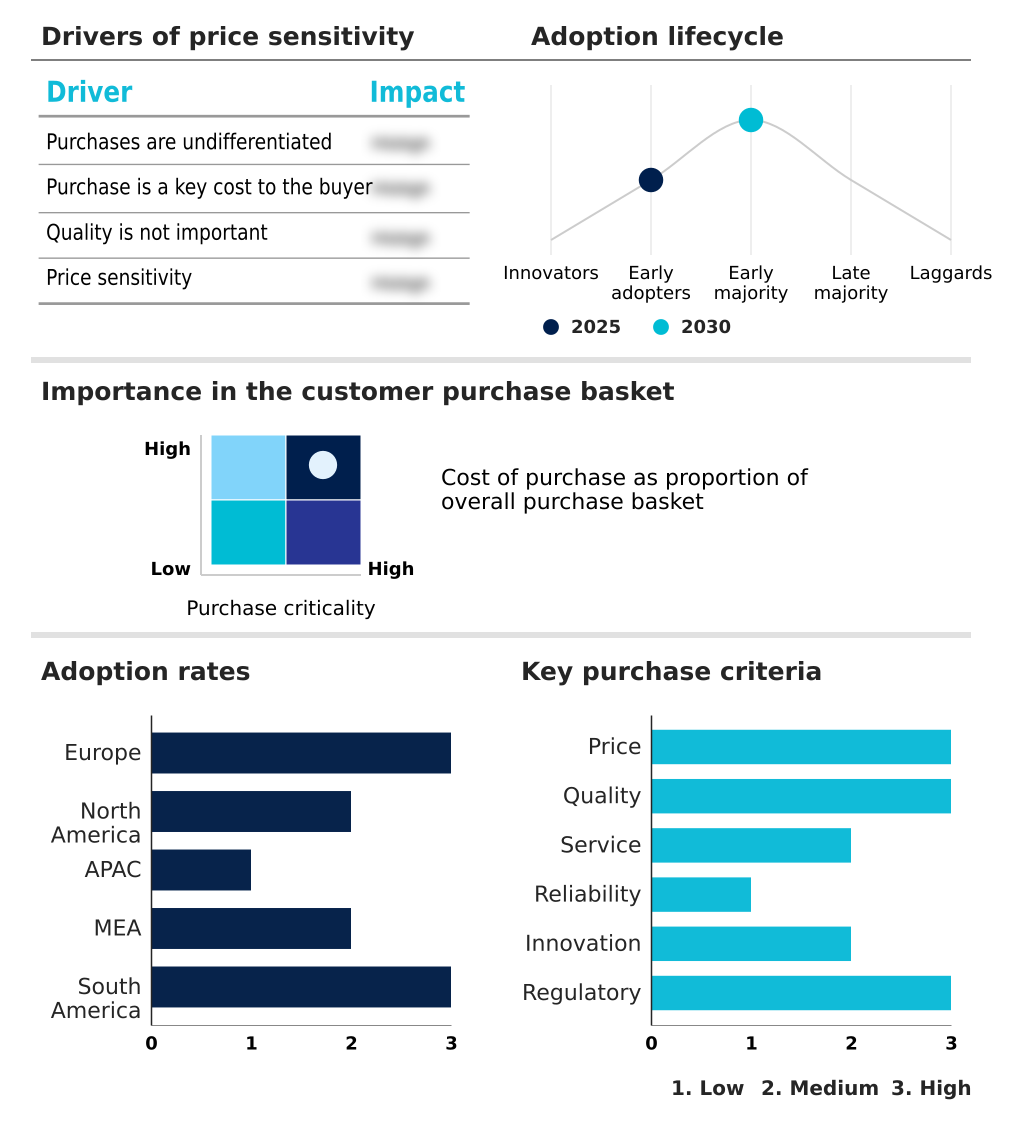
Exclusive Technavio Analysis on Customer Landscape

The events industry market forecasting report includes the adoption lifecycle of the market, covering from the innovator’s stage to the laggard’s stage. It focuses on adoption rates in different regions based on penetration. Furthermore, the events industry market report also includes key purchase criteria and drivers of price sensitivity to help companies evaluate and develop their market growth analysis strategies.

Customer Landscape of Events Industry Industry

Competitive Landscape

Companies are implementing various strategies, such as strategic alliances, events industry market forecast, partnerships, mergers and acquisitions, geographical expansion, and product/service launches, to enhance their presence in the industry.

BCD Meetings and Events - Provides cloud-based software solutions for event management, venue sourcing, and attendee engagement.

The industry research and growth report includes detailed analyses of the competitive landscape of the market and information about key companies, including:

  • BCD Meetings and Events
  • Clarion Events Ltd.
  • Comexposium
  • Cvent Inc
  • Deutsche Messe AG
  • Easyfairs
  • Emerald X LLC
  • Fira de Barcelona
  • George P. Johnson
  • GL events Group
  • Hyve Group Ltd.
  • Informa PLC
  • Koelnmesse GmbH
  • MCH Group AG
  • Messe Dusseldorf GmbH
  • Messe Frankfurt GmbH
  • Messe Munchen GmbH
  • Reed Exhibitions Ltd.
  • The Freeman Co.

Qualitative and quantitative analysis of companies has been conducted to help clients understand the wider business environment as well as the strengths and weaknesses of key industry players. Data is qualitatively analyzed to categorize companies as pure play, category-focused, industry-focused, and diversified; it is quantitatively analyzed to categorize companies as dominant, leading, strong, tentative, and weak.

Recent Development and News in Events industry market

  • In April 2025, Cvent Inc. finalized its acquisition of ON24, a strategic move to merge webinar and virtual event data into its comprehensive event management platform, enhancing its event-led growth capabilities.
  • In January 2025, Bizzabo launched its new AI-powered 'Pipeline Impact' module, designed to provide marketers with direct attribution tools that connect event engagement metrics to tangible sales pipeline.
  • In September 2024, Informa PLC announced a partnership with a leading circular economy solutions provider to implement a fully reusable and trackable exhibition stand program across its major European trade shows, reinforcing its commitment to sustainability.
  • In November 2024, GL events Group secured a multi-year contract to manage and operate three new state-of-the-art exhibition centers in Riyadh, supporting Saudi Arabia's Vision 2030 by expanding the region's MICE infrastructure.

Dive into Technavio’s robust research methodology, blending expert interviews, extensive data synthesis, and validated models for unparalleled Events Industry Market insights. See full methodology.

Market Scope
Page number 299
Base year 2025
Historic period 2020-2024
Forecast period 2026-2030
Growth momentum & CAGR Accelerate at a CAGR of 12.9%
Market growth 2026-2030 USD 1122.0 billion
Market structure Fragmented
YoY growth 2025-2026(%) 11.5%
Key countries Germany, UK, France, Spain, Italy, The Netherlands, US, Canada, Mexico, China, Japan, India, South Korea, Australia, Indonesia, UAE, Saudi Arabia, South Africa, Turkey, Israel, Brazil, Argentina and Chile
Competitive landscape Leading Companies, Market Positioning of Companies, Competitive Strategies, and Industry Risks

Request Free Sample

Research Analyst Overview

  • The events industry is undergoing a structural shift, prioritizing the integration of predictive crowd management and automated lead scoring as standard practice. This is driven by the necessity to deliver and demonstrate value, compelling a move towards real-time data analytics and away from legacy metrics.
  • The institutionalization of ESG standards has made digital twin sustainability modeling a critical component of pre-event planning, influencing boardroom decisions on capital allocation for venue and supplier selection. Organizations leveraging a seamless attendee journey through unified technology see a marked improvement in participant satisfaction.
  • A key development is the use of generative AI agents for tasks like bid analysis and attendee behavior prediction, with early adopters reporting a 20% reduction in planning cycle times. This reliance on a smart technology infrastructure, augmented reality applications, and sophisticated behavioral analytics platforms is reshaping the competitive landscape.
  • The market now demands not just execution but a cohesive strategy that incorporates everything from first-party data strategies and contactless entry systems to dynamic pricing models and mobile delivery systems, making the event-led growth platform an essential corporate asset.

What are the Key Data Covered in this Events Industry Market Research and Growth Report?

  • What is the expected growth of the Events Industry Market between 2026 and 2030?

    • USD 1122 billion, at a CAGR of 12.9%

  • What segmentation does the market report cover?

    • The report is segmented by Type (Corporate events and seminar, Music concert, Festival, Sports, and Others), Source (Sponsorship, Ticket sale, and Others), Age Group (21 to 40 years, Above 40 years, and Below 20 years) and Geography (Europe, North America, APAC, Middle East and Africa, South America)

  • Which regions are analyzed in the report?

    • Europe, North America, APAC, Middle East and Africa and South America

  • What are the key growth drivers and market challenges?

    • Technological integration and AI as operational co-pilot, Persistent operational inflation and escalating infrastructure costs

  • Who are the major players in the Events Industry Market?

    • BCD Meetings and Events, Clarion Events Ltd., Comexposium, Cvent Inc, Deutsche Messe AG, Easyfairs, Emerald X LLC, Fira de Barcelona, George P. Johnson, GL events Group, Hyve Group Ltd., Informa PLC, Koelnmesse GmbH, MCH Group AG, Messe Dusseldorf GmbH, Messe Frankfurt GmbH, Messe Munchen GmbH, Reed Exhibitions Ltd. and The Freeman Co.

Market Research Insights

  • The market is shaped by a dynamic interplay between technological advancement and evolving attendee expectations. The adoption of tiered access strategies and on-demand event content is now standard, with platforms reporting a 25% increase in post-event engagement through curated digital communities for events.
  • Experiential marketing activations are becoming more sophisticated, leveraging a hybrid event architecture to blend physical and digital touchpoints. This focus on data-driven attendee engagement is critical, as organizers use event data intelligence to justify budgets and refine future programming.
  • The shift is evident, with events utilizing immersive phygital experiences seeing a 40% higher attendee satisfaction rating compared to traditional formats, underscoring the demand for more interactive and personalized gatherings.

We can help! Our analysts can customize this events industry market research report to meet your requirements.

Get in touch

1. Executive Summary

1.1 Market overview

Executive Summary - Chart on Market Overview
Executive Summary - Data Table on Market Overview
Executive Summary - Chart on Global Market Characteristics
Executive Summary - Chart on Market by Geography
Executive Summary - Chart on Market Segmentation by Type
Executive Summary - Chart on Market Segmentation by Source
Executive Summary - Chart on Market Segmentation by Age Group
Executive Summary - Chart on Incremental Growth
Executive Summary - Data Table on Incremental Growth
Executive Summary - Chart on Company Market Positioning

2. Technavio Analysis

2.1 Analysis of price sensitivity, lifecycle, customer purchase basket, adoption rates, and purchase criteria

2.2 Criticality of inputs and Factors of differentiation

Chart on Overview on criticality of inputs and factors of differentiation

2.3 Factors of disruption

Chart on Overview on factors of disruption

2.4 Impact of drivers and challenges

Chart on Impact of drivers and challenges in 2025 and 2030

3. Market Landscape

3.1 Market ecosystem

Chart on Parent Market
Data Table on - Parent Market

3.2 Market characteristics

Chart on Market characteristics analysis

3.3 Value chain analysis

Chart on Value chain analysis

4. Market Sizing

4.1 Market definition

Data Table on Offerings of companies included in the market definition

4.2 Market segment analysis

Market segments

4.3 Market size 2025

4.4 Market outlook: Forecast for 2025-2030

Chart on Global - Market size and forecast 2025-2030 ($ billion)
Data Table on Global - Market size and forecast 2025-2030 ($ billion)
Chart on Global Market: Year-over-year growth 2025-2030 (%)
Data Table on Global Market: Year-over-year growth 2025-2030 (%)

5. Historic Market Size

5.1 Global Events Industry Market 2020 - 2024

Historic Market Size - Data Table on Global Events Industry Market 2020 - 2024 ($ billion)

5.2 Type segment analysis 2020 - 2024

Historic Market Size - Type Segment 2020 - 2024 ($ billion)

5.3 Source segment analysis 2020 - 2024

Historic Market Size - Source Segment 2020 - 2024 ($ billion)

5.4 Age Group segment analysis 2020 - 2024

Historic Market Size - Age Group Segment 2020 - 2024 ($ billion)

5.5 Geography segment analysis 2020 - 2024

Historic Market Size - Geography Segment 2020 - 2024 ($ billion)

5.6 Country segment analysis 2020 - 2024

Historic Market Size - Country Segment 2020 - 2024 ($ billion)

6. Qualitative Analysis

6.1 Impact of AI in global events industry market

6.2 Impact of geopolitical conflict on global events industry market

7. Five Forces Analysis

7.1 Five forces summary

Five forces analysis - Comparison between 2025 and 2030

7.2 Bargaining power of buyers

Bargaining power of buyers - Impact of key factors 2025 and 2030

7.3 Bargaining power of suppliers

Bargaining power of suppliers - Impact of key factors in 2025 and 2030

7.4 Threat of new entrants

Threat of new entrants - Impact of key factors in 2025 and 2030

7.5 Threat of substitutes

Threat of substitutes - Impact of key factors in 2025 and 2030

7.6 Threat of rivalry

Threat of rivalry - Impact of key factors in 2025 and 2030

7.7 Market condition

Chart on Market condition - Five forces 2025 and 2030

8. Market Segmentation by Type

8.1 Market segments

Chart on Type - Market share 2025-2030 (%)
Data Table on Type - Market share 2025-2030 (%)

8.2 Comparison by Type

Chart on Comparison by Type
Data Table on Comparison by Type

8.3 Corporate events and seminar - Market size and forecast 2025-2030

Chart on Corporate events and seminar - Market size and forecast 2025-2030 ($ billion)
Data Table on Corporate events and seminar - Market size and forecast 2025-2030 ($ billion)
Chart on Corporate events and seminar - Year-over-year growth 2025-2030 (%)
Data Table on Corporate events and seminar - Year-over-year growth 2025-2030 (%)

8.4 Music concert - Market size and forecast 2025-2030

Chart on Music concert - Market size and forecast 2025-2030 ($ billion)
Data Table on Music concert - Market size and forecast 2025-2030 ($ billion)
Chart on Music concert - Year-over-year growth 2025-2030 (%)
Data Table on Music concert - Year-over-year growth 2025-2030 (%)

8.5 Festival - Market size and forecast 2025-2030

Chart on Festival - Market size and forecast 2025-2030 ($ billion)
Data Table on Festival - Market size and forecast 2025-2030 ($ billion)
Chart on Festival - Year-over-year growth 2025-2030 (%)
Data Table on Festival - Year-over-year growth 2025-2030 (%)

8.6 Sports - Market size and forecast 2025-2030

Chart on Sports - Market size and forecast 2025-2030 ($ billion)
Data Table on Sports - Market size and forecast 2025-2030 ($ billion)
Chart on Sports - Year-over-year growth 2025-2030 (%)
Data Table on Sports - Year-over-year growth 2025-2030 (%)

8.7 Others - Market size and forecast 2025-2030

Chart on Others - Market size and forecast 2025-2030 ($ billion)
Data Table on Others - Market size and forecast 2025-2030 ($ billion)
Chart on Others - Year-over-year growth 2025-2030 (%)
Data Table on Others - Year-over-year growth 2025-2030 (%)

8.8 Market opportunity by Type

Market opportunity by Type ($ billion)
Data Table on Market opportunity by Type ($ billion)

9. Market Segmentation by Source

9.1 Market segments

Chart on Source - Market share 2025-2030 (%)
Data Table on Source - Market share 2025-2030 (%)

9.2 Comparison by Source

Chart on Comparison by Source
Data Table on Comparison by Source

9.3 Sponsorship - Market size and forecast 2025-2030

Chart on Sponsorship - Market size and forecast 2025-2030 ($ billion)
Data Table on Sponsorship - Market size and forecast 2025-2030 ($ billion)
Chart on Sponsorship - Year-over-year growth 2025-2030 (%)
Data Table on Sponsorship - Year-over-year growth 2025-2030 (%)

9.4 Ticket sale - Market size and forecast 2025-2030

Chart on Ticket sale - Market size and forecast 2025-2030 ($ billion)
Data Table on Ticket sale - Market size and forecast 2025-2030 ($ billion)
Chart on Ticket sale - Year-over-year growth 2025-2030 (%)
Data Table on Ticket sale - Year-over-year growth 2025-2030 (%)

9.5 Others - Market size and forecast 2025-2030

Chart on Others - Market size and forecast 2025-2030 ($ billion)
Data Table on Others - Market size and forecast 2025-2030 ($ billion)
Chart on Others - Year-over-year growth 2025-2030 (%)
Data Table on Others - Year-over-year growth 2025-2030 (%)

9.6 Market opportunity by Source

Market opportunity by Source ($ billion)
Data Table on Market opportunity by Source ($ billion)

10. Market Segmentation by Age Group

10.1 Market segments

Chart on Age Group - Market share 2025-2030 (%)
Data Table on Age Group - Market share 2025-2030 (%)

10.2 Comparison by Age Group

Chart on Comparison by Age Group
Data Table on Comparison by Age Group

10.3 21 to 40 years - Market size and forecast 2025-2030

Chart on 21 to 40 years - Market size and forecast 2025-2030 ($ billion)
Data Table on 21 to 40 years - Market size and forecast 2025-2030 ($ billion)
Chart on 21 to 40 years - Year-over-year growth 2025-2030 (%)
Data Table on 21 to 40 years - Year-over-year growth 2025-2030 (%)

10.4 Above 40 years - Market size and forecast 2025-2030

Chart on Above 40 years - Market size and forecast 2025-2030 ($ billion)
Data Table on Above 40 years - Market size and forecast 2025-2030 ($ billion)
Chart on Above 40 years - Year-over-year growth 2025-2030 (%)
Data Table on Above 40 years - Year-over-year growth 2025-2030 (%)

10.5 Below 20 years - Market size and forecast 2025-2030

Chart on Below 20 years - Market size and forecast 2025-2030 ($ billion)
Data Table on Below 20 years - Market size and forecast 2025-2030 ($ billion)
Chart on Below 20 years - Year-over-year growth 2025-2030 (%)
Data Table on Below 20 years - Year-over-year growth 2025-2030 (%)

10.6 Market opportunity by Age Group

Market opportunity by Age Group ($ billion)
Data Table on Market opportunity by Age Group ($ billion)

11. Customer Landscape

11.1 Customer landscape overview

Analysis of price sensitivity, lifecycle, customer purchase basket, adoption rates, and purchase criteria

12. Geographic Landscape

12.1 Geographic segmentation

Chart on Market share by geography 2025-2030 (%)
Data Table on Market share by geography 2025-2030 (%)

12.2 Geographic comparison

Chart on Geographic comparison
Data Table on Geographic comparison

12.3 Europe - Market size and forecast 2025-2030

Chart on Europe - Market size and forecast 2025-2030 ($ billion)
Data Table on Europe - Market size and forecast 2025-2030 ($ billion)
Chart on Europe - Year-over-year growth 2025-2030 (%)
Data Table on Europe - Year-over-year growth 2025-2030 (%)
Chart on Regional Comparison - Europe
Data Table on Regional Comparison - Europe

12.3.1 Germany - Market size and forecast 2025-2030

Chart on Germany - Market size and forecast 2025-2030 ($ billion)
Data Table on Germany - Market size and forecast 2025-2030 ($ billion)
Chart on Germany - Year-over-year growth 2025-2030 (%)
Data Table on Germany - Year-over-year growth 2025-2030 (%)

12.3.2 UK - Market size and forecast 2025-2030

Chart on UK - Market size and forecast 2025-2030 ($ billion)
Data Table on UK - Market size and forecast 2025-2030 ($ billion)
Chart on UK - Year-over-year growth 2025-2030 (%)
Data Table on UK - Year-over-year growth 2025-2030 (%)

12.3.3 France - Market size and forecast 2025-2030

Chart on France - Market size and forecast 2025-2030 ($ billion)
Data Table on France - Market size and forecast 2025-2030 ($ billion)
Chart on France - Year-over-year growth 2025-2030 (%)
Data Table on France - Year-over-year growth 2025-2030 (%)

12.3.4 Spain - Market size and forecast 2025-2030

Chart on Spain - Market size and forecast 2025-2030 ($ billion)
Data Table on Spain - Market size and forecast 2025-2030 ($ billion)
Chart on Spain - Year-over-year growth 2025-2030 (%)
Data Table on Spain - Year-over-year growth 2025-2030 (%)

12.3.5 Italy - Market size and forecast 2025-2030

Chart on Italy - Market size and forecast 2025-2030 ($ billion)
Data Table on Italy - Market size and forecast 2025-2030 ($ billion)
Chart on Italy - Year-over-year growth 2025-2030 (%)
Data Table on Italy - Year-over-year growth 2025-2030 (%)

12.3.6 The Netherlands - Market size and forecast 2025-2030

Chart on The Netherlands - Market size and forecast 2025-2030 ($ billion)
Data Table on The Netherlands - Market size and forecast 2025-2030 ($ billion)
Chart on The Netherlands - Year-over-year growth 2025-2030 (%)
Data Table on The Netherlands - Year-over-year growth 2025-2030 (%)

12.4 North America - Market size and forecast 2025-2030

Chart on North America - Market size and forecast 2025-2030 ($ billion)
Data Table on North America - Market size and forecast 2025-2030 ($ billion)
Chart on North America - Year-over-year growth 2025-2030 (%)
Data Table on North America - Year-over-year growth 2025-2030 (%)
Chart on Regional Comparison - North America
Data Table on Regional Comparison - North America

12.4.1 US - Market size and forecast 2025-2030

Chart on US - Market size and forecast 2025-2030 ($ billion)
Data Table on US - Market size and forecast 2025-2030 ($ billion)
Chart on US - Year-over-year growth 2025-2030 (%)
Data Table on US - Year-over-year growth 2025-2030 (%)

12.4.2 Canada - Market size and forecast 2025-2030

Chart on Canada - Market size and forecast 2025-2030 ($ billion)
Data Table on Canada - Market size and forecast 2025-2030 ($ billion)
Chart on Canada - Year-over-year growth 2025-2030 (%)
Data Table on Canada - Year-over-year growth 2025-2030 (%)

12.4.3 Mexico - Market size and forecast 2025-2030

Chart on Mexico - Market size and forecast 2025-2030 ($ billion)
Data Table on Mexico - Market size and forecast 2025-2030 ($ billion)
Chart on Mexico - Year-over-year growth 2025-2030 (%)
Data Table on Mexico - Year-over-year growth 2025-2030 (%)

12.5 APAC - Market size and forecast 2025-2030

Chart on APAC - Market size and forecast 2025-2030 ($ billion)
Data Table on APAC - Market size and forecast 2025-2030 ($ billion)
Chart on APAC - Year-over-year growth 2025-2030 (%)
Data Table on APAC - Year-over-year growth 2025-2030 (%)
Chart on Regional Comparison - APAC
Data Table on Regional Comparison - APAC

12.5.1 China - Market size and forecast 2025-2030

Chart on China - Market size and forecast 2025-2030 ($ billion)
Data Table on China - Market size and forecast 2025-2030 ($ billion)
Chart on China - Year-over-year growth 2025-2030 (%)
Data Table on China - Year-over-year growth 2025-2030 (%)

12.5.2 Japan - Market size and forecast 2025-2030

Chart on Japan - Market size and forecast 2025-2030 ($ billion)
Data Table on Japan - Market size and forecast 2025-2030 ($ billion)
Chart on Japan - Year-over-year growth 2025-2030 (%)
Data Table on Japan - Year-over-year growth 2025-2030 (%)

12.5.3 India - Market size and forecast 2025-2030

Chart on India - Market size and forecast 2025-2030 ($ billion)
Data Table on India - Market size and forecast 2025-2030 ($ billion)
Chart on India - Year-over-year growth 2025-2030 (%)
Data Table on India - Year-over-year growth 2025-2030 (%)

12.5.4 South Korea - Market size and forecast 2025-2030

Chart on South Korea - Market size and forecast 2025-2030 ($ billion)
Data Table on South Korea - Market size and forecast 2025-2030 ($ billion)
Chart on South Korea - Year-over-year growth 2025-2030 (%)
Data Table on South Korea - Year-over-year growth 2025-2030 (%)

12.5.5 Australia - Market size and forecast 2025-2030

Chart on Australia - Market size and forecast 2025-2030 ($ billion)
Data Table on Australia - Market size and forecast 2025-2030 ($ billion)
Chart on Australia - Year-over-year growth 2025-2030 (%)
Data Table on Australia - Year-over-year growth 2025-2030 (%)

12.5.6 Indonesia - Market size and forecast 2025-2030

Chart on Indonesia - Market size and forecast 2025-2030 ($ billion)
Data Table on Indonesia - Market size and forecast 2025-2030 ($ billion)
Chart on Indonesia - Year-over-year growth 2025-2030 (%)
Data Table on Indonesia - Year-over-year growth 2025-2030 (%)

12.6 Middle East and Africa - Market size and forecast 2025-2030

Chart on Middle East and Africa - Market size and forecast 2025-2030 ($ billion)
Data Table on Middle East and Africa - Market size and forecast 2025-2030 ($ billion)
Chart on Middle East and Africa - Year-over-year growth 2025-2030 (%)
Data Table on Middle East and Africa - Year-over-year growth 2025-2030 (%)
Chart on Regional Comparison - Middle East and Africa
Data Table on Regional Comparison - Middle East and Africa

12.6.1 UAE - Market size and forecast 2025-2030

Chart on UAE - Market size and forecast 2025-2030 ($ billion)
Data Table on UAE - Market size and forecast 2025-2030 ($ billion)
Chart on UAE - Year-over-year growth 2025-2030 (%)
Data Table on UAE - Year-over-year growth 2025-2030 (%)

12.6.2 Saudi Arabia - Market size and forecast 2025-2030

Chart on Saudi Arabia - Market size and forecast 2025-2030 ($ billion)
Data Table on Saudi Arabia - Market size and forecast 2025-2030 ($ billion)
Chart on Saudi Arabia - Year-over-year growth 2025-2030 (%)
Data Table on Saudi Arabia - Year-over-year growth 2025-2030 (%)

12.6.3 South Africa - Market size and forecast 2025-2030

Chart on South Africa - Market size and forecast 2025-2030 ($ billion)
Data Table on South Africa - Market size and forecast 2025-2030 ($ billion)
Chart on South Africa - Year-over-year growth 2025-2030 (%)
Data Table on South Africa - Year-over-year growth 2025-2030 (%)

12.6.4 Turkey - Market size and forecast 2025-2030

Chart on Turkey - Market size and forecast 2025-2030 ($ billion)
Data Table on Turkey - Market size and forecast 2025-2030 ($ billion)
Chart on Turkey - Year-over-year growth 2025-2030 (%)
Data Table on Turkey - Year-over-year growth 2025-2030 (%)

12.6.5 Israel - Market size and forecast 2025-2030

Chart on Israel - Market size and forecast 2025-2030 ($ billion)
Data Table on Israel - Market size and forecast 2025-2030 ($ billion)
Chart on Israel - Year-over-year growth 2025-2030 (%)
Data Table on Israel - Year-over-year growth 2025-2030 (%)

12.7 South America - Market size and forecast 2025-2030

Chart on South America - Market size and forecast 2025-2030 ($ billion)
Data Table on South America - Market size and forecast 2025-2030 ($ billion)
Chart on South America - Year-over-year growth 2025-2030 (%)
Data Table on South America - Year-over-year growth 2025-2030 (%)
Chart on Regional Comparison - South America
Data Table on Regional Comparison - South America

12.7.1 Brazil - Market size and forecast 2025-2030

Chart on Brazil - Market size and forecast 2025-2030 ($ billion)
Data Table on Brazil - Market size and forecast 2025-2030 ($ billion)
Chart on Brazil - Year-over-year growth 2025-2030 (%)
Data Table on Brazil - Year-over-year growth 2025-2030 (%)

12.7.2 Argentina - Market size and forecast 2025-2030

Chart on Argentina - Market size and forecast 2025-2030 ($ billion)
Data Table on Argentina - Market size and forecast 2025-2030 ($ billion)
Chart on Argentina - Year-over-year growth 2025-2030 (%)
Data Table on Argentina - Year-over-year growth 2025-2030 (%)

12.7.3 Chile - Market size and forecast 2025-2030

Chart on Chile - Market size and forecast 2025-2030 ($ billion)
Data Table on Chile - Market size and forecast 2025-2030 ($ billion)
Chart on Chile - Year-over-year growth 2025-2030 (%)
Data Table on Chile - Year-over-year growth 2025-2030 (%)

12.8 Market opportunity by geography

Market opportunity by geography ($ billion)
Data Tables on Market opportunity by geography ($ billion)

13. Drivers, Challenges, and Opportunity

13.1 Market drivers

Technological integration and AI as operational co-pilot
Personalization and enhanced attendee value proposition
Structured compliance and institutionalization of sustainability

13.2 Market challenges

Persistent operational inflation and escalating infrastructure costs
Digital fatigue and struggle for attendee attention
Regulatory complexity and stringent environmental compliance

13.3 Impact of drivers and challenges

Impact of drivers and challenges in 2025 and 2030

13.4 Market opportunities

Integration of agentic AI and unified event technology stacks
Strategic evolution toward regenerative events and circular sustainability
Rise of micro experiences and personalized phygital journeys

14. Competitive Landscape

14.1 Overview

14.2

Overview on criticality of inputs and factors of differentiation

14.3 Landscape disruption

Overview on factors of disruption

14.4 Industry risks

Impact of key risks on business

15. Competitive Analysis

15.1 Companies profiled

Companies covered

15.2 Company ranking index

15.3 Market positioning of companies

Matrix on companies position and classification

15.4 BCD Meetings and Events

BCD Meetings and Events - Overview
BCD Meetings and Events - Product / Service
BCD Meetings and Events - Key offerings
SWOT

15.5 Clarion Events Ltd.

Clarion Events Ltd. - Overview
Clarion Events Ltd. - Product / Service
Clarion Events Ltd. - Key offerings
SWOT

15.6 Comexposium

Comexposium - Overview
Comexposium - Product / Service
Comexposium - Key offerings
SWOT

15.7 Deutsche Messe AG

Deutsche Messe AG - Overview
Deutsche Messe AG - Product / Service
Deutsche Messe AG - Key offerings
SWOT

15.8 Easyfairs

Easyfairs - Overview
Easyfairs - Product / Service
Easyfairs - Key offerings
SWOT

15.9 Emerald X LLC

Emerald X LLC - Overview
Emerald X LLC - Business segments
Emerald X LLC - Key offerings
Emerald X LLC - Segment focus
SWOT

15.10 Fira de Barcelona

Fira de Barcelona - Overview
Fira de Barcelona - Product / Service
Fira de Barcelona - Key offerings
SWOT

15.11 GL events Group

GL events Group - Overview
GL events Group - Product / Service
GL events Group - Key offerings
SWOT

15.12 Hyve Group Ltd.

Hyve Group Ltd. - Overview
Hyve Group Ltd. - Product / Service
Hyve Group Ltd. - Key offerings
SWOT

15.13 Informa PLC

Informa PLC - Overview
Informa PLC - Business segments
Informa PLC - Key offerings
Informa PLC - Segment focus
SWOT

15.14 Koelnmesse GmbH

Koelnmesse GmbH - Overview
Koelnmesse GmbH - Product / Service
Koelnmesse GmbH - Key offerings
SWOT

15.15 MCH Group AG

MCH Group AG - Overview
MCH Group AG - Product / Service
MCH Group AG - Key offerings
SWOT

15.16 Messe Dusseldorf GmbH

Messe Dusseldorf GmbH - Overview
Messe Dusseldorf GmbH - Product / Service
Messe Dusseldorf GmbH - Key offerings
SWOT

15.17 Messe Munchen GmbH

Messe Munchen GmbH - Overview
Messe Munchen GmbH - Product / Service
Messe Munchen GmbH - Key offerings
SWOT

15.18 Reed Exhibitions Ltd.

Reed Exhibitions Ltd. - Overview
Reed Exhibitions Ltd. - Product / Service
Reed Exhibitions Ltd. - Key offerings
SWOT

16. Appendix

16.1 Scope of the report

Market definition
Objectives
Notes and caveats

16.2 Inclusions and exclusions checklist

Inclusions checklist
Exclusions checklist

16.3 Currency conversion rates for US$

16.4 Research methodology

16.5 Data procurement

Information sources

16.6 Data validation

16.7 Validation techniques employed for market sizing

16.8 Data synthesis

16.9 360 degree market analysis

16.10 List of abbreviations

Research Methodology

Technavio presents a detailed picture of the market by way of study, synthesis, and summation of data from multiple sources. The analysts have presented the various facets of the market with a particular focus on identifying the key industry influencers. The data thus presented is comprehensive, reliable, and the result of extensive research, both primary and secondary.

INFORMATION SOURCES

Primary sources

  • Manufacturers and suppliers
  • Channel partners
  • Industry experts
  • Strategic decision makers

Secondary sources

  • Industry journals and periodicals
  • Government data
  • Financial reports of key industry players
  • Historical data
  • Press releases

DATA ANALYSIS

Data Synthesis

  • Collation of data
  • Estimation of key figures
  • Analysis of derived insights

Data Validation

  • Triangulation with data models
  • Reference against proprietary databases
  • Corroboration with industry experts

REPORT WRITING

Qualitative

  • Market drivers
  • Market challenges
  • Market trends
  • Five forces analysis

Quantitative

  • Market size and forecast
  • Market segmentation
  • Geographical insights
  • Competitive landscape

Interested in this report?

Get your sample now to see our research methodology and insights!

Download Now

Frequently Asked Questions

Events Industry market growth will increase by USD 1122.0 billion during 2026-2030.

The Events Industry market is expected to grow at a CAGR of 12.9% during 2026-2030.

Events Industry market is segmented by Type (Corporate events and seminar, Music concert, Festival, Sports, Others) Source (Sponsorship, Ticket sale, Others) Age group (21 to 40 years, Above 40 years, Below 20 years)

BCD Meetings and Events, Clarion Events Ltd., Comexposium, Cvent Inc, Deutsche Messe AG, Easyfairs, Emerald X LLC, Fira de Barcelona, George P. Johnson, GL events Group, Hyve Group Ltd., Informa PLC, Koelnmesse GmbH, MCH Group AG, Messe Dusseldorf GmbH, Messe Frankfurt GmbH, Messe Munchen GmbH, Reed Exhibitions Ltd., The Freeman Co. are a few of the key vendors in the Events Industry market.

Europe will register the highest growth rate of 36.2% among the other regions. Therefore, the Events Industry market in Europe is expected to garner significant business opportunities for the vendors during the forecast period.

Germany, UK, France, Spain, Italy, The Netherlands, US, Canada, Mexico, China, Japan, India, South Korea, Australia, Indonesia, UAE, Saudi Arabia, South Africa, Turkey, Israel, Brazil, Argentina, Chile

  • Technological integration and AI as operational co-pilot is the driving factor this market.

The Events Industry market vendors should focus on grabbing business opportunities from the Type segment as it accounted for the largest market share in the base year.
RIA - Research AI Assistant
Ask RIA