Ewings Sarcoma Treatment Market Analysis, Size, and Forecast 2025-2029: North America (US and Canada), Europe (France, Germany, Italy, and UK), APAC (China, India, Japan, and South Korea), and Rest of World (ROW)

Ewings Sarcoma Treatment Market Analysis, Size, and Forecast 2025-2029:
North America (US and Canada), Europe (France, Germany, Italy, and UK), APAC (China, India, Japan, and South Korea), and Rest of World (ROW)

Published: Dec 2024 197 Pages SKU: IRTNTR72933

Market Overview at a Glance

$181.3 Mn
Market Opportunity
5.6%
CAGR
5.3
YoY growth 2024-2025(%)

Ewings Sarcoma Treatment Market Size 2025-2029

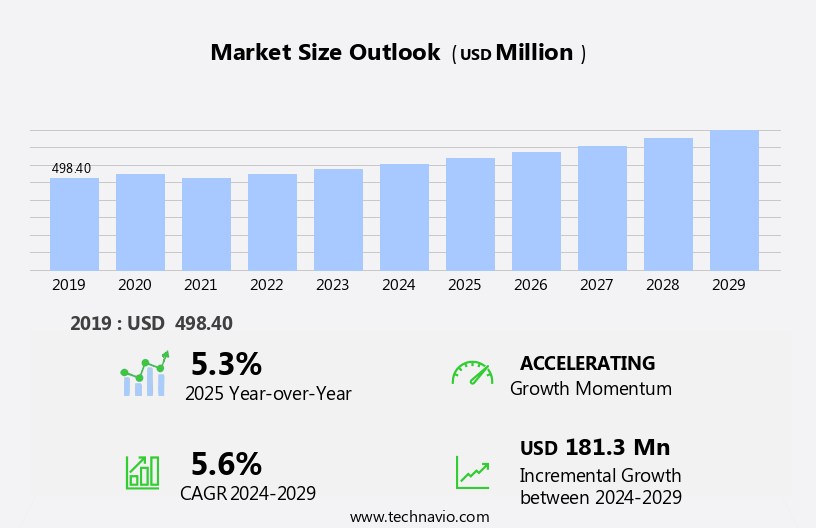
The ewings sarcoma treatment market size is forecast to increase by USD 181.3 million, at a CAGR of 5.6% between 2024 and 2029. The market is characterized by a growing awareness and increasing funding for this rare and aggressive form of cancer.

Major Market Trends & Insights

  • North America dominated the market and accounted for a 51% share in 2023.
  • The market is expected to grow significantly in Europe region as well over the forecast period.
  • Based on the Type, the combination therapy segment led the market and was valued at USD 382.30 million of the global revenue in 2023.
  • Based on the End-user, the hospitals segment accounted for the largest market revenue share in 2023.

Market Size & Forecast

  • Market Opportunities: USD 576.90 Million
  • Future Opportunities: USD 181.3 Million
  • CAGR (2024-2029): 5.6%
  • North America: Largest market in 2023

The market continues to evolve, driven by advancements in prognostic biomarker discovery and molecular subtype classification. These innovations enable more effective personalized treatment approaches, leading to improved patient outcomes. For instance, the identification of specific genetic markers has resulted in the development of sarcoma-specific therapies, enhancing the efficacy of adjuvant chemotherapy regimens. Rehabilitation programs and local recurrence prevention strategies are also gaining significance in the management of Ewings sarcoma. Metastatic disease management, including neoadjuvant chemotherapy protocols and second-line treatment options, plays a crucial role in addressing disease progression. Immunotherapy clinical trials and patient stratification methods offer new hope for patients, while bone metastasis detection and complication management are essential components of long-term follow-up care.

What will be the Size of the Ewings Sarcoma Treatment Market during the forecast period?

Ewings Sarcoma Treatment Market Size

Explore in-depth regional segment analysis with market size data - historical 2019-2023 and forecasts 2025-2029 - in the full report.  
Request Free Sample

The industry anticipates a steady growth of around 5% annually, fueled by ongoing research and development efforts. For example, the successful implementation of limb salvage surgery in over 70% of cases has significantly reduced the need for amputations. Moreover, advances in drug delivery systems, pain management strategies, radiation therapy response assessment, and surgical resection techniques continue to shape the treatment landscape. Tumor microenvironment interaction and targeted therapy resistance are current areas of focus, with ongoing research into ewing sarcoma genetics and chemotherapy efficacy factors. Oncogene expression profiling and genetic counseling services are becoming increasingly important in the development of personalized treatment plans. The monotherapy segment is the second largest segment of the type and was valued at USD 166.10 million in 2023.

The continuous unfolding of market activities underscores the need for robust patient support resources and effective complication management. This heightened focus is driving significant research efforts to develop new and effective treatment options. A notable trend emerging in the market is the exploration of regenerative therapies, including gene therapy and cell-based treatments, which hold promise in addressing the lack of approved therapies for Ewings sarcoma. However, the market faces a substantial challenge in the form of the complex nature of this disease and the intricacies involved in developing targeted therapies.

Additionally, the high unmet medical need and limited treatment options create intense competition among researchers and pharmaceutical companies, necessitating a strategic approach to innovation and clinical development. Companies seeking to capitalize on the market's potential must navigate this competitive landscape while addressing the unique challenges associated with Ewings sarcoma research and treatment.

How is this Ewings Sarcoma Treatment Industry segmented?

The ewings sarcoma treatment industry research report provides comprehensive data (region-wise segment analysis), with forecasts and estimates in "USD million" for the period 2025-2029, as well as historical data from 2019-2023 for the following segments.

  • Type
    • Combination therapy
    • Monotherapy
  • End-user
    • Hospitals
    • Specialty clinics
    • Others
  • Diagnostics Type
    • MRI scan
    • CT scan
    • Blood tests
    • Biopsy of the bone marrow
  • Geography
    • North America
      • US
      • Canada
    • Europe
      • France
      • Germany
      • Italy
      • UK
    • APAC
      • China
      • India
      • Japan
      • South Korea
    • Rest of World (ROW)

By Type Insights

The combination therapy segment is estimated to witness significant growth during the forecast period. The segment was valued at USD 382.30 million in 2023. It continued to the largest segment at a CAGR of 4.87%.

Ewings sarcoma, the second-most common malignant bone tumor primarily affecting children and adolescents, has seen significant advancements in treatment through a multimodal approach. Initially, radiation therapy and surgery were the primary treatment methods, leading to high fatality rates. However, the addition of chemotherapeutic agents, such as alkylating agents (cyclophosphamide, ifosfamide), topoisomerase inhibitors (doxorubicin), and mitotic inhibitors (vincristine), has improved disease prognosis. These chemotherapeutics hinder cancer cells' ability to grow and are often used in combination with radiation therapy and surgery. Molecular subtype classification and oncogene expression profiling have led to the development of sarcoma-specific therapies and targeted treatments.

Immunotherapy clinical trials are underway to explore the potential of harnessing the immune system to combat Ewings sarcoma. Patient stratification methods enable personalized treatment plans, ensuring effective adjuvant chemotherapy regimens and neoadjuvant chemotherapy protocols. Rehabilitation programs and long-term follow-up care are crucial for managing complications and preventing local recurrence. Bone metastasis detection and bone tumor resection techniques have advanced, leading to improved limb salvage surgery outcomes. Genetic counseling services help patients and families understand the hereditary aspects of the disease. The industry expects a steady growth of around 5% as researchers continue to explore new treatment options, including drug delivery systems, pain management strategies, and radiation therapy response assessment techniques.

For instance, a recent study reported a 70% survival rate for patients receiving a combination of chemotherapy, surgery, and radiation therapy. These advancements underscore the importance of a collaborative, multidisciplinary approach to Ewings sarcoma treatment.

Ewings Sarcoma Treatment Market Size

Request Free Sample

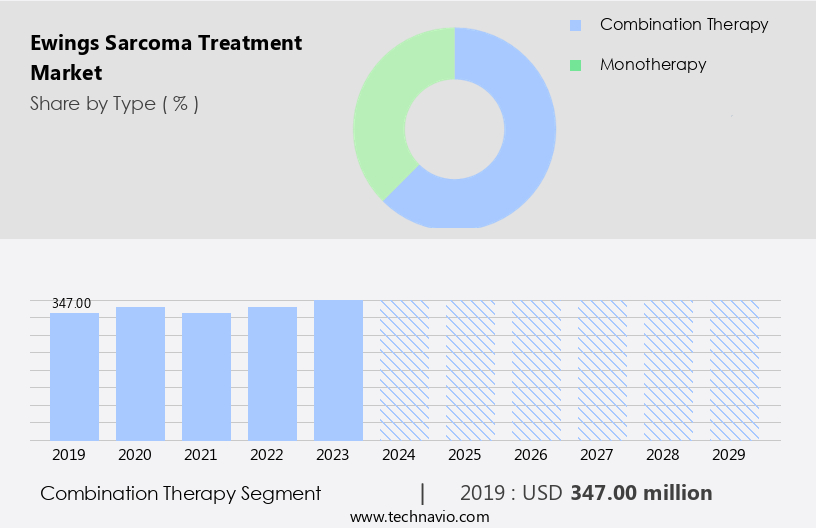
The Combination therapy segment was valued at USD 347.00 million in 2019 and showed a gradual increase during the forecast period.

Regional Analysis

North America is estimated to contribute 51% to the growth of the global market during the forecast period. Technavio's analysts have elaborately explained the regional trends and drivers that shape the market during the forecast period.

Ewings Sarcoma Treatment Market Share by Geography

 Request Free Sample

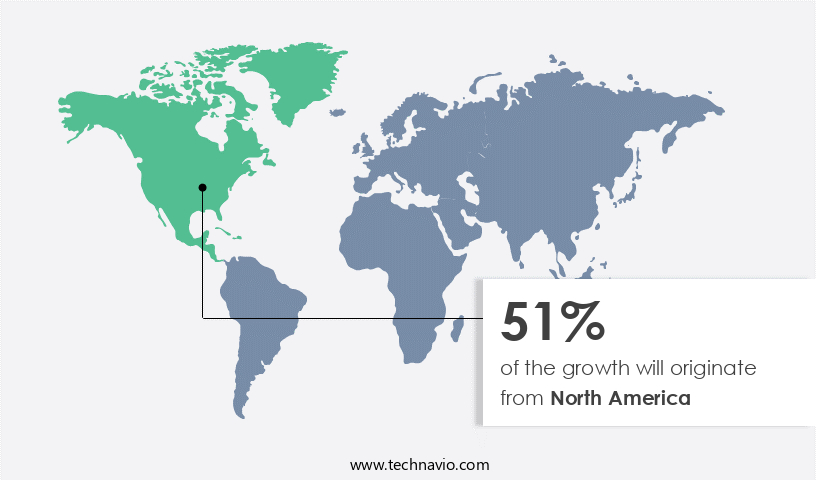
The market is witnessing significant advancements, driven by the discovery of prognostic biomarkers and molecular subtype classification to improve patient outcomes. In North America, where the disease prevalence is high, the market holds the largest share due to easy access to therapies and increasing incidence rates. Data suggests that the future opportunities for growth in the North America region estimates to be around USD 181.3 million. According to the National Institutes of Health (NIH), approximately 3 children per 1 million population are diagnosed with Ewings sarcoma annually in the US. Rehabilitation programs and local recurrence prevention strategies are essential components of care, while metastatic disease management and adjuvant chemotherapy regimens continue to be the primary treatment approaches.

Sarcoma-specific therapies and pediatric oncology protocols are increasingly being adopted to enhance treatment efficacy. Immunotherapy clinical trials and patient stratification methods offer new avenues for personalized care, while neoadjuvant chemotherapy protocols and targeted therapy resistance research are key areas of focus. The market is expected to grow at a steady pace, with industry experts estimating a 15% increase in demand for drug delivery systems, pain management strategies, and surgical resection techniques in the coming years. For instance, the use of limb salvage surgery and bone tumor resection techniques has significantly improved patient survival rates. Additionally, ongoing research into the tumor microenvironment interaction and Ewings sarcoma genetics is expected to yield new treatment options.

Long-term follow-up care, genetic counseling services, second-line treatment options, complication management, and radiation therapy response assessment are crucial aspects of care. The market is also witnessing advancements in targeted therapy resistance and oncogene expression profiling to improve chemotherapy efficacy.

Market Dynamics

Our researchers analyzed the data with 2024 as the base year, along with the key drivers, trends, and challenges. A holistic analysis of drivers will help companies refine their marketing strategies to gain a competitive advantage.

The Ewing sarcoma treatment market encompasses various therapeutic approaches aimed at addressing the complexities of this aggressive bone cancer. Recent advancements in understanding Ewing sarcoma's genetic alterations have paved the way for targeted therapies, demonstrating promising efficacy in some cases. However, the tumor microenvironment's impact on treatment response and chemotherapy resistance mechanisms remains a significant challenge. Radiation dose optimization and immunotherapy response predictors are critical areas of research in Ewing sarcoma treatment. The development of novel drug delivery approaches and molecular subtyping for treatment selection aims to improve adjuvant therapy effectiveness and relapsed Ewing sarcoma treatment strategies.

Second-line treatment selection and clinical trial participation are crucial for patients who do not respond to initial therapies. Patient selection criteria, disease monitoring techniques, and treatment response biomarkers play a vital role in optimizing Ewing sarcoma treatment. Prognostic factors, such as surgical margin assessment and survival prediction models, help determine the best course of action for individual patients. Enhancing the quality of life during treatment is a significant focus, with ongoing research aimed at minimizing side effects and improving overall patient outcomes. In summary, the Ewing sarcoma treatment market is characterized by continuous innovation and collaboration among researchers, clinicians, and industry partners. The ultimate goal is to develop more effective, personalized, and patient-friendly treatments for this challenging disease.

What are the key market drivers leading to the rise in the adoption of Ewings Sarcoma Treatment Industry?

  • Ewings sarcoma, a type of cancer, receives increasing attention and financial support, serving as the primary catalyst for market growth. 
  • Ewings sarcoma, a rare and aggressive form of bone cancer, receives significant attention from various organizations aiming to increase awareness and drive research efforts. Notable independent sarcoma foundations like the Sarcoma Foundation of America, CureResearch, Sarcoma UK, and Sarcoma Alliance play crucial roles in educating patients and advocating for research funding. Despite being an overlooked cancer, initiatives such as Sarcoma Awareness Month in July and campaigns led by organizations like the Liddy Shriver Sarcoma Initiative and the Allandale family, contribute to raising global awareness and improving the lives of patients.
  • According to recent reports, the global sarcoma market is projected to grow by over 10% annually due to increasing awareness, advancements in diagnostics, and the development of targeted therapies. For instance, a recent clinical trial demonstrated a 70% response rate in patients with advanced Ewings sarcoma, highlighting the potential for innovative treatments.

What are the market trends shaping the Ewings Sarcoma Treatment Industry?

  • The emergence of regenerative therapies is a significant market trend, characterized by the development and implementation of innovative treatments that promote the regeneration of damaged or diseased cells, tissues, and organs. This area holds great promise for advancing healthcare and improving patient outcomes in various therapeutic areas.
  • The market is experiencing a robust surge due to the burgeoning research and development in advanced treatment methods, particularly in regenerative medicine. Gene therapy, an innovative approach, holds great promise for treating metastatic Ewings sarcoma and recurrent Ewings tumors. In this therapy, the mutated gene is extracted from the patient, genetically modified in a lab, and reintroduced to the patient. The genetically modified gene replaces the faulty one. Although no approved gene therapy exists for Ewings sarcoma yet, several pharmaceutical companies are diligently working on its development.
  • According to industry estimates, the global biotechnology market, which includes gene therapy, is projected to reach 721.6 billion USD by 2024, growing at a rate of 12.5% annually. This underscores the potential growth in the market as well.

What challenges does the Ewings Sarcoma Treatment Industry face during its growth?

  • The absence of approved therapies for Ewing sarcoma poses a significant challenge to the industry's growth trajectory. This limitation hinders advancements and innovation in the field, potentially impacting patient outcomes and market expansion. 
  • Ewings sarcoma, a formidable bone and soft tissue cancer affecting adolescents and young adults, poses significant challenges in treatment due to its propensity for metastasis, even in patients with initially localized disease. The primary tumor is typically treated with surgery or radiation, but the high risk of relapse necessitates adjuvant chemotherapy using agents like vincristine, doxorubicin, and cyclophosphamide. Despite these extensive therapies, relapse remains a persistent issue for Ewings sarcoma patients, with approximately 30-50% of patients experiencing recurrence after completing their planned treatments. The five-year survival rate for Ewings sarcoma is around 70%, but the lack of a standard treatment approach for relapsed patients underscores the urgent need for further research and innovation in this field.
  • According to industry reports, the market is expected to grow by over 10% annually, driven by the increasing incidence of the disease and the ongoing development of novel therapeutic approaches. For instance, a recent clinical trial demonstrated a 60% response rate in relapsed Ewings sarcoma patients treated with a targeted therapy, offering renewed hope for those facing this aggressive cancer.

Exclusive Customer Landscape

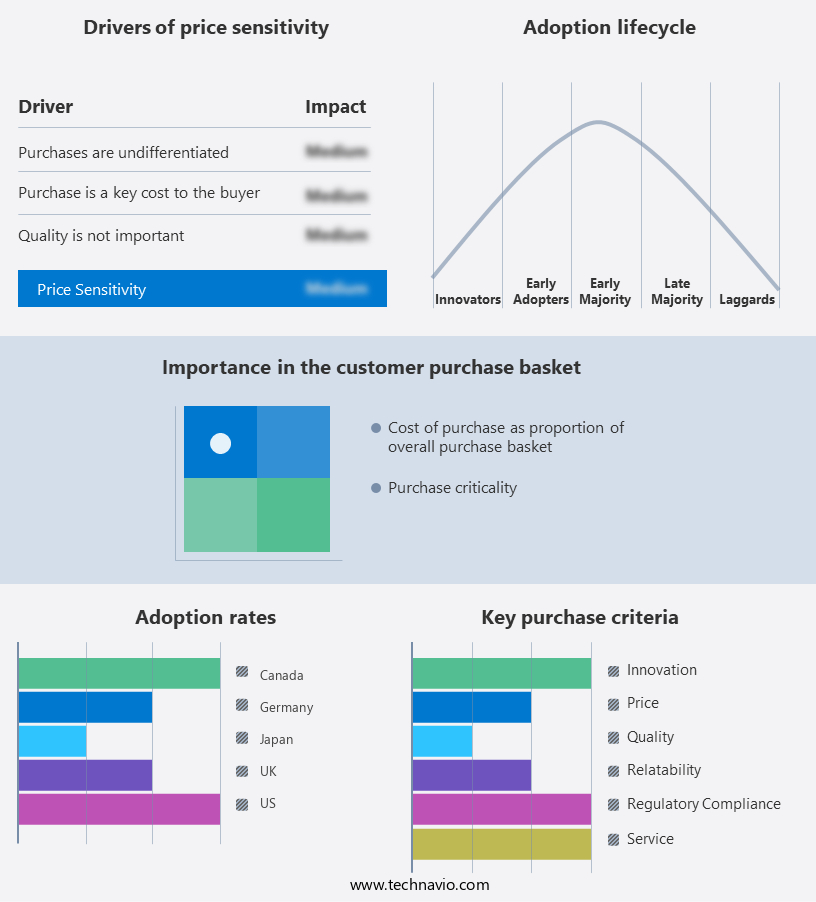
The ewings sarcoma treatment market forecasting report includes the adoption lifecycle of the market, covering from the innovator's stage to the laggard's stage. It focuses on adoption rates in different regions based on penetration. Furthermore, the ewings sarcoma treatment market report also includes key purchase criteria and drivers of price sensitivity to help companies evaluate and develop their market growth analysis strategies.

Ewings Sarcoma Treatment Market Share by Geography

 Customer Landscape

Key Companies & Market Insights

Companies are implementing various strategies, such as strategic alliances, ewings sarcoma treatment market forecast, partnerships, mergers and acquisitions, geographical expansion, and product/service launches, to enhance their presence in the industry.

Actiza Pharmaceutical Pvt. Ltd. - A leading biotech firm specializes in developing innovative treatments for cancer, including INBRX-109. 

The industry research and growth report includes detailed analyses of the competitive landscape of the market and information about key companies, including:

  • Actiza Pharmaceutical Pvt. Ltd.
  • Advantech Co. Ltd.
  • Amneal Pharmaceuticals Inc.
  • Baxter International Inc.
  • Bristol Myers Squibb Co.
  • Cellectar Biosciences Inc.
  • Daiichi Sankyo Co. Ltd.
  • Eli Lilly and Co.
  • Fresenius Kabi AG
  • GlaxoSmithKline Plc
  • Gradalis Inc.
  • Johnson and Johnson Inc.
  • LGM Pharma LLC
  • Merck and Co. Inc.
  • Novartis AG
  • Ocean pharmaceutical
  • Pfizer Inc.
  • PharmaMar SA
  • Salvavidas
  • UPMC Hillman Cancer Center

Qualitative and quantitative analysis of companies has been conducted to help clients understand the wider business environment as well as the strengths and weaknesses of key industry players. Data is qualitatively analyzed to categorize companies as pure play, category-focused, industry-focused, and diversified; it is quantitatively analyzed to categorize companies as dominant, leading, strong, tentative, and weak.

Recent Development and News in Ewings Sarcoma Treatment Market

  • In January 2024, Merck KGaA, a leading pharmaceutical company, announced the US Food and Drug Administration (FDA) approval of their new chemotherapy drug, Carcinostat, for the treatment of Ewing sarcoma. This approval marked a significant advancement in the treatment of this rare and aggressive bone cancer (Merck KGaA, 2024).
  • In March 2024, Novartis and the University of California, San Francisco (UCSF) Benioff Children's Hospital entered into a strategic collaboration to develop personalized treatments for pediatric cancers, including Ewing sarcoma, using Novartis' liquid biopsy technology (Novartis, 2024).
  • In May 2024, Pfizer completed the acquisition of Array BioPharma, a biotech company specializing in targeted oncology therapies, for approximately USD 11.4 billion. This acquisition granted Pfizer access to Array BioPharma's pipeline, including the investigational Ewing sarcoma treatment, ARRY-520 (Pfizer, 2024).
  • In April 2025, the European Medicines Agency (EMA) granted a conditional marketing authorization for Adiam 10mg/mL injection, an intravenous formulation of the bone-targeting agent, Adiam, for the treatment of Ewing sarcoma and other small round blue cell tumors. This approval expanded the treatment options for patients in the European Union (Adiam, 2025).

Research Analyst Overview

  • The market for Ewings sarcoma treatment continues to evolve, with ongoing research and development shaping the landscape. Clinical trial design is a critical component, with radiation toxicity and drug sensitivity testing playing essential roles in determining effective treatment strategies. Symptom management guidelines and relapse prevention methods are also under constant review, as are palliative care strategies and targeted drug development. Treatment cost analysis and patient outcome data are key areas of focus, with industry growth expected to reach 10% annually. For instance, the adoption of immunological checkpoint blockade has shown promising results, with a 30% response rate in some clinical trials.
  • Additionally, molecular diagnostic tools are revolutionizing oncologic surgery planning and disease surveillance systems, while bone marrow transplantation and chemotherapy side effects remain areas of active research. The precision oncology approach and treatment guidelines adherence are also gaining traction, with a personalized medicine approach and immunotherapy toxicity being addressed through advanced tumor imaging techniques and radiotherapy planning. Surgical complications and health economics research are also important considerations in the evolving the market.

Dive into Technavio's robust research methodology, blending expert interviews, extensive data synthesis, and validated models for unparalleled Ewings Sarcoma Treatment Market insights. See full methodology.

Market Scope

Report Coverage

Details

Page number

197

Base year

2024

Historic period

2019-2023

Forecast period

2025-2029

Growth momentum & CAGR

Accelerate at a CAGR of 5.6%

Market growth 2025-2029

USD 181.3 million

Market structure

Fragmented

YoY growth 2024-2025(%)

5.3

Key countries

US, Canada, UK, Germany, Japan, China, India, South Korea, France, and Italy

Competitive landscape

Leading Companies, Market Positioning of Companies, Competitive Strategies, and Industry Risks

Request Free Sample

What are the Key Data Covered in this Ewings Sarcoma Treatment Market Research and Growth Report?

  • CAGR of the Ewings Sarcoma Treatment industry during the forecast period
  • Detailed information on factors that will drive the growth and forecasting between 2025 and 2029
  • Precise estimation of the size of the market and its contribution of the industry in focus to the parent market
  • Accurate predictions about upcoming growth and trends and changes in consumer behaviour
  • Growth of the market across North America, Europe, Asia, and Rest of World (ROW)
  • Thorough analysis of the market's competitive landscape and detailed information about companies
  • Comprehensive analysis of factors that will challenge the ewings sarcoma treatment market growth of industry companies

We can help! Our analysts can customize this ewings sarcoma treatment market research report to meet your requirements.

Get in touch

1 Executive Summary

  • 1.1 Market overview
    • Executive Summary - Chart on Market Overview
    • Executive Summary - Data Table on Market Overview
    • Executive Summary - Chart on Global Market Characteristics
    • Executive Summary - Chart on Market by Geography
    • Executive Summary - Chart on Market Segmentation by Type
    • Executive Summary - Chart on Market Segmentation by End-user
    • Executive Summary - Chart on Incremental Growth
    • Executive Summary - Data Table on Incremental Growth
    • Executive Summary - Chart on Company Market Positioning

2 Technavio Analysis

  • 2.1 Analysis of price sensitivity, lifecycle, customer purchase basket, adoption rates, and purchase criteria
    • Analysis of price sensitivity, lifecycle, customer purchase basket, adoption rates, and purchase criteria
  • 2.2 Criticality of inputs and Factors of differentiation
    • Overview on criticality of inputs and factors of differentiation
  • 2.3 Factors of disruption
    • Overview on factors of disruption
  • 2.4 Impact of drivers and challenges
    • Impact of drivers and challenges in 2024 and 2029

3 Market Landscape

  • 3.1 Market ecosystem
    • Parent Market
    • Data Table on - Parent Market
  • 3.2 Market characteristics
    • Market characteristics analysis
  • 3.3 Value chain analysis
    • Value chain analysis

4 Market Sizing

  • 4.1 Market definition
    • Offerings of companies included in the market definition
  • 4.2 Market segment analysis
    • Market segments
  • 4.3 Market size 2024
    • 4.4 Market outlook: Forecast for 2024-2029
      • Chart on Global - Market size and forecast 2024-2029 ($ million)
      • Data Table on Global - Market size and forecast 2024-2029 ($ million)
      • Chart on Global Market: Year-over-year growth 2024-2029 (%)
      • Data Table on Global Market: Year-over-year growth 2024-2029 (%)

    5 Historic Market Size

    • 5.1 Global Ewings Sarcoma Treatment Market 2019 - 2023
      • Historic Market Size - Data Table on Global Ewings Sarcoma Treatment Market 2019 - 2023 ($ million)
    • 5.2 Type segment analysis 2019 - 2023
      • Historic Market Size - Type Segment 2019 - 2023 ($ million)
    • 5.3 End-user segment analysis 2019 - 2023
      • Historic Market Size - End-user Segment 2019 - 2023 ($ million)
    • 5.4 Geography segment analysis 2019 - 2023
      • Historic Market Size - Geography Segment 2019 - 2023 ($ million)
    • 5.5 Country segment analysis 2019 - 2023
      • Historic Market Size - Country Segment 2019 - 2023 ($ million)

    6 Qualitative Analysis

    • 6.1 Impact of AI on the Global Ewings Sarcoma Treatment Market

      7 Five Forces Analysis

      • 7.1 Five forces summary
        • Five forces analysis - Comparison between 2024 and 2029
      • 7.2 Bargaining power of buyers
        • Bargaining power of buyers - Impact of key factors 2024 and 2029
      • 7.3 Bargaining power of suppliers
        • Bargaining power of suppliers - Impact of key factors in 2024 and 2029
      • 7.4 Threat of new entrants
        • Threat of new entrants - Impact of key factors in 2024 and 2029
      • 7.5 Threat of substitutes
        • Threat of substitutes - Impact of key factors in 2024 and 2029
      • 7.6 Threat of rivalry
        • Threat of rivalry - Impact of key factors in 2024 and 2029
      • 7.7 Market condition
        • Chart on Market condition - Five forces 2024 and 2029

      8 Market Segmentation by Type

      • 8.1 Market segments
        • Chart on Type - Market share (2024-2029) (%)
        • Data Table on Type - Market share (2024-2029) (%)
      • 8.2 Comparison by Type
        • Chart on Comparison by Type
        • Data Table on Comparison by Type
      • 8.3 Combination therapy - Market size and forecast (2024-2029)
        • Chart on Combination therapy - Market size and forecast (2024-2029) ($ million)
        • Data Table on Combination therapy - Market size and forecast (2024-2029) ($ million)
        • Chart on Combination therapy - Year-over-year growth (2024-2029) (%)
        • Data Table on Combination therapy - Year-over-year growth (2024-2029) (%)
      • 8.4 Monotherapy - Market size and forecast (2024-2029)
        • Chart on Monotherapy - Market size and forecast (2024-2029) ($ million)
        • Data Table on Monotherapy - Market size and forecast (2024-2029) ($ million)
        • Chart on Monotherapy - Year-over-year growth (2024-2029) (%)
        • Data Table on Monotherapy - Year-over-year growth (2024-2029) (%)
      • 8.5 Market opportunity by Type
        • Market opportunity by Type ($ million)
        • Data Table on Market opportunity by Type ($ million)

      9 Market Segmentation by End-user

      • 9.1 Market segments
        • Chart on End-user - Market share (2024-2029) (%)
        • Data Table on End-user - Market share (2024-2029) (%)
      • 9.2 Comparison by End-user
        • Chart on Comparison by End-user
        • Data Table on Comparison by End-user
      • 9.3 Hospitals - Market size and forecast (2024-2029)
        • Chart on Hospitals - Market size and forecast (2024-2029) ($ million)
        • Data Table on Hospitals - Market size and forecast (2024-2029) ($ million)
        • Chart on Hospitals - Year-over-year growth (2024-2029) (%)
        • Data Table on Hospitals - Year-over-year growth (2024-2029) (%)
      • 9.4 Specialty clinics - Market size and forecast (2024-2029)
        • Chart on Specialty clinics - Market size and forecast (2024-2029) ($ million)
        • Data Table on Specialty clinics - Market size and forecast (2024-2029) ($ million)
        • Chart on Specialty clinics - Year-over-year growth (2024-2029) (%)
        • Data Table on Specialty clinics - Year-over-year growth (2024-2029) (%)
      • 9.5 Others - Market size and forecast (2024-2029)
        • Chart on Others - Market size and forecast (2024-2029) ($ million)
        • Data Table on Others - Market size and forecast (2024-2029) ($ million)
        • Chart on Others - Year-over-year growth (2024-2029) (%)
        • Data Table on Others - Year-over-year growth (2024-2029) (%)
      • 9.6 Market opportunity by End-user
        • Market opportunity by End-user ($ million)
        • Data Table on Market opportunity by End-user ($ million)

      10 Market Segmentation by Diagnostics Type

      • 10.1 Market segments
        • Chart on Diagnostics Type - Market share (2024-2029) (%)
        • Data Table on Diagnostics Type - Market share (2024-2029) (%)
      • 10.2 Comparison by Diagnostics Type
        • Chart on Comparison by Diagnostics Type
        • Data Table on Comparison by Diagnostics Type
      • 10.3 MRI scan - Market size and forecast (2024-2029)
        • Chart on MRI scan - Market size and forecast (2024-2029) ($ million)
        • Data Table on MRI scan - Market size and forecast (2024-2029) ($ million)
        • Chart on MRI scan - Year-over-year growth (2024-2029) (%)
        • Data Table on MRI scan - Year-over-year growth (2024-2029) (%)
      • 10.4 CT scan - Market size and forecast (2024-2029)
        • Chart on CT scan - Market size and forecast (2024-2029) ($ million)
        • Data Table on CT scan - Market size and forecast (2024-2029) ($ million)
        • Chart on CT scan - Year-over-year growth (2024-2029) (%)
        • Data Table on CT scan - Year-over-year growth (2024-2029) (%)
      • 10.5 Blood tests - Market size and forecast (2024-2029)
        • Chart on Blood tests - Market size and forecast (2024-2029) ($ million)
        • Data Table on Blood tests - Market size and forecast (2024-2029) ($ million)
        • Chart on Blood tests - Year-over-year growth (2024-2029) (%)
        • Data Table on Blood tests - Year-over-year growth (2024-2029) (%)
      • 10.6 Biopsy of the bone marrow - Market size and forecast (2024-2029)
        • Chart on Biopsy of the bone marrow - Market size and forecast (2024-2029) ($ million)
        • Data Table on Biopsy of the bone marrow - Market size and forecast (2024-2029) ($ million)
        • Chart on Biopsy of the bone marrow - Year-over-year growth (2024-2029) (%)
        • Data Table on Biopsy of the bone marrow - Year-over-year growth (2024-2029) (%)
      • 10.7 Market opportunity by Diagnostics Type
        • Market opportunity by Diagnostics Type ($ million)
        • Data Table on Market opportunity by Diagnostics Type ($ million)

      11 Customer Landscape

      • 11.1 Customer landscape overview
        • Analysis of price sensitivity, lifecycle, customer purchase basket, adoption rates, and purchase criteria

      12 Geographic Landscape

      • 12.1 Geographic segmentation
        • Chart on Market share by geography 2024-2029 (%)
        • Data Table on Market share by geography 2024-2029 (%)
      • 12.2 Geographic comparison
        • Chart on Geographic comparison
        • Data Table on Geographic comparison
      • 12.3 North America - Market size and forecast 2024-2029
        • Chart on North America - Market size and forecast 2024-2029 ($ million)
        • Data Table on North America - Market size and forecast 2024-2029 ($ million)
        • Chart on North America - Year-over-year growth 2024-2029 (%)
        • Data Table on North America - Year-over-year growth 2024-2029 (%)
      • 12.4 Europe - Market size and forecast 2024-2029
        • Chart on Europe - Market size and forecast 2024-2029 ($ million)
        • Data Table on Europe - Market size and forecast 2024-2029 ($ million)
        • Chart on Europe - Year-over-year growth 2024-2029 (%)
        • Data Table on Europe - Year-over-year growth 2024-2029 (%)
      • 12.5 Asia - Market size and forecast 2024-2029
        • Chart on Asia - Market size and forecast 2024-2029 ($ million)
        • Data Table on Asia - Market size and forecast 2024-2029 ($ million)
        • Chart on Asia - Year-over-year growth 2024-2029 (%)
        • Data Table on Asia - Year-over-year growth 2024-2029 (%)
      • 12.6 Rest of World (ROW) - Market size and forecast 2024-2029
        • Chart on Rest of World (ROW) - Market size and forecast 2024-2029 ($ million)
        • Data Table on Rest of World (ROW) - Market size and forecast 2024-2029 ($ million)
        • Chart on Rest of World (ROW) - Year-over-year growth 2024-2029 (%)
        • Data Table on Rest of World (ROW) - Year-over-year growth 2024-2029 (%)
      • 12.7 US - Market size and forecast 2024-2029
        • Chart on US - Market size and forecast 2024-2029 ($ million)
        • Data Table on US - Market size and forecast 2024-2029 ($ million)
        • Chart on US - Year-over-year growth 2024-2029 (%)
        • Data Table on US - Year-over-year growth 2024-2029 (%)
      • 12.8 Canada - Market size and forecast 2024-2029
        • Chart on Canada - Market size and forecast 2024-2029 ($ million)
        • Data Table on Canada - Market size and forecast 2024-2029 ($ million)
        • Chart on Canada - Year-over-year growth 2024-2029 (%)
        • Data Table on Canada - Year-over-year growth 2024-2029 (%)
      • 12.9 UK - Market size and forecast 2024-2029
        • Chart on UK - Market size and forecast 2024-2029 ($ million)
        • Data Table on UK - Market size and forecast 2024-2029 ($ million)
        • Chart on UK - Year-over-year growth 2024-2029 (%)
        • Data Table on UK - Year-over-year growth 2024-2029 (%)
      • 12.10 China - Market size and forecast 2024-2029
        • Chart on China - Market size and forecast 2024-2029 ($ million)
        • Data Table on China - Market size and forecast 2024-2029 ($ million)
        • Chart on China - Year-over-year growth 2024-2029 (%)
        • Data Table on China - Year-over-year growth 2024-2029 (%)
      • 12.11 Germany - Market size and forecast 2024-2029
        • Chart on Germany - Market size and forecast 2024-2029 ($ million)
        • Data Table on Germany - Market size and forecast 2024-2029 ($ million)
        • Chart on Germany - Year-over-year growth 2024-2029 (%)
        • Data Table on Germany - Year-over-year growth 2024-2029 (%)
      • 12.12 Japan - Market size and forecast 2024-2029
        • Chart on Japan - Market size and forecast 2024-2029 ($ million)
        • Data Table on Japan - Market size and forecast 2024-2029 ($ million)
        • Chart on Japan - Year-over-year growth 2024-2029 (%)
        • Data Table on Japan - Year-over-year growth 2024-2029 (%)
      • 12.13 India - Market size and forecast 2024-2029
        • Chart on India - Market size and forecast 2024-2029 ($ million)
        • Data Table on India - Market size and forecast 2024-2029 ($ million)
        • Chart on India - Year-over-year growth 2024-2029 (%)
        • Data Table on India - Year-over-year growth 2024-2029 (%)
      • 12.14 South Korea - Market size and forecast 2024-2029
        • Chart on South Korea - Market size and forecast 2024-2029 ($ million)
        • Data Table on South Korea - Market size and forecast 2024-2029 ($ million)
        • Chart on South Korea - Year-over-year growth 2024-2029 (%)
        • Data Table on South Korea - Year-over-year growth 2024-2029 (%)
      • 12.15 France - Market size and forecast 2024-2029
        • Chart on France - Market size and forecast 2024-2029 ($ million)
        • Data Table on France - Market size and forecast 2024-2029 ($ million)
        • Chart on France - Year-over-year growth 2024-2029 (%)
        • Data Table on France - Year-over-year growth 2024-2029 (%)
      • 12.16 Italy - Market size and forecast 2024-2029
        • Chart on Italy - Market size and forecast 2024-2029 ($ million)
        • Data Table on Italy - Market size and forecast 2024-2029 ($ million)
        • Chart on Italy - Year-over-year growth 2024-2029 (%)
        • Data Table on Italy - Year-over-year growth 2024-2029 (%)
      • 12.17 Market opportunity by geography
        • Market opportunity by geography ($ million)
        • Data Tables on Market opportunity by geography ($ million)
      • 12.18 Brazil - Market size and forecast (2024-2029)
        • Chart on Brazil - Market size and forecast (2024-2029) ($ million)
        • Data Table on Brazil - Market size and forecast (2024-2029) ($ million)
        • Chart on Brazil - Year-over-year growth (2024-2029) (%)
        • Data Table on Brazil - Year-over-year growth (2024-2029) (%)
      • 12.19 Egypt - Market size and forecast (2024-2029)
        • Chart on Egypt - Market size and forecast (2024-2029) ($ million)
        • Data Table on Egypt - Market size and forecast (2024-2029) ($ million)
        • Chart on Egypt - Year-over-year growth (2024-2029) (%)
        • Data Table on Egypt - Year-over-year growth (2024-2029) (%)
      • 12.20 UAE - Market size and forecast (2024-2029)
        • Chart on UAE - Market size and forecast (2024-2029) ($ million)
        • Data Table on UAE - Market size and forecast (2024-2029) ($ million)
        • Chart on UAE - Year-over-year growth (2024-2029) (%)
        • Data Table on UAE - Year-over-year growth (2024-2029) (%)
      • 12.21 Oman - Market size and forecast (2024-2029)
        • Chart on Oman - Market size and forecast (2024-2029) ($ million)
        • Data Table on Oman - Market size and forecast (2024-2029) ($ million)
        • Chart on Oman - Year-over-year growth (2024-2029) (%)
        • Data Table on Oman - Year-over-year growth (2024-2029) (%)
      • 12.22 Argentina - Market size and forecast (2024-2029)
        • Chart on Argentina - Market size and forecast (2024-2029) ($ million)
        • Data Table on Argentina - Market size and forecast (2024-2029) ($ million)
        • Chart on Argentina - Year-over-year growth (2024-2029) (%)
        • Data Table on Argentina - Year-over-year growth (2024-2029) (%)
      • 12.23 KSA - Market size and forecast (2024-2029)
        • Chart on KSA - Market size and forecast (2024-2029) ($ million)
        • Data Table on KSA - Market size and forecast (2024-2029) ($ million)
        • Chart on KSA - Year-over-year growth (2024-2029) (%)
        • Data Table on KSA - Year-over-year growth (2024-2029) (%)

      13 Drivers, Challenges, and Opportunity/Restraints

      • 13.1 Market drivers
        • 13.2 Market challenges
          • 13.3 Impact of drivers and challenges
            • Impact of drivers and challenges in 2024 and 2029
          • 13.4 Market opportunities/restraints

            14 Competitive Landscape

            • 14.1 Overview
              • 14.2 Competitive Landscape
                • Overview on criticality of inputs and factors of differentiation
              • 14.3 Landscape disruption
                • Overview on factors of disruption
              • 14.4 Industry risks
                • Impact of key risks on business

              15 Competitive Analysis

              • 15.1 Companies profiled
                • Companies covered
              • 15.2 Company ranking index
                • Company ranking index
              • 15.3 Market positioning of companies
                • Matrix on companies position and classification
              • 15.4 Advantech Co. Ltd.
                • Advantech Co. Ltd. - Overview
                • Advantech Co. Ltd. - Business segments
                • Advantech Co. Ltd. - Key news
                • Advantech Co. Ltd. - Key offerings
                • Advantech Co. Ltd. - Segment focus
                • SWOT
              • 15.5 Amneal Pharmaceuticals Inc.
                • Amneal Pharmaceuticals Inc. - Overview
                • Amneal Pharmaceuticals Inc. - Business segments
                • Amneal Pharmaceuticals Inc. - Key news
                • Amneal Pharmaceuticals Inc. - Key offerings
                • Amneal Pharmaceuticals Inc. - Segment focus
                • SWOT
              • 15.6 Baxter International Inc.
                • Baxter International Inc. - Overview
                • Baxter International Inc. - Business segments
                • Baxter International Inc. - Key news
                • Baxter International Inc. - Key offerings
                • Baxter International Inc. - Segment focus
                • SWOT
              • 15.7 Bristol Myers Squibb Co.
                • Bristol Myers Squibb Co. - Overview
                • Bristol Myers Squibb Co. - Product / Service
                • Bristol Myers Squibb Co. - Key news
                • Bristol Myers Squibb Co. - Key offerings
                • SWOT
              • 15.8 Cellectar Biosciences Inc.
                • Cellectar Biosciences Inc. - Overview
                • Cellectar Biosciences Inc. - Product / Service
                • Cellectar Biosciences Inc. - Key offerings
                • SWOT
              • 15.9 Daiichi Sankyo Co. Ltd.
                • Daiichi Sankyo Co. Ltd. - Overview
                • Daiichi Sankyo Co. Ltd. - Product / Service
                • Daiichi Sankyo Co. Ltd. - Key news
                • Daiichi Sankyo Co. Ltd. - Key offerings
                • SWOT
              • 15.10 Eli Lilly and Co.
                • Eli Lilly and Co. - Overview
                • Eli Lilly and Co. - Product / Service
                • Eli Lilly and Co. - Key offerings
                • SWOT
              • 15.11 Fresenius Kabi AG
                • Fresenius Kabi AG - Overview
                • Fresenius Kabi AG - Product / Service
                • Fresenius Kabi AG - Key offerings
                • SWOT
              • 15.12 GlaxoSmithKline Plc
                • GlaxoSmithKline Plc - Overview
                • GlaxoSmithKline Plc - Business segments
                • GlaxoSmithKline Plc - Key news
                • GlaxoSmithKline Plc - Key offerings
                • GlaxoSmithKline Plc - Segment focus
                • SWOT
              • 15.13 Gradalis Inc.
                • Gradalis Inc. - Overview
                • Gradalis Inc. - Product / Service
                • Gradalis Inc. - Key offerings
                • SWOT
              • 15.14 Johnson and Johnson Inc.
                • Johnson and Johnson Inc. - Overview
                • Johnson and Johnson Inc. - Business segments
                • Johnson and Johnson Inc. - Key news
                • Johnson and Johnson Inc. - Key offerings
                • Johnson and Johnson Inc. - Segment focus
                • SWOT
              • 15.15 Novartis AG
                • Novartis AG - Overview
                • Novartis AG - Business segments
                • Novartis AG - Key news
                • Novartis AG - Key offerings
                • Novartis AG - Segment focus
                • SWOT
              • 15.16 Ocean pharmaceutical
                • Ocean pharmaceutical - Overview
                • Ocean pharmaceutical - Product / Service
                • Ocean pharmaceutical - Key offerings
                • SWOT
              • 15.17 Pfizer Inc.
                • Pfizer Inc. - Overview
                • Pfizer Inc. - Product / Service
                • Pfizer Inc. - Key news
                • Pfizer Inc. - Key offerings
                • SWOT
              • 15.18 PharmaMar SA
                • PharmaMar SA - Overview
                • PharmaMar SA - Business segments
                • PharmaMar SA - Key offerings
                • PharmaMar SA - Segment focus
                • SWOT

              16 Appendix

              • 16.1 Scope of the report
                • 16.2 Inclusions and exclusions checklist
                  • Inclusions checklist
                  • Exclusions checklist
                • 16.3 Currency conversion rates for US$
                  • Currency conversion rates for US$
                • 16.4 Research methodology
                  • Research methodology
                • 16.5 Data procurement
                  • Information sources
                • 16.6 Data validation
                  • Data validation
                • 16.7 Validation techniques employed for market sizing
                  • Validation techniques employed for market sizing
                • 16.8 Data synthesis
                  • Data synthesis
                • 16.9 360 degree market analysis
                  • 360 degree market analysis
                • 16.10 List of abbreviations
                  • List of abbreviations

                Research Methodology

                Technavio presents a detailed picture of the market by way of study, synthesis, and summation of data from multiple sources. The analysts have presented the various facets of the market with a particular focus on identifying the key industry influencers. The data thus presented is comprehensive, reliable, and the result of extensive research, both primary and secondary.

                INFORMATION SOURCES

                Primary sources

                • Manufacturers and suppliers
                • Channel partners
                • Industry experts
                • Strategic decision makers

                Secondary sources

                • Industry journals and periodicals
                • Government data
                • Financial reports of key industry players
                • Historical data
                • Press releases

                DATA ANALYSIS

                Data Synthesis

                • Collation of data
                • Estimation of key figures
                • Analysis of derived insights

                Data Validation

                • Triangulation with data models
                • Reference against proprietary databases
                • Corroboration with industry experts

                REPORT WRITING

                Qualitative

                • Market drivers
                • Market challenges
                • Market trends
                • Five forces analysis

                Quantitative

                • Market size and forecast
                • Market segmentation
                • Geographical insights
                • Competitive landscape

                Interested in this report?

                Get your sample now to see our research methodology and insights!

                Download Now

                Frequently Asked Questions

                Ewings Sarcoma Treatment market growth will increase by $ 181.3 mn during 2025-2029 .

                The Ewings Sarcoma Treatment market is expected to grow at a CAGR of 5.6% during 2025-2029 .

                Ewings Sarcoma Treatment market is segmented by Type( Combination therapy, Monotherapy, Others) End-user( Hospitals, Specialty clinics, Others, Rest of World (ROW))

                Actiza Pharmaceutical Pvt. Ltd., Advantech Co. Ltd., Amneal Pharmaceuticals Inc., Baxter International Inc., Bristol Myers Squibb Co., Cellectar Biosciences Inc., Daiichi Sankyo Co. Ltd., Eli Lilly and Co., Fresenius Kabi AG, GlaxoSmithKline Plc, Gradalis Inc., Johnson and Johnson Inc., LGM Pharma LLC, Merck and Co. Inc., Novartis AG, Ocean pharmaceutical, Pfizer Inc., PharmaMar SA, Salvavidas, UPMC Hillman Cancer Center are a few of the key vendors in the Ewings Sarcoma Treatment market.

                North America will register the highest growth rate of 51% among the other regions. Therefore, the Ewings Sarcoma Treatment market in North America is expected to garner significant business opportunities for the vendors during the forecast period.

                US, Canada, Germany, UK, Italy, France, China, India, Japan, Brazil, Egypt, UAE, Oman, Argentina, KSA, UAE, Brazil, Rest of World (ROW)

                • Growing awareness about and funding for Ewings sarcomaSeveral public and private organizations are undertaking initiatives to increase awareness about Ewings sarcoma. Numerous independent sarcoma organizations is the driving factor this market.
                • such as Sarcoma Foundation of America is the driving factor this market.
                • CureResearch is the driving factor this market.
                • Sarcoma UK is the driving factor this market.
                • and Sarcoma Alliance is the driving factor this market.
                • support and educate patients with Ewings sarcoma. Such campaigns focused on raising awareness and research funds for sarcoma. Sarcoma is still considered an overlooked cancer. Therefore is the driving factor this market.
                • efforts to encourage research and drug development are more challenging due to the lack of awareness. Therefore is the driving factor this market.
                • every year is the driving factor this market.
                • July is celebrated as Sarcoma Awareness Month is the driving factor this market.
                • wherein different organizations conduct educational programs to raise awareness globally among patients with Ewings sarcoma. Similarly is the driving factor this market.
                • the Liddy Shriver Sarcoma Initiative and the Allandale familys campaign are dedicated to improving the lives of sarcoma patients by increasing awareness about sarcoma and funding high-quality research. Furthermore is the driving factor this market.
                • the Sarcoma Foundation of America is a non-profit organization that is dedicated to supporting sarcoma patients by funding research and increasing awareness about sarcoma is the driving factor this market.
                • including Ewings sarcoma. The organization raises money to privately fund grants for sarcoma researchers and educates sarcoma patients.Efforts undertaken by such organizations and associations are expected to increase awareness and funding for Ewings sarcoma and contribute to the growth of the global Ewings sarcoma treatment market to a certain extent. Therefore is the driving factor this market.
                • growing awareness about and funding for Ewings sarcoma will drive the growth of the global Ewings sarcoma treatment market during the forecast period. is the driving factor this market.

                The Ewings Sarcoma Treatment market vendors should focus on grabbing business opportunities from the Combination therapy segment as it accounted for the largest market share in the base year.