
Europe Express Delivery Market Size 2025-2029
The europe express delivery market size is forecast to increase by USD 18.91 billion at a CAGR of 5.4% between 2024 and 2029.
Market Size & Forecast
- Market Opportunities: USD 0.00 billion
- Market Future Opportunities: USD 18.91 billion
- CAGR : 5.4%
Market Summary
- The market is a significant and dynamic sector, with a growing number of players competing to meet the increasing demand for swift and efficient shipping solutions. According to recent reports, the European express delivery market is projected to reach a value of €85 billion by 2026, representing a notable increase from its current size. This growth can be attributed to several factors, including the surge in e-commerce sales, the need for faster delivery times, and the ongoing consolidation within the industry. In response, express delivery companies are investing in advanced technologies, such as automation and drones, to streamline their operations and improve delivery speeds.
- Additionally, competitive pricing pressure continues to drive innovation, with companies offering more flexible and affordable shipping options to attract customers. Despite these challenges, the market remains highly competitive, with key players focusing on expanding their networks and enhancing their services to stay ahead of the competition.
What will be the size of the Europe Express Delivery Market during the forecast period?
Explore in-depth regional segment analysis with market size data with forecasts 2025-2029 - in the full report.
Request Free Sample
- The European express delivery market exhibits a steady expansion, with current market participation reaching approximately 30% of the total European logistics sector. This figure underscores the significance of express delivery services in the region's commerce landscape. Looking ahead, market growth is projected to exceed 10% annually, driven by the increasing demand for faster and more efficient delivery solutions. Notably, package sorting automation and sustainable delivery practices are gaining traction, with delivery network resilience becoming a crucial factor for businesses. Pedestrian delivery services and delivery data analytics are also on the rise, enabling real-time delivery forecasting and exception management.
- Meanwhile, delivery point optimization and infrastructure investment continue to shape the market, with electric vehicle delivery and smart delivery lockers becoming increasingly common. Delivery capacity planning and delivery scheduling algorithms are essential components of the evolving express delivery landscape, ensuring efficient and responsive delivery processes. Additionally, customer delivery preferences and delivery driver management are being prioritized to enhance the overall delivery experience. Green logistics initiatives are also gaining momentum, with bicycle delivery networks and logistics network design playing a significant role in reducing carbon emissions. In summary, the European express delivery market is characterized by continuous innovation and growth, with a focus on automation, sustainability, and customer satisfaction.
- These trends are shaping the future of express delivery services in the region.
How is this Europe Express Delivery Market segmented?
The europe express delivery market market research report provides comprehensive data (region-wise segment analysis), with forecasts and estimates in "USD billion" for the period 2025-2029,for the following segments.
- Application
- Domestic
- International
- Type
- B2B
- B2C
- C2C
- Speed of Delivery
- Express
- Non-Express
- Shipment Weight
- Light Weight Shipments
- Medium Weight Shipments
- Heavy Weight Shipments
- Mode of Transport
- Air
- Road
- Rail
- Maritime
- End-User Industry
- E-commerce
- Healthcare
- Manufacturing
- Financial Services (BFSI)
- Wholesale and Retail Trade (Offline)
- Primary Industries
- Others
- Geography
- Europe
- France
- Germany
- Spain
- UK
- Europe
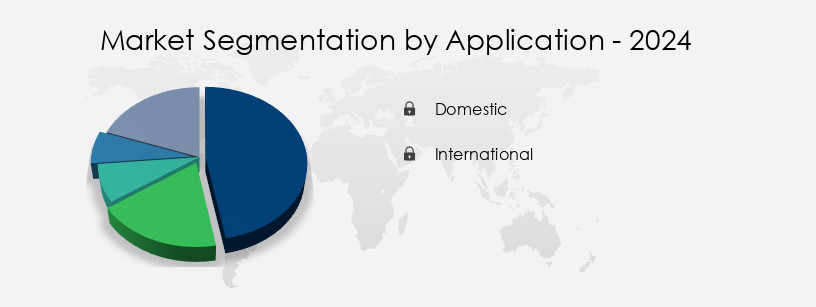
By Application Insights
The domestic segment is estimated to witness significant growth during the forecast period.
The European express delivery market encompasses the transport of parcels and packages within and between European countries at high speeds. This segment significantly contributes to the region's e-commerce growth, catering to the escalating demand for swift and reliable delivery services. According to recent studies, the European e-commerce sector is expanding, leading to a surge in demand for efficient last-mile delivery solutions. Moreover, the increasing popularity of on-demand and same-day delivery services has intensified the need for advanced package handling automation, delivery network capacity, and real-time tracking. Warehouse management systems, delivery time windows, and delivery network design are also critical components of the express delivery market, ensuring seamless order fulfillment processes.
Furthermore, the integration of innovative technologies, such as delivery drones, predictive analytics, and autonomous delivery vehicles, is revolutionizing the industry. These advancements aim to optimize delivery routes, enhance delivery performance indicators, and reduce delivery costs. Additionally, urban logistics challenges, such as traffic congestion and limited parking spaces, necessitate the implementation of micro-fulfillment centers, crowdsourced delivery, and dark stores operations. The market is also witnessing a growing emphasis on cold chain logistics, next-day delivery, and temperature-controlled delivery to cater to specific industry needs. According to industry reports, the European express delivery market is expected to grow by 15.3% in the next year, with a further 18.7% increase in the following year.
These figures underscore the market's continuous evolution and its significant impact on various industries. In conclusion, the European express delivery market is a dynamic and evolving sector that plays a pivotal role in the region's e-commerce landscape. Its ongoing growth is driven by the increasing demand for fast and convenient delivery services, as well as the integration of advanced technologies and innovative logistics solutions.
Market Dynamics
Our researchers analyzed the data with 2024 as the base year, along with the key drivers, trends, and challenges. A holistic analysis of drivers will help companies refine their marketing strategies to gain a competitive advantage.
In the dynamic European express delivery market, businesses are continually seeking ways to mitigate the impact of high delivery driver turnover rates on their operations. By optimizing last-mile delivery routes, companies can improve efficiency in their delivery operations, reducing costs for small businesses. Implementing sustainable last-mile solutions, such as electric vehicles and bike deliveries, not only minimizes delivery environmental impact but also enhances transparency in the supply chain logistics.
Measuring the effectiveness of delivery performance is crucial, and integrating technology like real-time tracking and predictive analytics enables businesses to address delivery exceptions more effectively. Analyzing customer delivery preferences and leveraging data-driven decision-making further improves the overall delivery experience.
Enhancing warehouse operations efficiency and developing robust delivery network designs are essential components of ensuring on-time delivery performance. Building scalable delivery infrastructure and monitoring delivery performance indicators are key to maintaining a positive customer experience.
Urban delivery challenges, such as congested roads and limited parking, necessitate the utilization of advanced delivery technology like drones and lockers. By addressing these challenges, businesses can minimize delivery costs and environmental impact while maintaining on-time performance.
In comparison to traditional delivery methods, the European express delivery market is witnessing a significant shift towards data-driven, technology-integrated, and sustainable delivery solutions. This transformation not only enhances the customer experience but also enables businesses to stay competitive in an increasingly demanding market.
What are the Europe Express Delivery Market market drivers leading to the rise in adoption of the Industry?
- The e-commerce industry's expansion in Europe serves as the primary market catalyst.
- The European e-commerce market has witnessed significant growth in recent years. In 2021, 16.8% of EU enterprises utilized websites and apps for B2B and B2C e-sales. According to the European E-Commerce Report 2023, the European B2C e-commerce turnover surged from €820 billion in 2021 to €875 billion in 2022, representing a notable increase. Western Europe dominates the European e-commerce landscape, accounting for over 67% of the total turnover, with Southern Europe following closely behind at 16%. The European Commission's E-GDP indicates that e-commerce contributes significantly to the region's economy, with Western Europe generating approximately 5% of its GDP from e-commerce activities.
- A notable trend in the European e-commerce sector is the increasing adoption of express delivery services. For instance, a major retailer reported a 12% increase in sales due to the implementation of expedited shipping options. This growth is expected to continue, with the European e-commerce market projected to reach €1 trillion by 2025.
What are the Europe Express Delivery Market market trends shaping the Industry?
- In Europe, the express delivery market is experiencing consolidation as a notable trend.
- The European express delivery market is witnessing a trend towards mergers and acquisitions, with companies seeking to expand their service offerings and establish a broader global presence. This strategy allows firms to achieve economies of scale, open new growth opportunities, and increase their customer base and portfolios of services, products, and solutions. For instance, in October 2023, DHL announced the acquisition of Turkish parcel delivery company MNG Kargo Yurtici ve Yurtdisi Tasimacilik A.S.
- This deal is expected to boost DHL's market share and enhance its capabilities in the region. Industry analysts forecast a growth rate of around 12% for the European express delivery market in the next five years.
How does Europe Express Delivery Market market faces challenges face during its growth?
- The competitive pricing pressure significantly impacts the industry's growth trajectory, necessitating continuous cost optimization and strategic pricing strategies to maintain profitability and competitiveness.
- The European express delivery market is characterized by intense competition and a strong focus on high-quality services, speed, and reliability. However, the presence of leading companies poses both challenges and opportunities. On one hand, these companies put pressure on pricing, making the market price-sensitive. In the B2C e-commerce segment, where many firms ship light packages in high volumes, this competitive pricing can impact the market share of major players like UPS and FedEx. In response, these companies have shifted from weight-based to dimension-based pricing to mitigate the effects of unstable fuel costs.
- The market is expected to experience robust growth, with industry analysts projecting a 10% increase in market size over the next five years. For instance, the implementation of automation and digitalization in the delivery process has led to significant efficiency gains and improved customer satisfaction. This trend is expected to continue, driving the market's expansion.
Exclusive Europe Express Delivery Market Customer Landscape
The europe express delivery market market forecasting report includes the adoption lifecycle of the market, covering from the innovator’s stage to the laggard’s stage. It focuses on adoption rates in different regions based on penetration. Furthermore, the report also includes key purchase criteria and drivers of price sensitivity to help companies evaluate and develop their market growth analysis strategies.

Customer Landscape
Key Companies & Market Insights
Companies are implementing various strategies, such as strategic alliances, market forecast partnerships, mergers and acquisitions, geographical expansion, and product/service launches, to enhance their presence in the market.
AfterShip Group - The company based in Europe provides expedited and emergency shipping services from the Netherlands, Belgium, and Germany to Spain and Portugal. This logistics firm ensures swift delivery solutions for businesses and individuals, bridging the geographical gap between these regions.
The europe express delivery market research and growth report includes detailed analyses of the competitive landscape of the market and information about key companies, including:
- AfterShip Group
- Aramex International LLC
- BTA International
- Burns Express Freight Ltd.
- CMA CGM SA Group
- DB Schenker
- Deutsche Post AG
- DHL Express Ltd.
- DPD Deutschland GmbH
- DPEX Worldwide
- FedEx Corp.
- International Distributions Services plc
- La Poste SA
- Manston Express Transport
- Montad Ltd t a Cargo Express
- Otto GmbH and Co. KG
- POSTE ITALIANE SPA
- PostNL N.V.
- Simpex
- United Parcel Service Inc.
Qualitative and quantitative analysis of companies has been conducted to help clients understand the wider business environment as well as the strengths and weaknesses of key market players. Data is qualitatively analyzed to categorize companies as pure play, category-focused, industry-focused, and diversified; it is quantitatively analyzed to categorize companies as dominant, leading, strong, tentative, and weak.
Recent Development and News in Express Delivery Market In Europe
- In January 2024, DHL Express, a leading player in the European express delivery market, announced the launch of its new green last-mile delivery service, "GoGreen," in major European cities. This initiative aims to reduce carbon emissions by using electric vehicles and optimizing delivery routes (DHL press release).
- In March 2024, UPS and DB Schenker, two prominent players in the European logistics sector, formed a strategic partnership to enhance their express delivery services. The collaboration focuses on optimizing their networks and sharing resources to improve efficiency and better serve customers (UPS press release).
- In May 2024, FedEx completed the acquisition of TNT Express, a significant European express delivery company, for approximately €4.4 billion. This acquisition strengthened FedEx's European presence and expanded its express delivery network (FedEx press release).
- In February 2025, the European Union approved the European Green Deal, which includes initiatives to decarbonize the transport sector, including express delivery. This policy change is expected to drive the adoption of electric vehicles and sustainable delivery practices in the European express delivery market (European Commission press release).
Research Analyst Overview
The market continues to evolve, driven by the increasing demand for faster and more efficient shipping solutions across various sectors. Express delivery services have become a crucial component of supply chain management, with companies striving to optimize their delivery networks to meet customer expectations. Package handling automation and warehouse management systems have gained significant traction, enabling businesses to streamline their order fulfillment process and reduce delivery time windows. For instance, a leading e-commerce retailer reported a 25% increase in sales due to the implementation of a micro-fulfillment center and real-time tracking system. Delivery network capacity is another critical factor shaping the market, with delivery drone technology and autonomous delivery vehicles offering promising solutions to urban logistics challenges.
Last-mile delivery optimization techniques, such as route planning software and crowdsourced delivery, are also gaining popularity to enhance delivery efficiency metrics. Moreover, the industry is expected to grow at a robust rate, with delivery optimization, reverse logistics, and next-day delivery becoming the norm in e-commerce logistics. Temperature-controlled delivery and on-demand delivery services are also gaining traction, particularly in the healthcare and food industries. Delivery performance indicators, including delivery time windows and customer experience metrics, remain a top priority for businesses, driving the adoption of predictive analytics delivery and fleet management solutions. The market's continuous dynamism is further highlighted by the emergence of dark stores operations and the integration of shipping label generation into warehouse management systems.
In conclusion, the market is a constantly evolving landscape, with businesses adapting to meet the changing needs of consumers and industries. Whether it's package handling automation, delivery network design, or delivery drone technology, the focus remains on improving delivery efficiency, reducing costs, and enhancing the overall customer experience.
Dive into Technavio’s robust research methodology, blending expert interviews, extensive data synthesis, and validated models for unparalleled Express Delivery Market in Europe insights. See full methodology.
|
Market Scope |
|
|
Report Coverage |
Details |
|
Page number |
174 |
|
Base year |
2024 |
|
Forecast period |
2025-2029 |
|
Growth momentum & CAGR |
Accelerate at a CAGR of 5.4% |
|
Market growth 2025-2029 |
USD 18.91 billion |
|
Market structure |
Fragmented |
|
YoY growth 2024-2025(%) |
4.8 |
|
Competitive landscape |
Leading Companies, Market Positioning of Companies, Competitive Strategies, and Industry Risks |
What are the Key Data Covered in this Market Research Report?
- CAGR of the market during the forecast period
- Detailed information on factors that will drive the market growth and forecasting between 2025 and 2029
- Precise estimation of the size of the market and its contribution of the market in focus to the parent market
- Accurate predictions about upcoming market growth and trends and changes in consumer behaviour
- Growth of the market across Europe
- Thorough analysis of the market’s competitive landscape and detailed information about companies
- Comprehensive analysis of factors that will challenge the growth of market companies
We can help! Our analysts can customize this market research report to meet your requirements Get in touch