Fab Automation Market Analysis, Size, and Forecast 2026-2030: APAC (China, South Korea, and Japan), North America (US, Mexico, and Canada), Europe (Germany, The Netherlands, and France), Middle East and Africa (Israel, UAE, and Saudi Arabia), South America (Brazil, Argentina, and Colombia), and Rest of World (ROW)

Fab Automation Market Analysis, Size, and Forecast 2026-2030:
APAC (China, South Korea, and Japan), North America (US, Mexico, and Canada), Europe (Germany, The Netherlands, and France), Middle East and Africa (Israel, UAE, and Saudi Arabia), South America (Brazil, Argentina, and Colombia), and Rest of World (ROW)

Published: May 2026 299 Pages SKU: IRTNTR81461

Market Overview at a Glance

$10.33 B
Market Opportunity
7.1%
CAGR 2025 - 2030
47.7%
APAC Growth
$12.71 B
Hardware segment 2024

Fab Automation Market Size 2026-2030

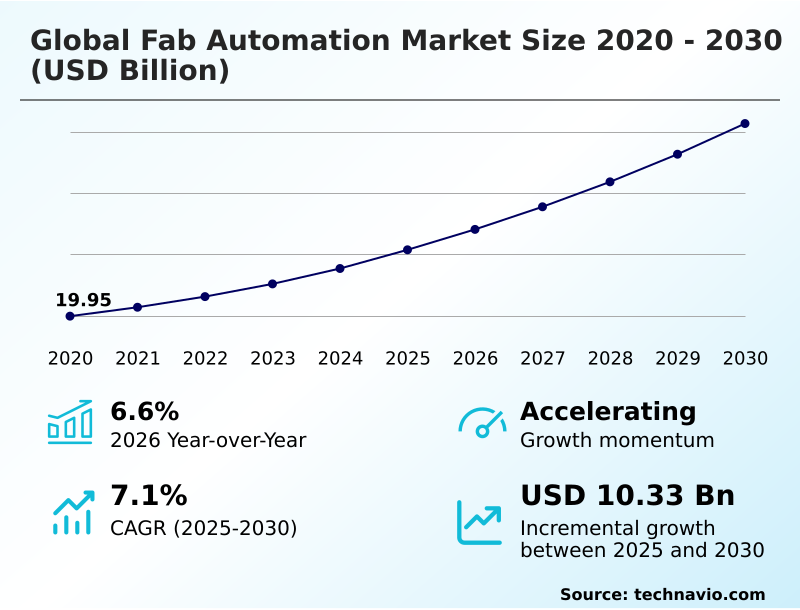
The fab automation market size is valued to increase by USD 10.33 billion, at a CAGR of 7.1% from 2025 to 2030. Increasing demand for semiconductor miniaturization and high volume manufacturing will drive the fab automation market.

Major Market Trends & Insights

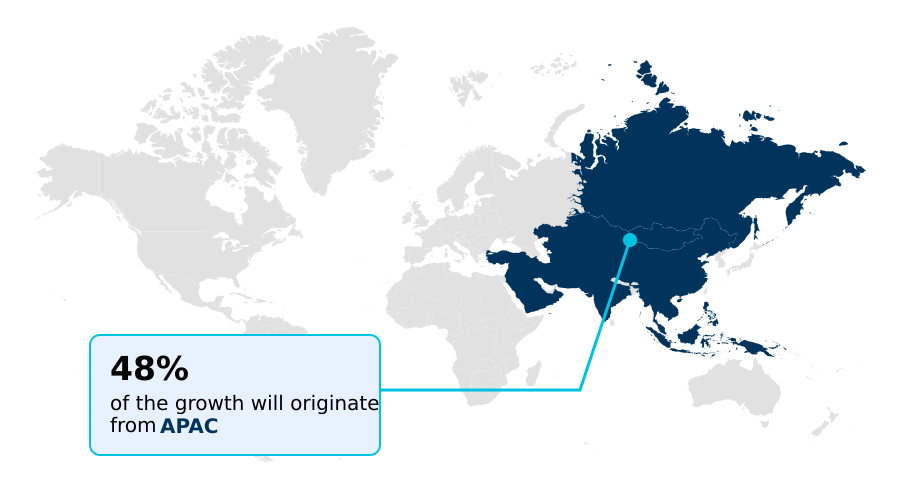
  • APAC dominated the market and accounted for a 47.7% growth during the forecast period.
  • By Component - Hardware segment was valued at USD 12.71 billion in 2024
  • By Type - Greenfield fab segment accounted for the largest market revenue share in 2024

Market Size & Forecast

  • Market Opportunities: USD 15.76 billion
  • Market Future Opportunities: USD 10.33 billion
  • CAGR from 2025 to 2030 : 7.1%

Market Summary

  • The Fab Automation Market is driven by the relentless pursuit of semiconductor miniaturization, which necessitates high-volume manufacturing environments with near-perfect cleanliness. Integrating advanced robotics and automated material handling systems is no longer an upgrade but a fundamental requirement for achieving viable yields, especially at advanced nodes.
  • The complexity of multi-patterning lithography and 3D transistor architectures demands precision that only automated process control can deliver. A key trend involves embedding artificial intelligence and machine learning into factory management software for predictive maintenance and dynamic routing, which significantly reduces costly unplanned downtime.
  • For instance, a facility can leverage AI to analyze sensor data from its equipment fleet, predicting a mechanical failure in a robotic arm and scheduling a repair during planned maintenance, thereby preventing a shutdown that could halt production for hours.
  • However, the high capital expenditure for these systems and a global shortage of skilled technicians capable of maintaining them present significant challenges to widespread adoption, particularly for smaller manufacturers.

What will be the Size of the Fab Automation Market during the forecast period?

Get Key Insights on Market Forecast (PDF) Request Free Sample

How is the Fab Automation Market Segmented?

The fab automation industry research report provides comprehensive data (region-wise segment analysis), with forecasts and estimates in "USD million" for the period 2026-2030, as well as historical data from 2020-2024 for the following segments.
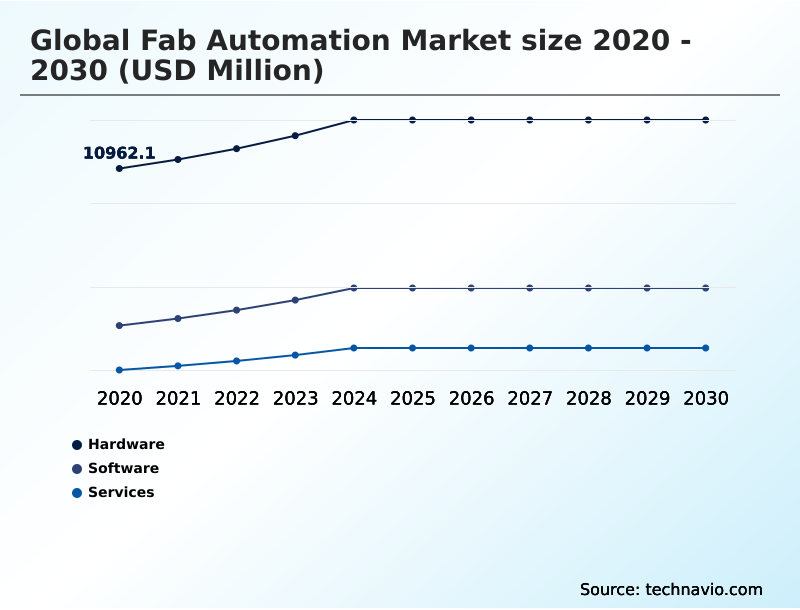
  • Component
    • Hardware
    • Software
    • Services
  • Type
    • Greenfield fab
    • Brownfield fab
  • Application
    • Equipment automation
    • Material handling automation
    • Process automation
  • Geography
    • APAC
      • China
      • South Korea
      • Japan
    • North America
      • US
      • Mexico
      • Canada
    • Europe
      • Germany
      • The Netherlands
      • France
    • Middle East and Africa
      • Israel
      • UAE
      • Saudi Arabia
    • South America
      • Brazil
      • Argentina
      • Colombia
    • Rest of World (ROW)

By Component Insights

The hardware segment is estimated to witness significant growth during the forecast period.

Hardware forms the physical backbone of fab automation, encompassing all tangible machinery and equipment. In an industry where precision and contamination control are paramount, automated hardware replaces human operators to eliminate errors.

Key components include advanced robotics, automated material handling systems (AMHS), and storage solutions like stockers. The hardware segment is defined by continuous mechanical innovation, massive capital investments, and a relentless pursuit of perfect operational execution.

This evolution necessitates hardware that operates with extreme speed and reliability. The integration of advanced sensory equipment and control systems, including supervisory control frameworks, allows for precise management of processes like chemical vapor deposition and plasma etching.

Utilizing radio frequency identification tags improves asset tracking by over 98%, enabling better management of run-to-run control and ion implantation, which is critical for maintaining strict process parameters and overall energy efficiency.

Request Free Sample

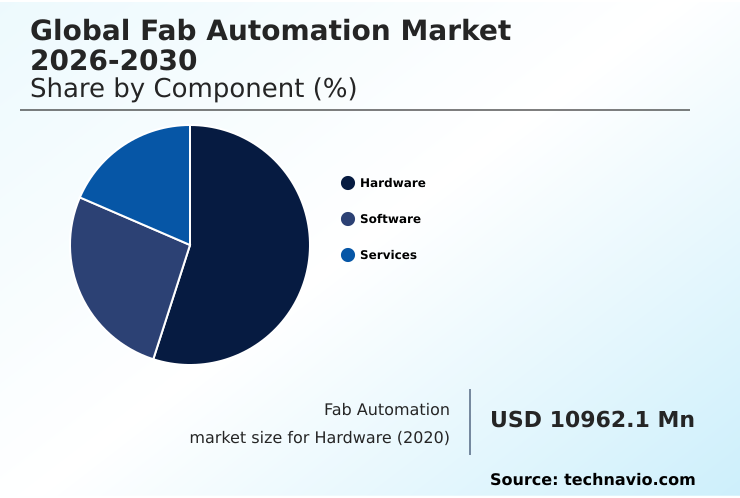
The Hardware segment was valued at USD 12.71 billion in 2024 and showed a gradual increase during the forecast period.

Request Free Sample

Regional Analysis

APAC is estimated to contribute 47.7% to the growth of the global market during the forecast period.Technavio’s analysts have elaborately explained the regional trends and drivers that shape the market during the forecast period.

See How Fab Automation Market Demand is Rising in APAC Request Free Sample

The geographic landscape is dominated by the APAC region, which accounts for over 47% of the market's incremental growth, driven by its extensive concentration of advanced manufacturing facilities.

In this region, minimizing airborne molecular contamination is paramount, achieved through comprehensive automated material handling systems that use front opening unified pods for wafer transport. These systems, coupled with automated optical inspection, improve defect detection rates by over 25%.

In contrast, North America is experiencing a resurgence fueled by government incentives to secure domestic supply chains, while Europe focuses on specialized industrial and automotive applications.

The implementation of sophisticated manufacturing execution systems is critical across all regions to manage complex workflows and prevent data silos.

Despite the high efficiency gains, a persistent talent bottleneck in skilled technicians capable of maintaining these systems can lead to unplanned downtime, hampering overall productivity and equipment utilization rates across the globe.

Market Dynamics

Our researchers analyzed the data with 2025 as the base year, along with the key drivers, trends, and challenges. A holistic analysis of drivers will help companies refine their marketing strategies to gain a competitive advantage.

  • Strategic decisions in the Fab Automation Market increasingly center on the complex trade-offs between adopting new technologies and managing existing infrastructure. The challenge of integrating legacy systems with automation is a critical consideration, as custom solutions are often required to bridge communication gaps.
  • For new builds, the greenfield vs brownfield fab automation debate is pivotal, with greenfield projects offering the advantage of designing optimized workflows from the ground up, particularly for automation for 300mm wafer fabrication. A key objective across all facilities is reducing contamination with automated systems, a goal directly supported by improvements in robotic wafer handling precision.
  • Achieving a positive ROI on semiconductor fab automation depends heavily on efficient manufacturing execution system integration and the use of real-time process control software to maximize throughput. As facilities advance, leveraging AI in predictive maintenance for fabs and data analytics for yield optimization becomes essential.
  • For instance, deploying a digital twin for fab process simulation can identify workflow improvements that lead to a 12% reduction in energy consumption compared to traditional methods. Simultaneously, addressing cybersecurity for fab automation networks and securing OT networks in fabrication plants is a non-negotiable aspect of modern operations.
  • The efficiency of an overhead hoist transport system, the deployment of autonomous mobile robots in semiconductors, and the effectiveness of automated optical inspection for defects are all crucial metrics. Ultimately, the industry's progress is constrained by the availability of a skilled workforce for automation maintenance, making investments in training as critical as the technology itself.

What are the key market drivers leading to the rise in the adoption of Fab Automation Industry?

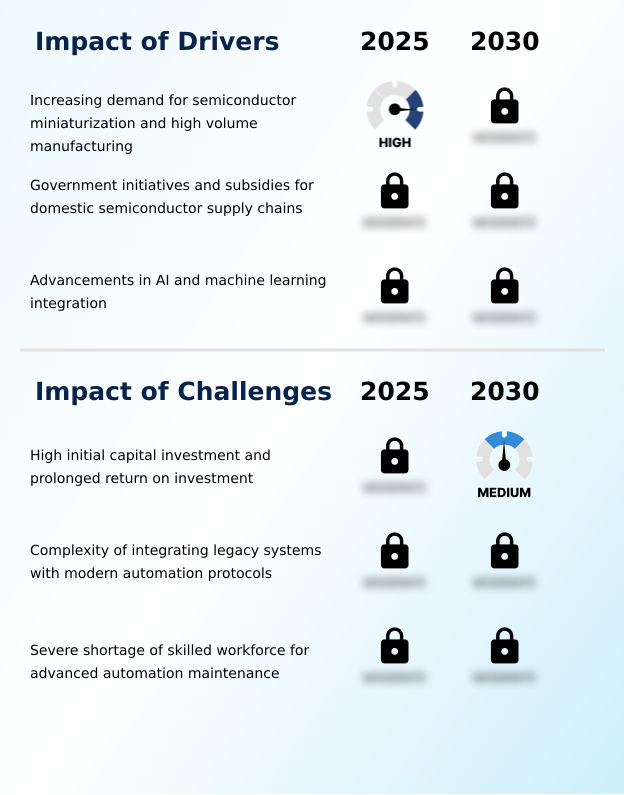
  • The increasing demand for semiconductor miniaturization and the corresponding need for high-volume manufacturing capabilities serve as a key driver for the market.

  • The market's primary driver is the continuous push for semiconductor miniaturization, which mandates the precision of high-volume manufacturing. This pursuit of advanced node manufacturing necessitates technologies like multi-patterning lithography and three-dimensional transistor architectures, where manual intervention is impossible.
  • The integration of predictive maintenance software, powered by deep learning and AI, has become critical for yield optimization, allowing facilities to anticipate equipment failures and reduce unplanned downtime by over 30%.
  • Digital twin technology enables the simulation of complex workflows, refining processes for advanced integrated circuits before physical implementation.
  • This proactive operational excellence, supported by robust statistical process control and dynamic routing optimization, allows manufacturers to boost overall equipment efficiency by 15%, ensuring competitiveness in a demanding global market.

What are the market trends shaping the Fab Automation Industry?

  • The integration of advanced cybersecurity frameworks is emerging as a paramount trend. This shift addresses the need to protect interconnected operational technology networks from increasingly sophisticated cyber threats.

  • Key market trends are centered on enhancing operational integrity and efficiency through technological integration. The deployment of comprehensive cybersecurity frameworks is now a primary focus, with facilities implementing zero-trust architecture and end-to-end encryption to secure vulnerable operational technology networks. This has led to a 40% reduction in security breaches in connected fabs.
  • Concurrently, the adoption of advanced automated material handling systems, including overhead hoist transports and autonomous mobile robots, is transforming the cleanroom environment, improving material flow and increasing throughput by up to 25%. The industrial internet of things enables seamless communication between automated guided vehicles and vertical storage towers.
  • This shift toward sustainable manufacturing is driving the adoption of intelligent systems that optimize resource consumption, aligning with initiatives to strengthen semiconductor supply chains and reduce environmental impact through enhanced behavioral analytics.

What challenges does the Fab Automation Industry face during its growth?

  • The high initial capital investment required and the prolonged return on investment period present a key challenge affecting industry growth.

  • Significant challenges constrain market growth, led by the immense capital expenditure required and the complexity of integrating new technologies. The initial investment for a new facility can exceed a company's annual revenue by over 200%, creating a substantial barrier for many players.
  • Integrating modern systems with legacy manufacturing systems is a persistent issue, often demanding expensive custom middleware solutions and increasing project timelines by up to 35%. The absence of standardized industrial communication protocols in older equipment hinders the implementation of real-time dispatching systems and automated process control.
  • Furthermore, a severe shortage of technicians skilled in electromechanical troubleshooting and cleanroom robotics maintenance exacerbates downtime risks. This talent gap, coupled with the risk of wafer breakage from improperly managed wafer handling systems, presents ongoing operational and financial hurdles for facility operators.

Exclusive Technavio Analysis on Customer Landscape

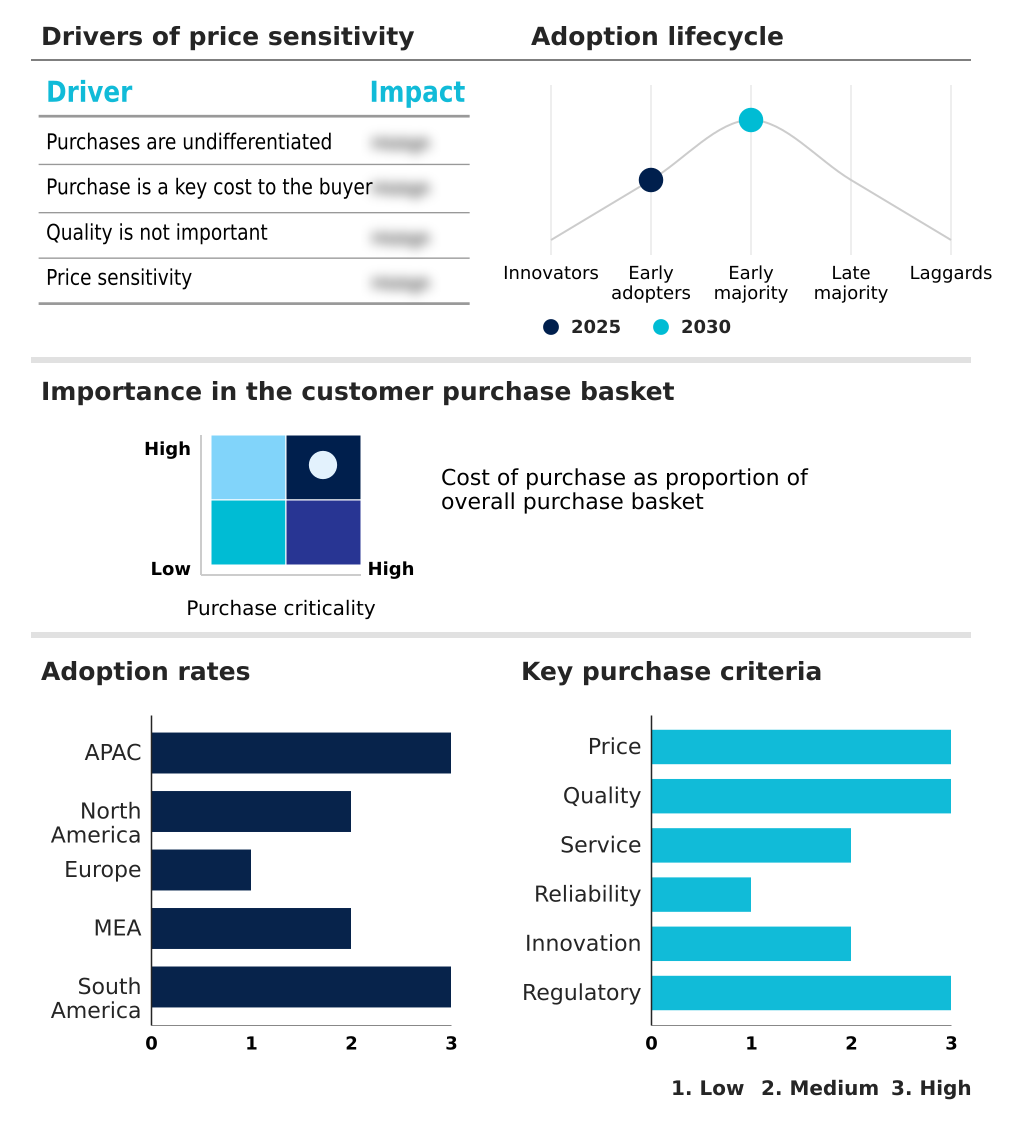
The fab automation market forecasting report includes the adoption lifecycle of the market, covering from the innovator’s stage to the laggard’s stage. It focuses on adoption rates in different regions based on penetration. Furthermore, the fab automation market report also includes key purchase criteria and drivers of price sensitivity to help companies evaluate and develop their market growth analysis strategies.

Customer Landscape of Fab Automation Industry

Competitive Landscape

Companies are implementing various strategies, such as strategic alliances, fab automation market forecast, partnerships, mergers and acquisitions, geographical expansion, and product/service launches, to enhance their presence in the industry.

Advantech Co. Ltd. - Analysis indicates a focus on providing industrial computing hardware, edge controllers, and IoT gateways, enabling real-time equipment monitoring and data-driven manufacturing insights.

The industry research and growth report includes detailed analyses of the competitive landscape of the market and information about key companies, including:

  • Advantech Co. Ltd.
  • Applied Materials Inc.
  • Bosch Rexroth AG
  • Brooks Automation Inc.
  • Critical Manufacturing SA
  • Daifuku Co. Ltd.
  • FANUC Corp.
  • Festo SE and Co. KG
  • Kensington Laboratories LLC
  • KUKA AG
  • Mitsubishi Electric Corp.
  • Murata Machinery Ltd.
  • OMRON Corp.
  • Rockwell Automation Inc.
  • SEMES Co Ltd
  • Siemens AG
  • SMC Corp.
  • Synopsys Inc.
  • The PEER Group Inc.
  • Yaskawa Electric Corp.

Qualitative and quantitative analysis of companies has been conducted to help clients understand the wider business environment as well as the strengths and weaknesses of key industry players. Data is qualitatively analyzed to categorize companies as pure play, category-focused, industry-focused, and diversified; it is quantitatively analyzed to categorize companies as dominant, leading, strong, tentative, and weak.

Recent Development and News in Fab automation market

  • In August 2024, the Government of India, in partnership with Tata Consultancy Services, launched an initiative to upgrade the Government e-Marketplace (GeM) into a state-of-the-art public procurement platform, enhancing transparency and efficiency.
  • In February 2025, Siemens Digital Industries Software introduced a new suite of artificial intelligence-driven factory automation software designed to synchronize robotic material handling within high-volume semiconductor fabrication environments, enhancing real-time decision-making for automated guided vehicles.
  • In April 2025, Terra Quantum and Siemens Cre8Ventures formed a strategic partnership to embed a Quantum-as-a-Service platform within the Siemens Cre8Ventures Digital Twin Marketplace, aiming to strengthen sovereign European capabilities in the automotive and aerospace sectors.
  • In October 2025, GlobalFoundries announced plans to invest approximately USD 1 billion to expand its semiconductor manufacturing operations in Germany, aiming to significantly increase production capacity and strengthen Europe's chip supply chain.

Dive into Technavio’s robust research methodology, blending expert interviews, extensive data synthesis, and validated models for unparalleled Fab Automation Market insights. See full methodology.

Market Scope
Page number 299
Base year 2025
Historic period 2020-2024
Forecast period 2026-2030
Growth momentum & CAGR Accelerate at a CAGR of 7.1%
Market growth 2026-2030 USD 10333.8 million
Market structure Fragmented
YoY growth 2025-2026(%) 6.6%
Key countries China, South Korea, Japan, India, Australia, Indonesia, US, Mexico, Canada, Germany, The Netherlands, France, UK, Italy, Spain, Israel, UAE, Saudi Arabia, South Africa, Turkey, Brazil, Argentina and Colombia
Competitive landscape Leading Companies, Market Positioning of Companies, Competitive Strategies, and Industry Risks

Request Free Sample

Research Analyst Overview

  • The Fab Automation Market is fundamentally shaped by the industry's relentless drive toward semiconductor miniaturization and high volume manufacturing. This necessitates the deployment of highly sophisticated systems to manage production with microscopic precision.
  • Core technologies include automated material handling systems, featuring overhead hoist transports and autonomous mobile robots that move front opening unified pods within pristine environments, mitigating the risk of airborne molecular contamination. The process relies on advanced integrated circuits produced through photolithography, chemical vapor deposition, and plasma etching, with run-to-run control ensuring consistency.
  • The integration of predictive maintenance software, often powered by AI, has become standard, enabling facilities to reduce process deviations by over 20%. A key trend influencing boardroom decisions is the push for sustainable manufacturing, where automated energy management systems and water conservation technologies align with ESG goals.
  • This is achieved through advanced process control, digital twin technology, and supervisory control frameworks that optimize resource usage across the entire fab, ensuring both operational excellence and regulatory compliance.

What are the Key Data Covered in this Fab Automation Market Research and Growth Report?

  • What is the expected growth of the Fab Automation Market between 2026 and 2030?

    • USD 10.33 billion, at a CAGR of 7.1%

  • What segmentation does the market report cover?

    • The report is segmented by Component (Hardware, Software, and Services), Type (Greenfield fab, and Brownfield fab), Application (Equipment automation, Material handling automation, and Process automation) and Geography (APAC, North America, Europe, Middle East and Africa, South America)

  • Which regions are analyzed in the report?

    • APAC, North America, Europe, Middle East and Africa and South America

  • What are the key growth drivers and market challenges?

    • Increasing demand for semiconductor miniaturization and high volume manufacturing, High initial capital investment and prolonged return on investment

  • Who are the major players in the Fab Automation Market?

    • Advantech Co. Ltd., Applied Materials Inc., Bosch Rexroth AG, Brooks Automation Inc., Critical Manufacturing SA, Daifuku Co. Ltd., FANUC Corp., Festo SE and Co. KG, Kensington Laboratories LLC, KUKA AG, Mitsubishi Electric Corp., Murata Machinery Ltd., OMRON Corp., Rockwell Automation Inc., SEMES Co Ltd, Siemens AG, SMC Corp., Synopsys Inc., The PEER Group Inc. and Yaskawa Electric Corp.

Market Research Insights

  • The market is shaped by a strategic push toward proactive operational excellence, where facilities leverage deep learning and advanced analytics to optimize production. This transition facilitates a more than 20% improvement in dynamic routing optimization, directly enhancing equipment utilization rates.
  • Adherence to strict yield optimization targets is now possible through advanced statistical process control, which can increase output consistency by up to 15%. However, the high capital expenditure required for advanced node manufacturing creates a significant barrier to entry.
  • This investment is balanced against the clear benefits of minimizing wafer breakage and unplanned downtime, as facilities deploying these systems report a 30% reduction in production interruptions. The cleanroom environment must be meticulously managed, as even minor deviations impact yield.

We can help! Our analysts can customize this fab automation market research report to meet your requirements.

Get in touch

1. Executive Summary

1.1 Market overview

Executive Summary - Chart on Market Overview
Executive Summary - Data Table on Market Overview
Executive Summary - Chart on Global Market Characteristics
Executive Summary - Chart on Market by Geography
Executive Summary - Chart on Market Segmentation by Component
Executive Summary - Chart on Market Segmentation by Type
Executive Summary - Chart on Market Segmentation by Application
Executive Summary - Chart on Incremental Growth
Executive Summary - Data Table on Incremental Growth
Executive Summary - Chart on Company Market Positioning

2. Technavio Analysis

2.1 Analysis of price sensitivity, lifecycle, customer purchase basket, adoption rates, and purchase criteria

2.2 Criticality of inputs and Factors of differentiation

Chart on Overview on criticality of inputs and factors of differentiation

2.3 Factors of disruption

Chart on Overview on factors of disruption

2.4 Impact of drivers and challenges

Chart on Impact of drivers and challenges in 2025 and 2030

3. Market Landscape

3.1 Market ecosystem

Chart on Parent Market
Data Table on - Parent Market

3.2 Market characteristics

Chart on Market characteristics analysis

3.3 Value chain analysis

Chart on Value chain analysis

4. Market Sizing

4.1 Market definition

Data Table on Offerings of companies included in the market definition

4.2 Market segment analysis

Market segments

4.3 Market size 2025

4.4 Market outlook: Forecast for 2025-2030

Chart on Global - Market size and forecast 2025-2030 ($ million)
Data Table on Global - Market size and forecast 2025-2030 ($ million)
Chart on Global Market: Year-over-year growth 2025-2030 (%)
Data Table on Global Market: Year-over-year growth 2025-2030 (%)

5. Historic Market Size

5.1 Global Fab Automation Market 2020 - 2024

Historic Market Size - Data Table on Global Fab Automation Market 2020 - 2024 ($ million)

5.2 Component segment analysis 2020 - 2024

Historic Market Size - Component Segment 2020 - 2024 ($ million)

5.3 Type segment analysis 2020 - 2024

Historic Market Size - Type Segment 2020 - 2024 ($ million)

5.4 Application segment analysis 2020 - 2024

Historic Market Size - Application Segment 2020 - 2024 ($ million)

5.5 Geography segment analysis 2020 - 2024

Historic Market Size - Geography Segment 2020 - 2024 ($ million)

5.6 Country segment analysis 2020 - 2024

Historic Market Size - Country Segment 2020 - 2024 ($ million)

6. Qualitative Analysis

6.1 Impact of AI on Global Fab automation Market

6.2 Impact of Geopolitical Conflicts on Global Fab Automation Market

7. Five Forces Analysis

7.1 Five forces summary

Five forces analysis - Comparison between 2025 and 2030

7.2 Bargaining power of buyers

Bargaining power of buyers - Impact of key factors 2025 and 2030

7.3 Bargaining power of suppliers

Bargaining power of suppliers - Impact of key factors in 2025 and 2030

7.4 Threat of new entrants

Threat of new entrants - Impact of key factors in 2025 and 2030

7.5 Threat of substitutes

Threat of substitutes - Impact of key factors in 2025 and 2030

7.6 Threat of rivalry

Threat of rivalry - Impact of key factors in 2025 and 2030

7.7 Market condition

Chart on Market condition - Five forces 2025 and 2030

8. Market Segmentation by Component

8.1 Market segments

Chart on Component - Market share 2025-2030 (%)
Data Table on Component - Market share 2025-2030 (%)

8.2 Comparison by Component

Chart on Comparison by Component
Data Table on Comparison by Component

8.3 Hardware - Market size and forecast 2025-2030

Chart on Hardware - Market size and forecast 2025-2030 ($ million)
Data Table on Hardware - Market size and forecast 2025-2030 ($ million)
Chart on Hardware - Year-over-year growth 2025-2030 (%)
Data Table on Hardware - Year-over-year growth 2025-2030 (%)

8.4 Software - Market size and forecast 2025-2030

Chart on Software - Market size and forecast 2025-2030 ($ million)
Data Table on Software - Market size and forecast 2025-2030 ($ million)
Chart on Software - Year-over-year growth 2025-2030 (%)
Data Table on Software - Year-over-year growth 2025-2030 (%)

8.5 Services - Market size and forecast 2025-2030

Chart on Services - Market size and forecast 2025-2030 ($ million)
Data Table on Services - Market size and forecast 2025-2030 ($ million)
Chart on Services - Year-over-year growth 2025-2030 (%)
Data Table on Services - Year-over-year growth 2025-2030 (%)

8.6 Market opportunity by Component

Market opportunity by Component ($ million)
Data Table on Market opportunity by Component ($ million)

9. Market Segmentation by Type

9.1 Market segments

Chart on Type - Market share 2025-2030 (%)
Data Table on Type - Market share 2025-2030 (%)

9.2 Comparison by Type

Chart on Comparison by Type
Data Table on Comparison by Type

9.3 Greenfield fab - Market size and forecast 2025-2030

Chart on Greenfield fab - Market size and forecast 2025-2030 ($ million)
Data Table on Greenfield fab - Market size and forecast 2025-2030 ($ million)
Chart on Greenfield fab - Year-over-year growth 2025-2030 (%)
Data Table on Greenfield fab - Year-over-year growth 2025-2030 (%)

9.4 Brownfield fab - Market size and forecast 2025-2030

Chart on Brownfield fab - Market size and forecast 2025-2030 ($ million)
Data Table on Brownfield fab - Market size and forecast 2025-2030 ($ million)
Chart on Brownfield fab - Year-over-year growth 2025-2030 (%)
Data Table on Brownfield fab - Year-over-year growth 2025-2030 (%)

9.5 Market opportunity by Type

Market opportunity by Type ($ million)
Data Table on Market opportunity by Type ($ million)

10. Market Segmentation by Application

10.1 Market segments

Chart on Application - Market share 2025-2030 (%)
Data Table on Application - Market share 2025-2030 (%)

10.2 Comparison by Application

Chart on Comparison by Application
Data Table on Comparison by Application

10.3 Equipment automation - Market size and forecast 2025-2030

Chart on Equipment automation - Market size and forecast 2025-2030 ($ million)
Data Table on Equipment automation - Market size and forecast 2025-2030 ($ million)
Chart on Equipment automation - Year-over-year growth 2025-2030 (%)
Data Table on Equipment automation - Year-over-year growth 2025-2030 (%)

10.4 Material handling automation - Market size and forecast 2025-2030

Chart on Material handling automation - Market size and forecast 2025-2030 ($ million)
Data Table on Material handling automation - Market size and forecast 2025-2030 ($ million)
Chart on Material handling automation - Year-over-year growth 2025-2030 (%)
Data Table on Material handling automation - Year-over-year growth 2025-2030 (%)

10.5 Process automation - Market size and forecast 2025-2030

Chart on Process automation - Market size and forecast 2025-2030 ($ million)
Data Table on Process automation - Market size and forecast 2025-2030 ($ million)
Chart on Process automation - Year-over-year growth 2025-2030 (%)
Data Table on Process automation - Year-over-year growth 2025-2030 (%)

10.6 Market opportunity by Application

Market opportunity by Application ($ million)
Data Table on Market opportunity by Application ($ million)

11. Customer Landscape

11.1 Customer landscape overview

Analysis of price sensitivity, lifecycle, customer purchase basket, adoption rates, and purchase criteria

12. Geographic Landscape

12.1 Geographic segmentation

Chart on Market share by geography 2025-2030 (%)
Data Table on Market share by geography 2025-2030 (%)

12.2 Geographic comparison

Chart on Geographic comparison
Data Table on Geographic comparison

12.3 APAC - Market size and forecast 2025-2030

Chart on APAC - Market size and forecast 2025-2030 ($ million)
Data Table on APAC - Market size and forecast 2025-2030 ($ million)
Chart on APAC - Year-over-year growth 2025-2030 (%)
Data Table on APAC - Year-over-year growth 2025-2030 (%)
Chart on Regional Comparison - APAC
Data Table on Regional Comparison - APAC

12.3.1 China - Market size and forecast 2025-2030

Chart on China - Market size and forecast 2025-2030 ($ million)
Data Table on China - Market size and forecast 2025-2030 ($ million)
Chart on China - Year-over-year growth 2025-2030 (%)
Data Table on China - Year-over-year growth 2025-2030 (%)

12.3.2 South Korea - Market size and forecast 2025-2030

Chart on South Korea - Market size and forecast 2025-2030 ($ million)
Data Table on South Korea - Market size and forecast 2025-2030 ($ million)
Chart on South Korea - Year-over-year growth 2025-2030 (%)
Data Table on South Korea - Year-over-year growth 2025-2030 (%)

12.3.3 Japan - Market size and forecast 2025-2030

Chart on Japan - Market size and forecast 2025-2030 ($ million)
Data Table on Japan - Market size and forecast 2025-2030 ($ million)
Chart on Japan - Year-over-year growth 2025-2030 (%)
Data Table on Japan - Year-over-year growth 2025-2030 (%)

12.3.4 India - Market size and forecast 2025-2030

Chart on India - Market size and forecast 2025-2030 ($ million)
Data Table on India - Market size and forecast 2025-2030 ($ million)
Chart on India - Year-over-year growth 2025-2030 (%)
Data Table on India - Year-over-year growth 2025-2030 (%)

12.3.5 Australia - Market size and forecast 2025-2030

Chart on Australia - Market size and forecast 2025-2030 ($ million)
Data Table on Australia - Market size and forecast 2025-2030 ($ million)
Chart on Australia - Year-over-year growth 2025-2030 (%)
Data Table on Australia - Year-over-year growth 2025-2030 (%)

12.3.6 Indonesia - Market size and forecast 2025-2030

Chart on Indonesia - Market size and forecast 2025-2030 ($ million)
Data Table on Indonesia - Market size and forecast 2025-2030 ($ million)
Chart on Indonesia - Year-over-year growth 2025-2030 (%)
Data Table on Indonesia - Year-over-year growth 2025-2030 (%)

12.4 North America - Market size and forecast 2025-2030

Chart on North America - Market size and forecast 2025-2030 ($ million)
Data Table on North America - Market size and forecast 2025-2030 ($ million)
Chart on North America - Year-over-year growth 2025-2030 (%)
Data Table on North America - Year-over-year growth 2025-2030 (%)
Chart on Regional Comparison - North America
Data Table on Regional Comparison - North America

12.4.1 US - Market size and forecast 2025-2030

Chart on US - Market size and forecast 2025-2030 ($ million)
Data Table on US - Market size and forecast 2025-2030 ($ million)
Chart on US - Year-over-year growth 2025-2030 (%)
Data Table on US - Year-over-year growth 2025-2030 (%)

12.4.2 Mexico - Market size and forecast 2025-2030

Chart on Mexico - Market size and forecast 2025-2030 ($ million)
Data Table on Mexico - Market size and forecast 2025-2030 ($ million)
Chart on Mexico - Year-over-year growth 2025-2030 (%)
Data Table on Mexico - Year-over-year growth 2025-2030 (%)

12.4.3 Canada - Market size and forecast 2025-2030

Chart on Canada - Market size and forecast 2025-2030 ($ million)
Data Table on Canada - Market size and forecast 2025-2030 ($ million)
Chart on Canada - Year-over-year growth 2025-2030 (%)
Data Table on Canada - Year-over-year growth 2025-2030 (%)

12.5 Europe - Market size and forecast 2025-2030

Chart on Europe - Market size and forecast 2025-2030 ($ million)
Data Table on Europe - Market size and forecast 2025-2030 ($ million)
Chart on Europe - Year-over-year growth 2025-2030 (%)
Data Table on Europe - Year-over-year growth 2025-2030 (%)
Chart on Regional Comparison - Europe
Data Table on Regional Comparison - Europe

12.5.1 Germany - Market size and forecast 2025-2030

Chart on Germany - Market size and forecast 2025-2030 ($ million)
Data Table on Germany - Market size and forecast 2025-2030 ($ million)
Chart on Germany - Year-over-year growth 2025-2030 (%)
Data Table on Germany - Year-over-year growth 2025-2030 (%)

12.5.2 The Netherlands - Market size and forecast 2025-2030

Chart on The Netherlands - Market size and forecast 2025-2030 ($ million)
Data Table on The Netherlands - Market size and forecast 2025-2030 ($ million)
Chart on The Netherlands - Year-over-year growth 2025-2030 (%)
Data Table on The Netherlands - Year-over-year growth 2025-2030 (%)

12.5.3 France - Market size and forecast 2025-2030

Chart on France - Market size and forecast 2025-2030 ($ million)
Data Table on France - Market size and forecast 2025-2030 ($ million)
Chart on France - Year-over-year growth 2025-2030 (%)
Data Table on France - Year-over-year growth 2025-2030 (%)

12.5.4 UK - Market size and forecast 2025-2030

Chart on UK - Market size and forecast 2025-2030 ($ million)
Data Table on UK - Market size and forecast 2025-2030 ($ million)
Chart on UK - Year-over-year growth 2025-2030 (%)
Data Table on UK - Year-over-year growth 2025-2030 (%)

12.5.5 Italy - Market size and forecast 2025-2030

Chart on Italy - Market size and forecast 2025-2030 ($ million)
Data Table on Italy - Market size and forecast 2025-2030 ($ million)
Chart on Italy - Year-over-year growth 2025-2030 (%)
Data Table on Italy - Year-over-year growth 2025-2030 (%)

12.5.6 Spain - Market size and forecast 2025-2030

Chart on Spain - Market size and forecast 2025-2030 ($ million)
Data Table on Spain - Market size and forecast 2025-2030 ($ million)
Chart on Spain - Year-over-year growth 2025-2030 (%)
Data Table on Spain - Year-over-year growth 2025-2030 (%)

12.6 Middle East and Africa - Market size and forecast 2025-2030

Chart on Middle East and Africa - Market size and forecast 2025-2030 ($ million)
Data Table on Middle East and Africa - Market size and forecast 2025-2030 ($ million)
Chart on Middle East and Africa - Year-over-year growth 2025-2030 (%)
Data Table on Middle East and Africa - Year-over-year growth 2025-2030 (%)
Chart on Regional Comparison - Middle East and Africa
Data Table on Regional Comparison - Middle East and Africa

12.6.1 Israel - Market size and forecast 2025-2030

Chart on Israel - Market size and forecast 2025-2030 ($ million)
Data Table on Israel - Market size and forecast 2025-2030 ($ million)
Chart on Israel - Year-over-year growth 2025-2030 (%)
Data Table on Israel - Year-over-year growth 2025-2030 (%)

12.6.2 UAE - Market size and forecast 2025-2030

Chart on UAE - Market size and forecast 2025-2030 ($ million)
Data Table on UAE - Market size and forecast 2025-2030 ($ million)
Chart on UAE - Year-over-year growth 2025-2030 (%)
Data Table on UAE - Year-over-year growth 2025-2030 (%)

12.6.3 Saudi Arabia - Market size and forecast 2025-2030

Chart on Saudi Arabia - Market size and forecast 2025-2030 ($ million)
Data Table on Saudi Arabia - Market size and forecast 2025-2030 ($ million)
Chart on Saudi Arabia - Year-over-year growth 2025-2030 (%)
Data Table on Saudi Arabia - Year-over-year growth 2025-2030 (%)

12.6.4 South Africa - Market size and forecast 2025-2030

Chart on South Africa - Market size and forecast 2025-2030 ($ million)
Data Table on South Africa - Market size and forecast 2025-2030 ($ million)
Chart on South Africa - Year-over-year growth 2025-2030 (%)
Data Table on South Africa - Year-over-year growth 2025-2030 (%)

12.6.5 Turkey - Market size and forecast 2025-2030

Chart on Turkey - Market size and forecast 2025-2030 ($ million)
Data Table on Turkey - Market size and forecast 2025-2030 ($ million)
Chart on Turkey - Year-over-year growth 2025-2030 (%)
Data Table on Turkey - Year-over-year growth 2025-2030 (%)

12.7 South America - Market size and forecast 2025-2030

Chart on South America - Market size and forecast 2025-2030 ($ million)
Data Table on South America - Market size and forecast 2025-2030 ($ million)
Chart on South America - Year-over-year growth 2025-2030 (%)
Data Table on South America - Year-over-year growth 2025-2030 (%)
Chart on Regional Comparison - South America
Data Table on Regional Comparison - South America

12.7.1 Brazil - Market size and forecast 2025-2030

Chart on Brazil - Market size and forecast 2025-2030 ($ million)
Data Table on Brazil - Market size and forecast 2025-2030 ($ million)
Chart on Brazil - Year-over-year growth 2025-2030 (%)
Data Table on Brazil - Year-over-year growth 2025-2030 (%)

12.7.2 Argentina - Market size and forecast 2025-2030

Chart on Argentina - Market size and forecast 2025-2030 ($ million)
Data Table on Argentina - Market size and forecast 2025-2030 ($ million)
Chart on Argentina - Year-over-year growth 2025-2030 (%)
Data Table on Argentina - Year-over-year growth 2025-2030 (%)

12.7.3 Colombia - Market size and forecast 2025-2030

Chart on Colombia - Market size and forecast 2025-2030 ($ million)
Data Table on Colombia - Market size and forecast 2025-2030 ($ million)
Chart on Colombia - Year-over-year growth 2025-2030 (%)
Data Table on Colombia - Year-over-year growth 2025-2030 (%)

12.8 Market opportunity by geography

Market opportunity by geography ($ million)
Data Tables on Market opportunity by geography ($ million)

13. Drivers, Challenges, and Opportunity

13.1 Market drivers

Increasing demand for semiconductor miniaturization and high volume manufacturing
Government initiatives and subsidies for domestic semiconductor supply chains
Advancements in AI and machine learning integration

13.2 Market challenges

High initial capital investment and prolonged return on investment
Complexity of integrating legacy systems with modern automation protocols
Severe shortage of skilled workforce for advanced automation maintenance

13.3 Impact of drivers and challenges

Impact of drivers and challenges in 2025 and 2030

13.4 Market opportunities

Integration of advanced cybersecurity frameworks
Deployment of comprehensive automated material handling systems
Shift toward sustainable manufacturing and energy efficiency

14. Competitive Landscape

14.1 Overview

14.2

Overview on criticality of inputs and factors of differentiation

14.3 Landscape disruption

Overview on factors of disruption

14.4 Industry risks

Impact of key risks on business

15. Competitive Analysis

15.1 Companies profiled

Companies covered

15.2 Company ranking index

15.3 Market positioning of companies

Matrix on companies position and classification

15.4 Advantech Co. Ltd.

Advantech Co. Ltd. - Overview
Advantech Co. Ltd. - Business segments
Advantech Co. Ltd. - Key offerings
Advantech Co. Ltd. - Segment focus
SWOT

15.5 Applied Materials Inc.

Applied Materials Inc. - Overview
Applied Materials Inc. - Business segments
Applied Materials Inc. - Key offerings
Applied Materials Inc. - Segment focus
SWOT

15.6 Brooks Automation Inc.

Brooks Automation Inc. - Overview
Brooks Automation Inc. - Product / Service
Brooks Automation Inc. - Key offerings
SWOT

15.7 Critical Manufacturing SA

Critical Manufacturing SA - Overview
Critical Manufacturing SA - Product / Service
Critical Manufacturing SA - Key offerings
SWOT

15.8 Daifuku Co. Ltd.

Daifuku Co. Ltd. - Overview
Daifuku Co. Ltd. - Product / Service
Daifuku Co. Ltd. - Key offerings
SWOT

15.9 FANUC Corp.

FANUC Corp. - Overview
FANUC Corp. - Business segments
FANUC Corp. - Key offerings
FANUC Corp. - Segment focus
SWOT

15.10 Festo SE and Co. KG

Festo SE and Co. KG - Overview
Festo SE and Co. KG - Product / Service
Festo SE and Co. KG - Key offerings
SWOT

15.11 KUKA AG

KUKA AG - Overview
KUKA AG - Product / Service
KUKA AG - Key offerings
SWOT

15.12 Murata Machinery Ltd.

Murata Machinery Ltd. - Overview
Murata Machinery Ltd. - Product / Service
Murata Machinery Ltd. - Key offerings
SWOT

15.13 Rockwell Automation Inc.

Rockwell Automation Inc. - Overview
Rockwell Automation Inc. - Business segments
Rockwell Automation Inc. - Key news
Rockwell Automation Inc. - Key offerings
Rockwell Automation Inc. - Segment focus
SWOT

15.14 SEMES Co Ltd

SEMES Co Ltd - Overview
SEMES Co Ltd - Product / Service
SEMES Co Ltd - Key offerings
SWOT

15.15 Siemens AG

Siemens AG - Overview
Siemens AG - Business segments
Siemens AG - Key news
Siemens AG - Key offerings
Siemens AG - Segment focus
SWOT

15.16 SMC Corp.

SMC Corp. - Overview
SMC Corp. - Product / Service
SMC Corp. - Key offerings
SWOT

15.17 The PEER Group Inc.

The PEER Group Inc. - Overview
The PEER Group Inc. - Product / Service
The PEER Group Inc. - Key offerings
SWOT

15.18 Yaskawa Electric Corp.

Yaskawa Electric Corp. - Overview
Yaskawa Electric Corp. - Business segments
Yaskawa Electric Corp. - Key offerings
Yaskawa Electric Corp. - Segment focus
SWOT

16. Appendix

16.1 Scope of the report

Market definition
Objectives
Notes and caveats

16.2 Inclusions and exclusions checklist

Inclusions checklist
Exclusions checklist

16.3 Currency conversion rates for US$

16.4 Research methodology

16.5 Data procurement

Information sources

16.6 Data validation

16.7 Validation techniques employed for market sizing

16.8 Data synthesis

16.9 360 degree market analysis

16.10 List of abbreviations

Research Methodology

Technavio presents a detailed picture of the market by way of study, synthesis, and summation of data from multiple sources. The analysts have presented the various facets of the market with a particular focus on identifying the key industry influencers. The data thus presented is comprehensive, reliable, and the result of extensive research, both primary and secondary.

INFORMATION SOURCES

Primary sources

  • Manufacturers and suppliers
  • Channel partners
  • Industry experts
  • Strategic decision makers

Secondary sources

  • Industry journals and periodicals
  • Government data
  • Financial reports of key industry players
  • Historical data
  • Press releases

DATA ANALYSIS

Data Synthesis

  • Collation of data
  • Estimation of key figures
  • Analysis of derived insights

Data Validation

  • Triangulation with data models
  • Reference against proprietary databases
  • Corroboration with industry experts

REPORT WRITING

Qualitative

  • Market drivers
  • Market challenges
  • Market trends
  • Five forces analysis

Quantitative

  • Market size and forecast
  • Market segmentation
  • Geographical insights
  • Competitive landscape

Interested in this report?

Get your sample now to see our research methodology and insights!

Download Now

Frequently Asked Questions

Fab Automation market growth will increase by USD 10333.8 million during 2026-2030.

The Fab Automation market is expected to grow at a CAGR of 7.1% during 2026-2030.

Fab Automation market is segmented by Component (Hardware, Software, Services) Type (Greenfield fab, Brownfield fab) Application (Equipment automation, Material handling automation, Process automation)

Advantech Co. Ltd., Applied Materials Inc., Bosch Rexroth AG, Brooks Automation Inc., Critical Manufacturing SA, Daifuku Co. Ltd., FANUC Corp., Festo SE and Co. KG, Kensington Laboratories LLC, KUKA AG, Mitsubishi Electric Corp., Murata Machinery Ltd., OMRON Corp., Rockwell Automation Inc., SEMES Co Ltd, Siemens AG, SMC Corp., Synopsys Inc., The PEER Group Inc., Yaskawa Electric Corp. are a few of the key vendors in the Fab Automation market.

APAC will register the highest growth rate of 47.7% among the other regions. Therefore, the Fab Automation market in APAC is expected to garner significant business opportunities for the vendors during the forecast period.

China, South Korea, Japan, India, Australia, Indonesia, US, Mexico, Canada, Germany, The Netherlands, France, UK, Italy, Spain, Israel, UAE, Saudi Arabia, South Africa, Turkey, Brazil, Argentina, Colombia

  • Increasing demand for semiconductor miniaturization and high volume manufacturing is the driving factor this market.

The Fab Automation market vendors should focus on grabbing business opportunities from the Component segment as it accounted for the largest market share in the base year.
RIA - Research AI Assistant
Ask RIA