
Fabry Disease Drugs Market Size 2024-2028
The fabry disease drugs market size is forecast to increase by USD 859.06 million at a CAGR of 7.43% between 2023 and 2028.
- The Fabry disease market is driven by the increasing incidence of rare heart-related diseases, particularly among men, leading to organ damage and premature death. The condition, characterized by clinical symptoms such as chronic pain, gastrointestinal problems, and cardiac involvement, is commonly associated with type 1 classic Fabry disease. The market is witnessing significant trends, including the focus on developing chaperone therapies to replace the missing or defective enzyme in Fabry disease patients.
- Strategic alliances and partnerships among market players are also on the rise to accelerate research and development efforts. However, stringent regulatory guidelines pose a challenge to market growth, requiring extensive clinical trials and rigorous testing to ensure safety and efficacy. This market analysis report provides an in-depth examination of these trends and challenges, offering valuable insights for stakeholders in the market.
What will be the Size of the Market During the Forecast Period?

- Fabry disease, a rare genetic condition, is characterized by deficient alpha-galactosidase A enzyme activity, leading to the accumulation of globotriaosylceramide and globotriaosylsphingosine in various organs. This metabolic disorder results in systemic signs and metabolic abnormalities, primarily affecting the heart, kidneys, and nervous system. Medical professionals play a pivotal role in diagnosing and managing Fabry disease. Early identification is crucial to prevent organ-related problems and premature death. The treatment landscape for Fabry disease includes two primary therapeutic approaches: enzyme replacement therapy (ERT) and gene therapy. ERT involves the administration of recombinant alpha-galactosidase A enzyme to replace the deficient enzyme in the body.
- Moreover, this therapy can be delivered via both intravenous and oral routes. Intravenous ERT is the most commonly used treatment, while oral chaperone therapy is an emerging alternative. The oral route offers several advantages, including improved patient compliance and reduced hospital visits. Hospital pharmacies, retail pharmacies, and online pharmacies are essential channels for distributing Fabry disease drugs. Healthcare staff must ensure proper handling, storage, and administration of these medications to ensure optimal patient outcomes. The immune system plays a complex role in Fabry disease. The disease can lead to an overactive immune response, contributing to clinical symptoms and organ failures.
- Also, clinical trials are ongoing to explore new treatment options that address the immune system's role in Fabry disease. Fabry disease affects both men and women, with Type 1 classic being the most common form. The primary clinical symptoms include heart problems, gastrointestinal issues, and neurological symptoms. Early intervention is crucial to prevent complications and improve patient outcomes. Sphingolipid metabolism plays a significant role in Fabry disease. Understanding the underlying biochemical processes can help in developing novel therapeutic strategies. Researchers are exploring gene therapy as a potential solution for Fabry disease, offering the possibility of a cure.
- In conclusion, the market is driven by the growing need to address the unmet medical needs of patients with this rare genetic condition. The market is characterized by ongoing research and development efforts, a growing awareness of the disease, and a focus on improving patient outcomes through innovative therapeutic approaches.
How is this market segmented and which is the largest segment?
The market research report provides comprehensive data (region-wise segment analysis), with forecasts and estimates in "USD million" for the period 2024-2028, as well as historical data from 2018-2022 for the following segments.
- Distribution Channel
- Hospital pharmacies
- Retail pharmacies
- Online pharmacies
- Route Of Administration
- Intravenous route
- Oral route
- Geography
- North America
- US
- Europe
- Germany
- UK
- Asia
- China
- Japan
- Rest of World (ROW)
- North America
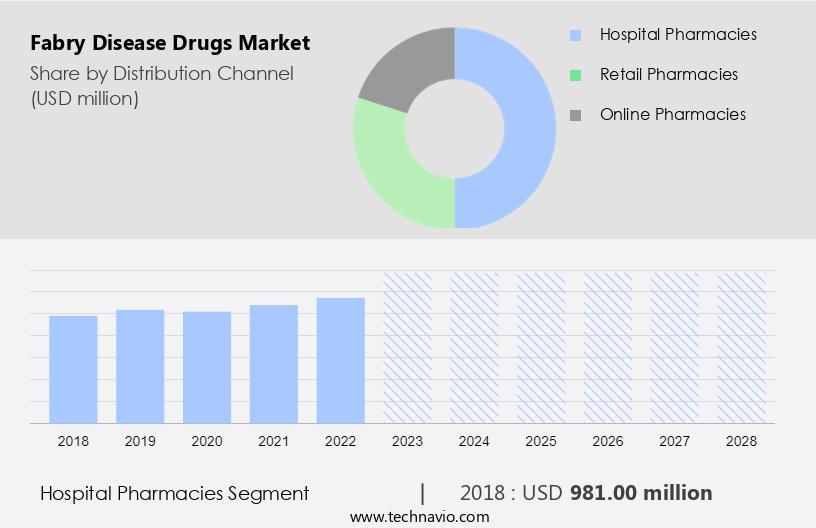
By Distribution Channel Insights
- The hospital pharmacies segment is estimated to witness significant growth during the forecast period.
In the realm of healthcare, hospital pharmacies play a pivotal role in procuring, storing, and dispensing medications for the treatment of various conditions, including rare genetic diseases such as Fabry disease. Fabry disease is characterized by a deficiency of the enzyme human alpha-galactosidase A, leading to the accumulation of glycosphingolipids in various organs, resulting in Fabry disease-induced complications. Pharmaceutical companies offer treatments for Fabry disease, including Galafold, a chaperone therapy, and oral drugs. Hospital pharmacies serve as crucial intermediaries in making these treatments accessible to patients. The hospital setting allows for the administration of injectables, while oral routes offer convenience and potential cost savings through telemedicine and homecare settings.
According to market research, the hospital pharmacies segment dominated The market in 2023, accounting for the largest market share by distribution channel. This trend is expected to continue during the forecast period. The dominance of hospital pharmacies can be attributed to their ability to provide easy access to specialized treatments, ensuring timely and effective care for patients with Fabry disease. In conclusion, hospital pharmacies serve as essential partners in the healthcare ecosystem, facilitating the procurement, storage, and distribution of Fabry disease drugs. Their role in providing access to these essential treatments in a hospital setting, as well as through telemedicine and homecare, underscores their importance in addressing the unique needs of patients with Fabry disease.
Get a glance at the market report of share of various segments Request Free Sample
The hospital pharmacies segment was valued at USD 981.00 million in 2018 and showed a gradual increase during the forecast period.
Regional Analysis
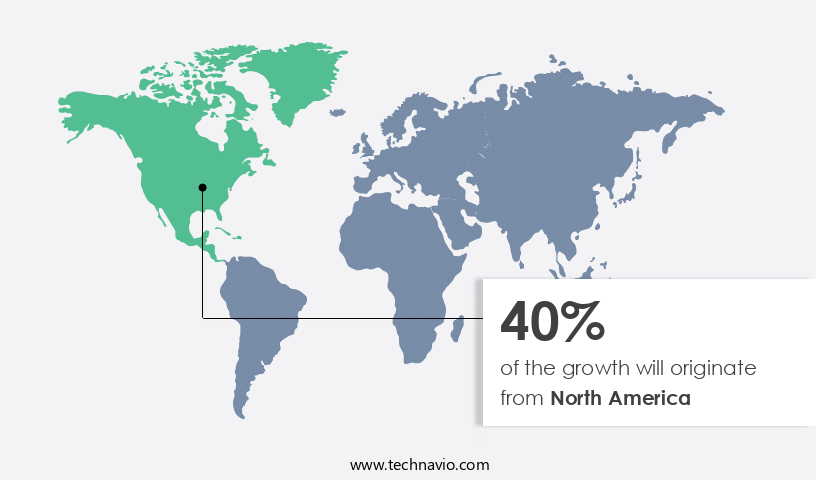
- North America is estimated to contribute 40% to the growth of the global market during the forecast period.
Technavio's analysts have elaborately explained the regional trends and drivers that shape the market during the forecast period.
For more insights on the market share of various regions Request Free Sample
In North America, the Fabry disease market has experienced significant growth due to several factors. New drug trials for Fabry disease, the increasing diagnosis of rare genetic diseases, and the availability of reimbursement schemes are key drivers of market expansion. The high cost of Fabry disease treatments, the presence of major pharmaceutical companies, and government incentives and support are additional factors contributing to market growth. For example, in May 2023, the US Food and Drug Administration (FDA) approved pegunigalsidase alfa-iwi (ELFABRIO) for adults with Fabry disease, marking a significant milestone in the treatment of this genetic condition. The Fabry disease market in North America is expected to continue growing due to these factors and the ongoing research and development in gene therapy and enzyme replacement therapy for sphingolipid metabolism disorders.
Market Dynamics
Our researchers analyzed the data with 2023 as the base year, along with the key drivers, trends, and challenges. A holistic analysis of drivers will help companies refine their marketing strategies to gain a competitive advantage.
What are the key market drivers leading to the rise in adoption of Fabry Disease Drugs Market?
The rising incidence of rare diseases is the key driver of the market.
- Fabry disease is a rare genetic disorder affecting approximately 1 in 40,000 to 60,000 individuals in the US. This X-linked disease primarily affects men and is characterized by systemic signs and metabolic abnormalities due to deficiency in the enzyme alpha-galactosidase A, which plays a crucial role in sphingolipid metabolism. The disease can lead to organ failures and premature death, with heart problems being a common complication. Medical professionals play a vital role in diagnosing and treating Fabry disease. Treatment options include enzyme replacement therapy (ERT) using Fabrazyme (agalsidase beta) or Agalsidase Alfa, gene therapy, and novel therapies such as oral chaperone therapy with Galafold.
- Also, ERT involves the administration of exogenous replacement of the missing enzyme, while gene therapies aim to correct the underlying genetic defect. The market is witnessing significant growth due to the increasing number of diagnosed cases and the development of new therapies. Oral medications like Venglustat are under clinical trials for Fabry disease treatment. Chaperone therapy, such as Galafold, is a promising new approach that enhances the activity of the deficient enzyme in the body. Patients can access Fabry disease drugs through various channels, including hospital pharmacies, retail pharmacies, and online pharmacies. Reimbursement policies vary, and healthcare facilities work closely with insurance providers to ensure patient readiness for treatment.
- Moreover, Fabry disease-induced complications can impact various physiological systems, including the cardiac system, urinary system, and central nervous system. Biomarkers are essential for monitoring disease progression and treatment efficacy. Telemedicine and homecare settings are increasingly being used to improve patient access to care and reduce the burden of frequent hospital visits. The immune system plays a role in disease progression, and ongoing clinical trials explore the potential of immunomodulatory therapies. The market for Fabry disease drugs is expected to grow as new therapies enter the market and reimbursement policies become more favorable. The GLA gene mutation causes Fabry disease, and early diagnosis and treatment are crucial for preventing organ damage and improving life expectancies. The market for Fabry disease drugs is dynamic, with ongoing research and development efforts to address the unmet needs of patients.
What are the market trends shaping the Fabry Disease Drugs Market?
Focus on strategic alliances and partnerships is the upcoming trend in the market.
- The market has experienced significant growth due to collaborations and strategic alliances among medical professionals, patients' organizations, and pharmaceutical companies. These partnerships enable companies to expand their reach, enhance product offerings, and increase revenue through co-developed and co-marketed drugs. For example, in February 2023, Chiesi Farmaceutici SpA and Protalix BioTherapeutics joined forces to deliver innovative therapies for rare diseases, including Fabry disease. Fabry disease is a rare genetic disorder characterized by systemic signs and metabolic abnormalities caused by deficiency in the enzyme alpha-galactosidase A, which affects sphingolipid metabolism. This deficiency leads to the accumulation of fatty molecules, such as globotriaosylceramide, in various physiological systems, including the heart, kidneys, skin, and central nervous system.
- Furthermore, fabry disease can result in organ failures and premature death due to heart problems and organ-related complications. To address Fabry disease-induced complications, various therapies, such as enzyme replacement therapy (ERT) and gene therapy, are being developed. ERT involves the administration of exogenous replacement of the missing enzyme, while gene therapy aims to correct the underlying genetic defect. Novel therapies, such as oral chaperone therapy, are also being explored to improve patient readiness and compliance. The market is segmented based on the route of administration, including oral and intravenous. Oral medications, such as Galafold, are gaining popularity due to their convenience and ease of administration.
- On the other hand, intravenous therapies, such as Fabrazyme, Agalsidase Beta, and Agalsidase Alfa, are commonly used for severe Fabry disease cases. Healthcare facilities, including hospital pharmacies, retail pharmacies, and online pharmacies, play a crucial role in the distribution and availability of Fabry disease drugs. Reimbursement policies and healthcare staff training are essential factors influencing the market's growth. The immune system's response to these therapies and clinical trials' success are significant factors driving the market's progression.
- In conclusion, the market is expected to grow due to collaborations, the development of novel therapies, and the increasing demand for effective treatments for rare genetic disorders. The market's growth is influenced by factors such as healthcare facilities' role, reimbursement policies, and clinical trial outcomes. The ongoing research and development efforts in the field of Fabry disease therapies will continue to drive market growth during the forecast period.
What challenges does Fabry Disease Drugs Market face during the growth?
Stringent regulatory guidelines is a key challenge affecting the market growth.
- Fabry disease, a rare genetic disorder affecting approximately 1 in 40,000 to 60,000 individuals in the US, is characterized by a deficiency in the lysosomal enzyme alpha-galactosidase A, leading to the accumulation of fatty molecules called globotriaosylceramide and psychosine. This accumulation results in systemic signs and metabolic abnormalities, including organ damage and premature death, particularly affecting the heart, kidneys, skin, and central nervous system. Medical professionals are actively seeking effective treatments for this genetic disease, which primarily includes gene therapy and enzyme replacement therapy. Novel therapies, such as gene therapies, are under investigation to address the root cause of Fabry disease.
- These therapies aim to introduce a functional copy of the defective GLA gene into the patient's cells, enabling the production of normal alpha-galactosidase A. On the other hand, enzyme replacement therapies, such as Fabrazyme and Agalsidase Alfa, provide patients with exogenous replacement of the missing enzyme. Patients with Fabry disease experience clinical symptoms varying from type 1 classic, which manifests early in life, to late-onset Fabry disease. The progression of the disease can lead to organ-related problems, including heart problems and chronic kidney disease. Biomarkers play a crucial role in monitoring disease progression and patient readiness for treatment. Healthcare facilities, including hospital pharmacies, retail pharmacies, and online pharmacies, play a significant role in the distribution and administration of Fabry disease drugs.
- However, reimbursement policies and healthcare staff training are essential considerations for the successful implementation of these treatments. The immune system also plays a role in Fabry disease, as the development of antibodies against the administered enzyme can impact treatment efficacy. Ongoing clinical trials are evaluating new therapies, such as oral chaperone therapy and Venglustat, to address these challenges. In summary, the Fabry disease market is characterized by the development of novel therapies, including gene therapies and enzyme replacement therapies, to address the underlying genetic cause of the disease and improve patient outcomes. The successful implementation of these treatments requires collaboration between medical professionals, healthcare facilities, and regulatory agencies to ensure patient access and optimal care.
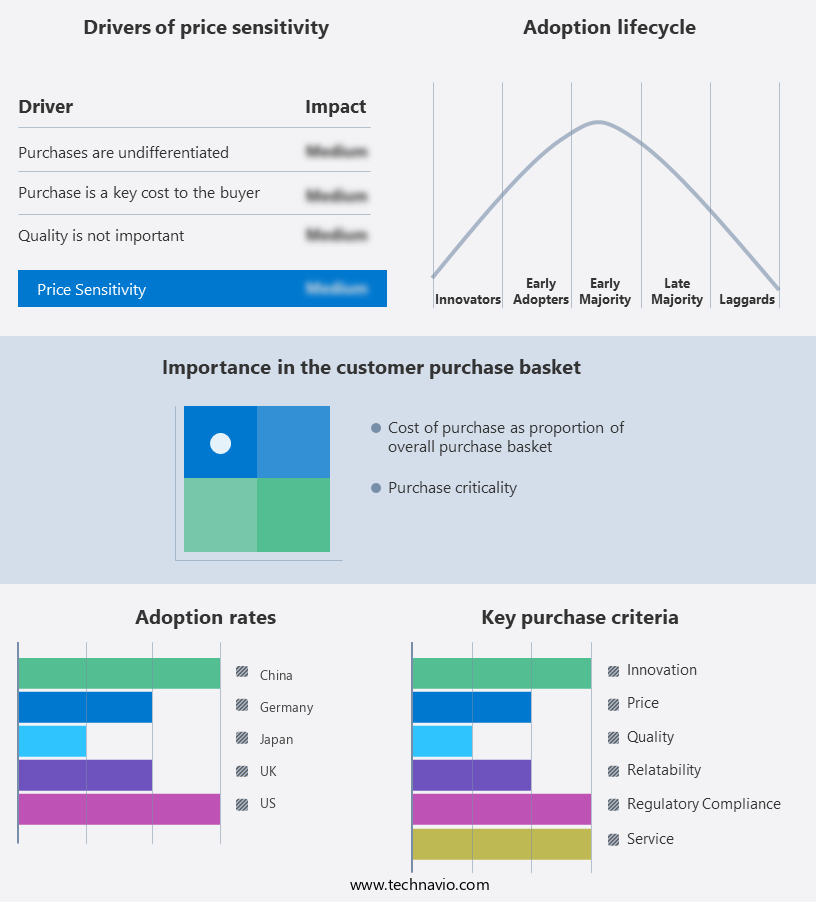
Exclusive Customer Landscape
The market forecasting report includes the adoption lifecycle of the market, covering from the innovator's stage to the laggard's stage. It focuses on adoption rates in different regions based on penetration. Furthermore, the market report also includes key purchase criteria and drivers of price sensitivity to help companies evaluate and develop their market growth analysis strategies.
Customer Landscape
Key Companies & Market Insights
Companies are implementing various strategies, such as strategic alliances, market forecast, partnerships, mergers and acquisitions, geographical expansion, and product/service launches, to enhance their presence in the market.
The market research and growth report includes detailed analyses of the competitive landscape of the market and information about key companies, including:
- 4D Molecular Therapeutics Inc.
- Amicus Therapeutics Inc.
- CHIESI Farmaceutici SpA
- Freeline Therapeutics Holdings plc
- Idorsia Pharmaceuticals Ltd.
- Sangamo Therapeutics Inc.
- Sanofi SA
- Takeda Pharmaceutical Co. Ltd.
Qualitative and quantitative analysis of companies has been conducted to help clients understand the wider business environment as well as the strengths and weaknesses of key market players. Data is qualitatively analyzed to categorize companies as pure play, category-focused, industry-focused, and diversified; it is quantitatively analyzed to categorize companies as dominant, leading, strong, tentative, and weak.
Research Analyst Overview
Fabry disease is a rare genetic disorder affecting both men and women, causing systemic signs and metabolic abnormalities due to deficiencies in alpha-galactosidase A, a crucial enzyme for sphingolipid metabolism. This deficiency leads to the accumulation of fatty molecules, such as globotriaosylceramide, in various physiological systems, including the cardiac and urinary systems. Medical professionals and patients seek advanced therapies to manage Fabry disease, including gene therapy and enzyme replacement therapy. These novel therapies aim to replace the missing or defective enzyme and alleviate disease progression, organ-related problems, and premature death. Biomarkers play a significant role in diagnosing and monitoring Fabry disease, helping to determine patient readiness for targeted disease treatment.
Oral medication, chaperone therapy, and antibody development are among the available treatment options. Hospital pharmacies, retail pharmacies, and online pharmacies provide access to essential medications, while healthcare facilities and reimbursement policies ensure affordability. The immune system's role in Fabry disease is an active area of research, with clinical trials exploring new therapies like venglustat and chaperone therapy. Fabry disease can lead to organ damage, heart problems, and chronic kidney disease, among other complications. Telemedicine and homecare settings offer valuable solutions for managing the disease in various stages, from late-onset to type 1 classic. In the context of Fabry disease, gene therapies and oral chaperone therapy are promising approaches to address the underlying genetic cause and improve life expectancies. The healthcare community continues to work towards developing effective treatments and optimizing care for affected individuals.
|
Market Scope |
|
|
Report Coverage |
Details |
|
Page number |
149 |
|
Base year |
2023 |
|
Historic period |
2018-2022 |
|
Forecast period |
2024-2028 |
|
Growth momentum & CAGR |
Accelerate at a CAGR of 7.43% |
|
Market growth 2024-2028 |
USD 859.06 million |
|
Market structure |
Concentrated |
|
YoY growth 2023-2024(%) |
6.83 |
|
Key countries |
US, Germany, UK, China, and Japan |
|
Competitive landscape |
Leading Companies, Market Positioning of Companies, Competitive Strategies, and Industry Risks |
What are the Key Data Covered in this Market Research and Growth Report?
- CAGR of the market during the forecast period
- Detailed information on factors that will drive the market growth and forecasting between 2024 and 2028
- Precise estimation of the size of the market and its contribution of the market in focus to the parent market
- Accurate predictions about upcoming market growth and trends and changes in consumer behaviour
- Growth of the market across North America, Europe, Asia, and Rest of World (ROW)
- Thorough analysis of the market's competitive landscape and detailed information about companies
- Comprehensive analysis of factors that will challenge the growth of market companies
We can help! Our analysts can customize this market research report to meet your requirements. Get in touch
 RIA -
RIA - 
