
North America Facility Management Services Market Size 2025-2029
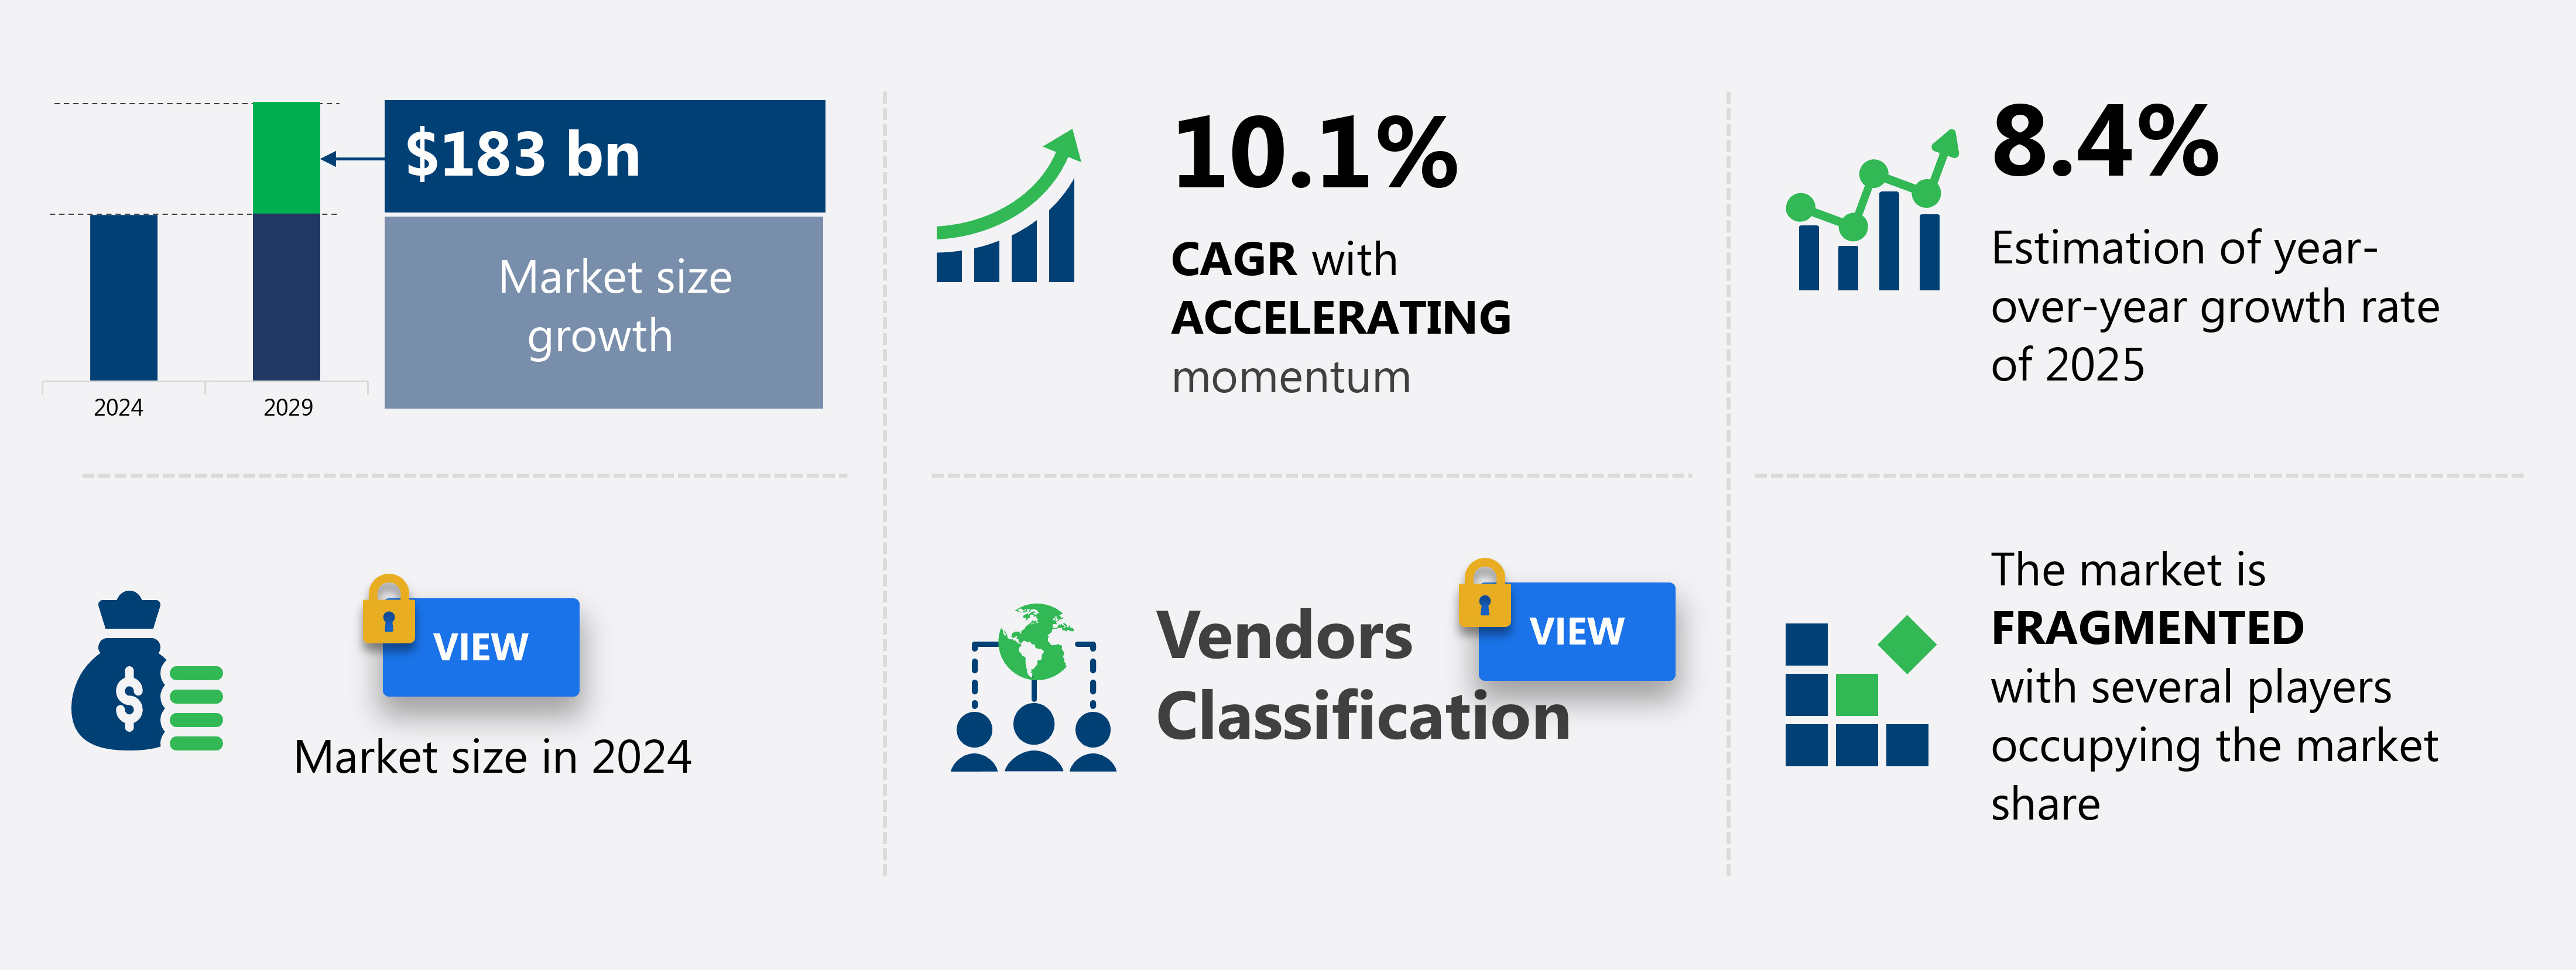
The facility management services market in North America size is forecast to increase by USD 183 billion at a CAGR of 10.1% between 2024 and 2029.
- The facility management services market is experiencing significant growth due to several key factors. One major trend driving market expansion is the increasing infrastructure development in various sectors, including commercial, industrial, and residential. Another growth factor is the rising demand for eco-friendly cleaning products, as more organizations prioritize sustainability and environmental responsibility. Insurance companies also focuses on planned maintenance to prevent equipment failures and safety issues, which can lead to costly repairs, fines, legal action, and operational disruptions. However, the market is also facing challenges, such as high saturation, which necessitates intense competition among service providers. To stay competitive, companies must offer innovative solutions, excellent customer service, and cost-effective pricing. Overall, the facility management services market is poised for continued growth, driven by these and other market dynamics.
What will be the Size of the market During the Forecast Period?
- In the dynamic business landscape, the facility management services market continues to experience significant growth as businesses seek efficient and cost-effective solutions for managing their physical assets and infrastructure. Property managers and contractors turn to FM companies to optimize operational costs through strategic resource allocation and maintenance practices. The market is characterized by a chain reaction of demands, from the need for regular pipe inspections and air conditioning unit repairs to energy-saving initiatives and space utilization. The business side of facility management requires a skilled team to address the trials and tribulations of managing pressure systems, temperature control, and employee comfort.
- moreover, FM companies play a pivotal role in implementing energy-consumption reducing measures and ensuring a safe and productive working environment. The sector's ongoing evolution encompasses the integration of advanced technologies and innovative operational practices, positioning FM companies as essential partners in managing the complexities of modern business operations.
How is this market segmented and which is the largest segment?
The market research report provides comprehensive data (region-wise segment analysis), with forecasts and estimates in "USD billion" for the period 2025-2029, as well as historical data from 2019-2023 for the following segments.
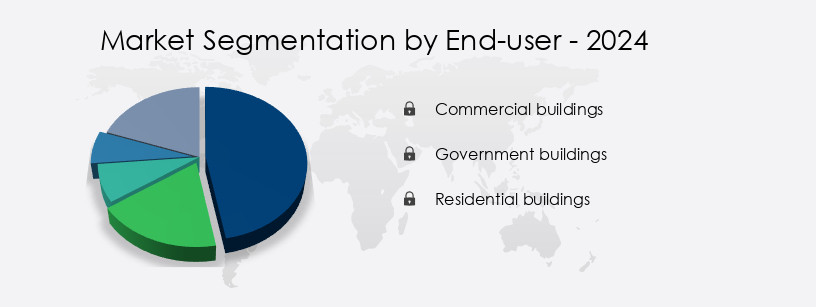
- End-user
- Commercial buildings
- Government buildings
- Residential buildings
- Service
- Soft services
- Hard services
- Type
- Fixed-term
- On-demand
- Geography
- North America
- Canada
- Mexico
- US
- North America
By End-user Insights
- The commercial buildings segment is estimated to witness significant growth during the forecast period.
The commercial facilities management services market encompasses office, hospitality, retail, and healthcare buildings. Office buildings dominate this segment due to the increasing demand for secure, convenient workplaces. With a high concentration of corporate offices, business parks, and other structures in North America, particularly the US, the need for efficient facility management is escalating. The hospitality sector, consisting of hotels, holds the second-largest share in the market. The influx of tourists to North America has led to a corresponding increase in hotel numbers, necessitating comprehensive facility management solutions. Both segments, office and hospitality, underscore the significance of facility management services in ensuring operational excellence and enhancing occupant satisfaction.
Get a glance at the market report of share of various segments Request Free Sample
Market Dynamics
Our North America Facility Management Services Market researchers analyzed the data with 2024 as the base year, along with the key drivers, trends, and challenges. A holistic analysis of drivers will help companies refine their marketing strategies to gain a competitive advantage.
What are the key market drivers leading to the rise in adoption of North America Facility Management Services Market?
Growth in infrastructure development is the key driver of the market.
- The market is experiencing significant growth due to the increasing construction activities in both residential and non-residential sectors. The construction industry's expansion In the region, particularly In the US, is leading to increased demand for outsourcing facility management services. Property managers and contractors are seeking efficient management solutions to manage their physical assets, including pipe systems, air conditioning units, and other infrastructure. Businesses aim to reduce operational costs by optimizing resource allocation and implementing energy-saving initiatives, such as maintenance practices and building automation systems. The importance of experience, systems, and skilled teams in ensuring the longevity of assets and adhering to legislation is a key consideration. Facility management companies offer a range of services, including preventive maintenance checks, inspections, security, and emergency response plans. Environmental sustainability initiatives, such as waste management and recycling programs, and energy-efficient technologies, are also becoming essential components of facilities management.
- Moreover, the role of facility managers involves overseeing activities related to care and maintenance, employee health and wellness, energy management, and emergency response plans. The sector's operational costs are influenced by maintenance practices, energy consumption, and space utilization. The implementation of facilities management software, such as a CMMS platform or maintenance connection, can help manage asset tracking and recordkeeping tools, ensuring optimal performance and extending the lifespan of assets. In summary, the market is a critical component of the business world, providing essential services to various sectors, including manufacturing plants, commercial real estate, IT facilities, hospitality and tourism, banking and finance, healthcare, and more.
What are the market trends shaping the North America Facility Management Services Market?
Rising demand for eco-friendly cleaning products is the upcoming trend In the market.
- The market is experiencing a chain reaction of businesses prioritizing eco-friendliness and sustainability. Property managers and contractors are seeking FM companies that offer green solutions, including the use of eco-friendly cleaning products. This trend is driven by the increasing awareness of the adverse effects of traditional cleaning products on the environment and occupant health. To meet this demand, many FM companies are implementing efficient systems and practices. They are investing in experienced employees, insurance coverage, and planned maintenance to ensure the longevity of physical assets. Energy-saving initiatives, such as building automation systems and energy-efficient technologies, are also becoming a priority.
- Moreover, space utilization and repairs are being optimized to reduce operational costs. Preventive maintenance checks and inspections are crucial to minimize equipment malfunctions and safety issues. Security and occupant safety are also essential components of facilities management, with emergency response plans and employee health and wellness programs being implemented. Environmental sustainability is a key focus area, with waste management and recycling programs being adopted. The sector is also embracing technology, with facilities management software and asset tracking tools being used for recordkeeping and maintenance connection. The facilities management market in North America is diverse, encompassing sectors such as manufacturing plants, commercial real estate, IT facilities, hospitality and tourism, banking and finance, healthcare, and residential real estate.
- Thus, despite the trials and tribulations that come with managing physical assets and infrastructure, the role of facility managers remains crucial in ensuring the smooth operation of buildings and the satisfaction of occupants. Best practices in facilities management include adhering to industry standards and safety regulations to avoid fines and legal action. Disaster-mitigation measures and facilities management technology are also essential to minimize operational disruptions.
What challenges does North America Facility Management Services Market face during the growth?
High market saturation is a key challenge affecting market growth.
- The North American facility management services market is recognized for its maturity, with businesses increasingly recognizing the advantages of outsourcing support functions to specialized firms. However, due to high competition and market saturation, growth in this sector is predicted to slow. In response, established companies are expanding their reach to emerging markets such as APAC, the Middle East, and South America, where the concept of outsourced facility management is gaining traction. End-users in this market prioritize efficiency, experience, and cost savings. Property managers and contractors rely on FM companies to manage complex systems like pipe networks and air conditioning units, ensuring optimal performance and prolonging asset lifespan.
- Moreover, planned maintenance, inspections, and repairs are essential for maintaining a safe and productive working environment. Environmental sustainability is a growing concern, with businesses implementing waste management, recycling programs, and energy-efficient technologies. Energy management and consumption costs are significant considerations, with energy-saving initiatives and space utilization becoming best practices. Safety and security are paramount, with emergency response plans, occupant safety, and employee health and wellness a priority. Preventive maintenance checks, inspections, and safety regulations help mitigate equipment malfunctions, safety issues, and potential fines or legal action. Facility management technology, including building automation systems, software, and maintenance connection platforms, streamlines operations and resource allocation.
- Thus, asset tracking and recordkeeping tools enable effective management of physical assets and infrastructure. In summary, the North American facility management services market is characterized by its focus on efficiency, cost savings, and sustainability. With a skilled team and adherence to industry standards and safety regulations, FM companies play a crucial role in managing the operational costs, maintenance practices, and lifecycle of businesses' physical assets.
Exclusive Customer Landscape
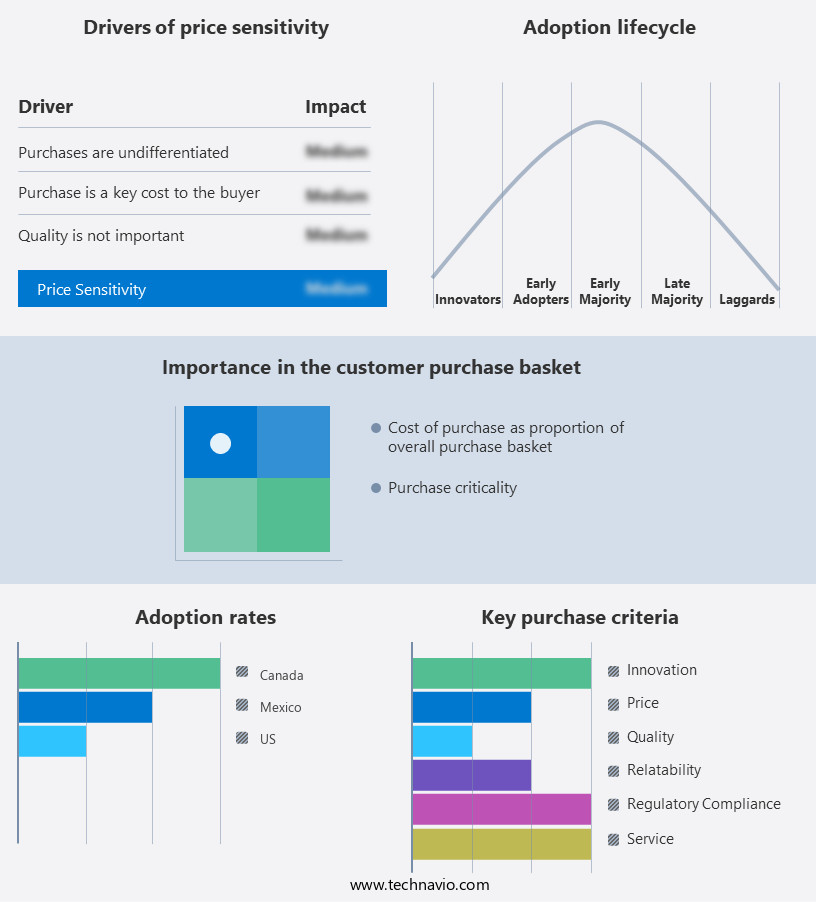
The market forecasting report includes the adoption lifecycle of the market, covering from the innovator's stage to the laggard's stage. It focuses on adoption rates in different regions based on penetration. Furthermore, the market report also includes key purchase criteria and drivers of price sensitivity to help companies evaluate and develop their market growth analysis strategies.
Customer Landscape
Key Companies & Market Insights
Companies are implementing various strategies, such as strategic alliances, market forecast , partnerships, mergers and acquisitions, geographical expansion, and product/service launches, to enhance their presence In the market.
Aramark - The company specializes in delivering comprehensive facility management solutions, encompassing integrated facilities management, custodial services, maintenance, and grounds services. By focusing on creating stimulating environments, this organization caters primarily to the educational sector.
The market research and growth report includes detailed analyses of the competitive landscape of the market and information about key companies, including:
- Aramark
- BGIS Global Integrated Solutions
- BVG India Ltd.
- CBRE Group Inc.
- Colliers International Property Consultants Inc.
- Compass Group Plc
- Cushman and Wakefield Plc
- Downer EDI Ltd.
- EMCOR Group Inc.
- Emeric Facility Services
- GDI Integrated Facility Services
- Global Facility Management and Construction Inc.
- ISS AS
- Jones Lang LaSalle Inc.
- Knight FM
- Mace Group
- Quess Corp. Ltd
- SMI Facility Services
- Sodexo SA
- Tenon Facility Management Pvt. Ltd.
Qualitative and quantitative analysis of companies has been conducted to help clients understand the wider business environment as well as the strengths and weaknesses of key market players. Data is qualitatively analyzed to categorize companies as pure play, category-focused, industry-focused, and diversified; it is quantitatively analyzed to categorize companies as dominant, leading, strong, tentative, and weak.
Research Analyst Overview
The facility management services market encompasses a broad range of activities and solutions aimed at ensuring the efficient and effective care and maintenance of physical assets and infrastructure. This sector plays a crucial role in various industries, including commercial real estate, manufacturing plants, and residential properties, among others. Property managers and contractors often rely on FM companies to optimize their operations and reduce costs through various means. One such approach involves implementing management solutions that streamline resource allocation and operational costs. These solutions can include building automation systems, software, and energy-saving initiatives. Environmental sustainability is another key focus area for facilities management. Waste management and recycling programs, energy-efficient technologies, and maintenance checks are essential components of a comprehensive facilities management plan. Preventive maintenance, inspections, and repairs help ensure the longevity of assets and minimize energy consumption, thereby reducing costs and enhancing the working environment. The role of facilities management extends beyond the business side of operations.
Furthermore, employee health, wellness, and safety are essential considerations. This includes implementing emergency response plans, ensuring occupant safety, and addressing safety issues and equipment malfunctions. Compliance with safety regulations and industry standards is also crucial, as failure to do so can result in fines, legal action, and operational disruptions. Disaster-mitigation measures are another critical aspect of facilities management. Proactive measures, such as regular maintenance checks and inspections, can help prevent or minimize the impact of potential disasters. Additionally, implementing a skilled team and utilizing facilities management technology, such as a CMMS platform and asset tracking tools, can help ensure the best possible outcomes In the face of challenges. The facilities management sector is subject to various trials and tribulations, including equipment failures, safety issues, and maintenance costs.
However, the sector continues to evolve, with new technologies and best practices emerging to address these challenges. The sector's importance is underscored by its role in maintaining the infrastructure and operations of various industries, ensuring the satisfaction of occupants, and contributing to the overall success of businesses.
|
Market Scope |
|
|
Report Coverage |
Details |
|
Page number |
184 |
|
Base year |
2024 |
|
Historic period |
2019-2023 |
|
Forecast period |
2025-2029 |
|
Growth momentum & CAGR |
Accelerate at a CAGR of 10.1% |
|
Market growth 2025-2029 |
USD 183 billion |
|
Market structure |
Fragmented |
|
YoY growth 2024-2025(%) |
8.4 |
|
Key countries |
US, Canada, and Mexico |
|
Competitive landscape |
Leading Companies, Market Positioning of Companies, Competitive Strategies, and Industry Risks |
What are the Key Data Covered in this Market Research and Growth Report?
- CAGR of the market during the forecast period
- Detailed information on factors that will drive the market growth and forecasting between 2025 and 2029
- Precise estimation of the size of the market and its contribution of the market in focus to the parent market
- Accurate predictions about upcoming market growth and trends and changes in consumer behaviour
- Growth of the market across North America
- Thorough analysis of the market's competitive landscape and detailed information about companies
- Comprehensive analysis of factors that will challenge the growth of market companies
We can help! Our analysts can customize this market research report to meet your requirements. Get in touch