Fall Protection Market Analysis, Size, and Forecast 2026-2030: APAC (China, India, and Japan), North America (US, Canada, and Mexico), Europe (Germany, UK, and France), Middle East and Africa (Saudi Arabia, UAE, and South Africa), South America (Brazil and Argentina), and Rest of World (ROW)

Fall Protection Market Analysis, Size, and Forecast 2026-2030:
APAC (China, India, and Japan), North America (US, Canada, and Mexico), Europe (Germany, UK, and France), Middle East and Africa (Saudi Arabia, UAE, and South Africa), South America (Brazil and Argentina), and Rest of World (ROW)

Published: Mar 2026 302 Pages SKU: IRTNTR46498

Market Overview at a Glance

$5.88 B
Market Opportunity
14.5%
CAGR 2025 - 2030
34%
APAC Growth
$2.28 B
Safety harness segment 2024

Fall Protection Market Size 2026-2030

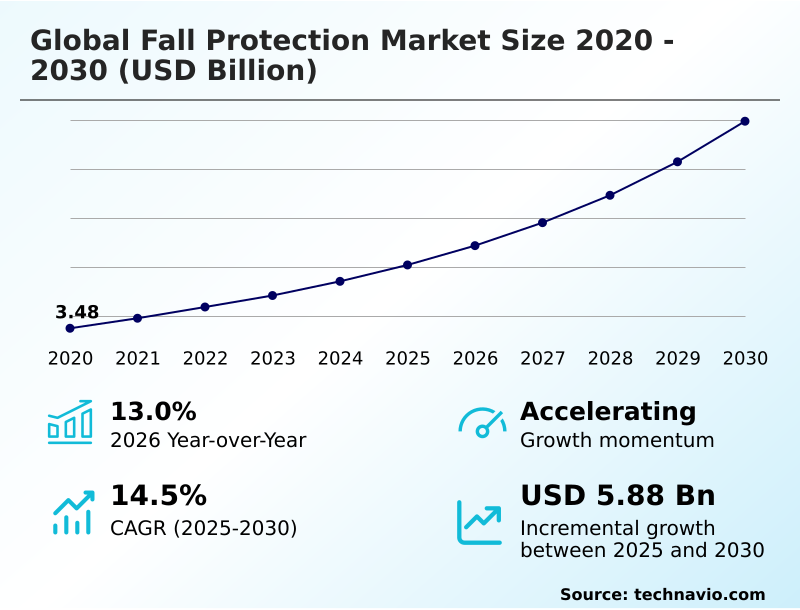
The fall protection market size is valued to increase by USD 5.88 billion, at a CAGR of 14.5% from 2025 to 2030. Intensification of occupational safety and enforcement frameworks will drive the fall protection market.

Major Market Trends & Insights

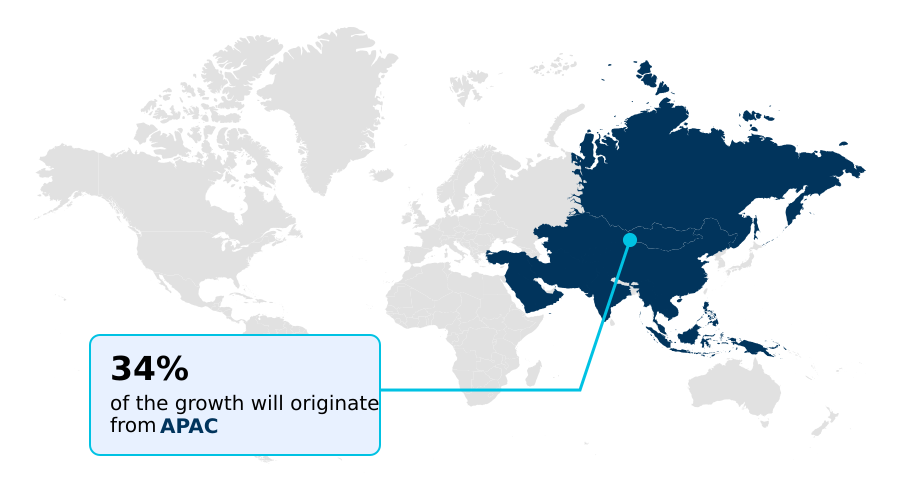
  • APAC dominated the market and accounted for a 34% growth during the forecast period.
  • By Product - Safety harness segment was valued at USD 2.28 billion in 2024
  • By End-user - Construction segment accounted for the largest market revenue share in 2024

Market Size & Forecast

  • Market Opportunities: USD 8.47 billion
  • Market Future Opportunities: USD 5.88 billion
  • CAGR from 2025 to 2030 : 14.5%

Market Summary

  • The fall protection market is undergoing a significant transformation, driven by stringent occupational health and safety mandates and rapid industrial expansion. Demand for robust personal fall arrest systems and collective protection systems is intensifying across construction, telecommunications, and energy sectors.
  • A key trend shaping the industry is the integration of iot-enabled safety monitoring into traditional gear, turning passive equipment into active, data-generating assets that support a proactive safety culture. This shift toward smart harness technology and connected self-retracting lifelines provides real-time alerts and helps automate compliance tracking software, a critical function for large enterprises.
  • For instance, a major construction firm can deploy a digital safety dashboard to monitor worker compliance with work at height regulations across multiple sites, using data to verify that all certified anchorage point connections are secure and that emergency rescue procedures are actionable.
  • However, this technological advancement is met with challenges, including a shortage of skilled personnel for competent person training and the complexity of navigating fragmented industrial safety standards globally. The market's trajectory is defined by this balance between technological innovation in equipment like horizontal lifelines and the persistent need for human expertise and regulatory harmonization.

What will be the Size of the Fall Protection Market during the forecast period?

Get Key Insights on Market Forecast (PDF) Request Free Sample

How is the Fall Protection Market Segmented?

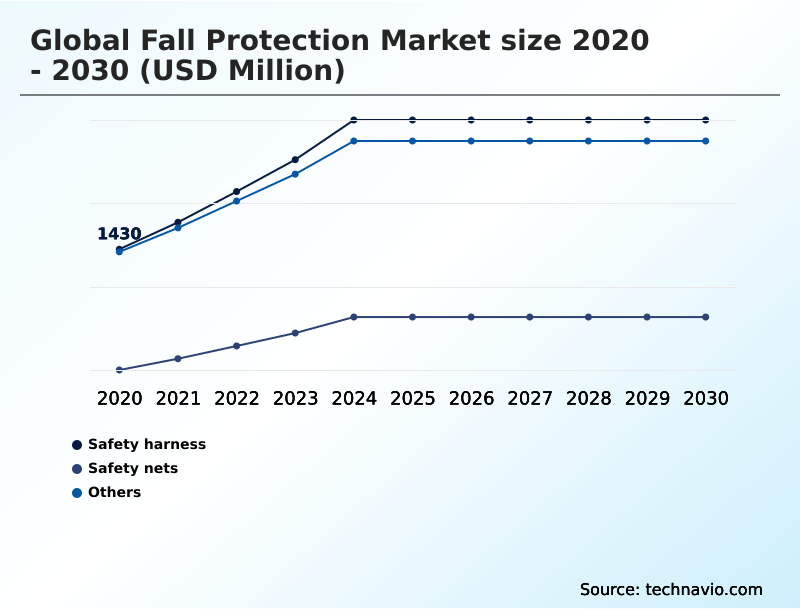
The fall protection industry research report provides comprehensive data (region-wise segment analysis), with forecasts and estimates in "USD million" for the period 2026-2030, as well as historical data from 2020-2024 for the following segments.

  • Product
    • Safety harness
    • Safety nets
    • Others
  • End-user
    • Construction
    • Energy and utilities
    • Oil and gas
    • Transportation
    • Others
  • Type
    • Personal fall protection
    • Collective fall protection
    • Access and rescue systems
  • Geography
    • APAC
      • China
      • India
      • Japan
    • North America
      • US
      • Canada
      • Mexico
    • Europe
      • Germany
      • UK
      • France
    • Middle East and Africa
      • Saudi Arabia
      • UAE
      • South Africa
    • South America
      • Brazil
      • Argentina
    • Rest of World (ROW)

By Product Insights

The safety harness segment is estimated to witness significant growth during the forecast period.

The safety harness segment is a cornerstone of personal fall arrest systems, driven by regulations mandating comprehensive body support. The market is evolving beyond basic compliance, with a significant shift toward full-body harness models that feature advanced ergonomic equipment design.

Innovations in lightweight materials and breathable fabrics are enhancing worker safety and compliance by improving comfort during extended use, which has been shown to increase user adoption by over 25% in high-fatigue roles.

A key development is the integration of smart harness technology into the fall arrest harness, equipping them with sensors for real-time monitoring.

This transition from passive to active equipment supports a proactive safety culture by improving data collection on load-bearing capabilities and ensuring equipment integrity.

Request Free Sample

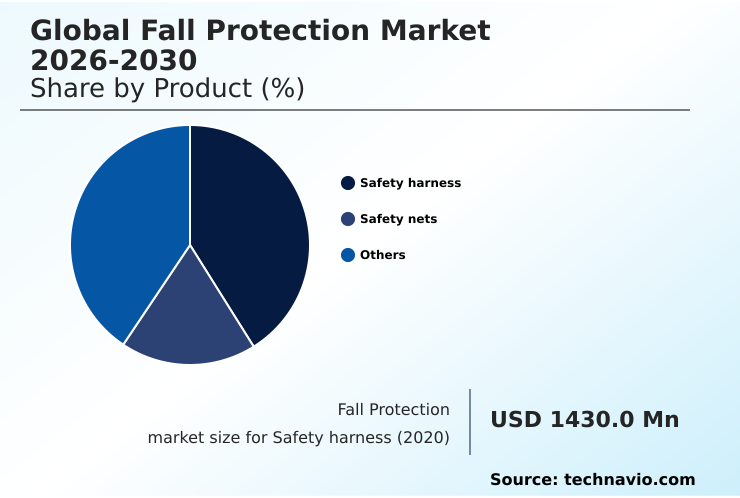
The Safety harness segment was valued at USD 2.28 billion in 2024 and showed a gradual increase during the forecast period.

Request Free Sample

Regional Analysis

APAC is estimated to contribute 34% to the growth of the global market during the forecast period.Technavio’s analysts have elaborately explained the regional trends and drivers that shape the market during the forecast period.

See How Fall Protection Market Demand is Rising in APAC Request Free Sample

The geographic landscape of the fall protection market is diverse, with regional dynamics shaping demand for specific height safety solutions.

The APAC region, contributing to over 34% of the market's incremental growth, is characterized by massive infrastructure projects driving demand for high-volume passive fall arrest systems and basic PPE.

In contrast, North America and Europe are mature markets focusing on technological adoption, including hands-free mobility solutions and integrated rescue and evacuation systems.

Here, advanced fall hazard identification in the design phase is standard, with projects integrating permanent systems showing a 15% reduction in subsequent on-site safety modifications.

Specialized sectors, such as offshore energy, create niche demand for corrosion-resistant davit arm systems and sophisticated rope access systems globally, highlighting the need for tailored equipment across varied industrial environments.

Market Dynamics

Our researchers analyzed the data with 2025 as the base year, along with the key drivers, trends, and challenges. A holistic analysis of drivers will help companies refine their marketing strategies to gain a competitive advantage.

  • Strategic decision-making in the fall protection market requires a deep understanding of specialized applications and evolving technologies. A critical debate involves collective vs personal fall protection systems, where the hierarchy of controls often favors permanent engineered solutions to minimize human error.
  • For industries like renewable energy, specifying the correct fall protection for wind turbine maintenance is paramount, often involving advanced personal fall arrest system components. The rise of iot integration in fall protection gear is transforming asset management, with protocols for the inspection of self-retracting lifelines becoming automated.
  • A smart harness for construction safety can now provide real-time data, ensuring compliance with ansi z359 standards and other regulations for working at height. In high-risk sectors, such as fall protection in oil and gas, equipment must be exceptionally durable, including arc-flash rated fall protection ppe.
  • The focus on human factors is evident in the emphasis on ergonomic design in safety harnesses and dropped object prevention best practices. Training has also become highly sophisticated; virtual reality for height safety training is now used to simulate complex scenarios, and firms leveraging this technology report competency levels nearly double those of traditional methods.
  • This is complemented by rigorous training requirements for confined space rescue and comprehensive rescue planning for tower climbers. For infrastructure, selecting anchorage points for lifelines is a critical engineering task, as is the correct non-penetrating guardrail system installation on rooftops.
  • The specialization extends to horizontal lifeline systems for aviation maintenance and defining the right material requirements for safety nets in construction, ensuring every aspect of height safety is addressed with technical precision.

What are the key market drivers leading to the rise in the adoption of Fall Protection Industry?

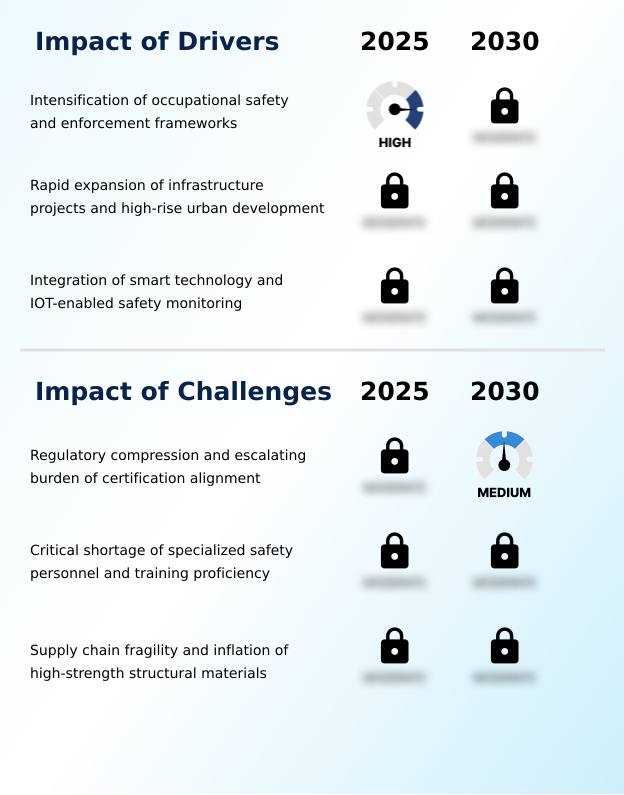
  • The intensification of occupational safety regulations and stricter enforcement frameworks serves as a primary driver for market growth.

  • The market's expansion is fundamentally driven by the intensification of occupational safety and health mandates and the stringent enforcement of work at height regulations.
  • Globally, regions with stricter regulatory enforcement see up to a 25% lower rate of fall-related fatalities, compelling organizations to invest in compliant fall prevention systems.
  • The rapid expansion of infrastructure, from 5G towers to renewable energy installations, fuels demand for specialized climbing gear and custom engineered fall safety systems.
  • Large-scale public projects now allocate up to 5% of their total safety budget to advanced height safety solutions.
  • This regulatory environment also elevates the importance of lifecycle management, with mandated equipment recertification protocols creating a consistent revenue stream and ensuring that all gear adheres to the latest industrial safety standards.

What are the market trends shaping the Fall Protection Industry?

  • The market is witnessing a fundamental shift toward the integration of active personal protective equipment. This evolution is defined by the incorporation of smart sensor ecosystems to enhance real-time safety monitoring.

  • Market evolution is marked by a structural transition toward active personal protective equipment and permanent engineered solutions. The integration of IoT technology facilitates data-driven safety management, allowing firms to move from reactive incident response to proactive hazard mitigation. These smart systems enable instantaneous alerts, improving the speed of rescue operations by up to 90%.
  • Concurrently, the prioritization of collective systems, such as guardrails that create a passive safety barrier, reflects a strategic move to design out risk at the source. Another transformative trend is the adoption of virtual reality safety training, which has demonstrated an ability to improve safety protocol retention by over 60% compared to conventional methods.
  • This immersive approach is critical for achieving human error factor reduction in high-stress, at-height environments.

What challenges does the Fall Protection Industry face during its growth?

  • Market growth is challenged by regulatory compression and the escalating burden of aligning products with disparate international certification standards.

  • Key market challenges stem from operational and supply chain complexities. The burden of regulatory compliance management across fragmented international standards can increase a product's time-to-market by up to 18 months, hindering innovation in technical safety hardware.
  • A critical shortage of qualified professionals for competent person training and on-site safety audits is a reported issue for nearly 50% of industrial firms, undermining the effectiveness of even the most advanced safety systems. Furthermore, supply chain fragility creates significant price volatility for essential materials like high-strength alloys and high-tenacity synthetic fibers.
  • This uncertainty complicates long-term project bidding and makes it difficult to stabilize the costs of safety equipment, impacting overall financial planning for end-users.

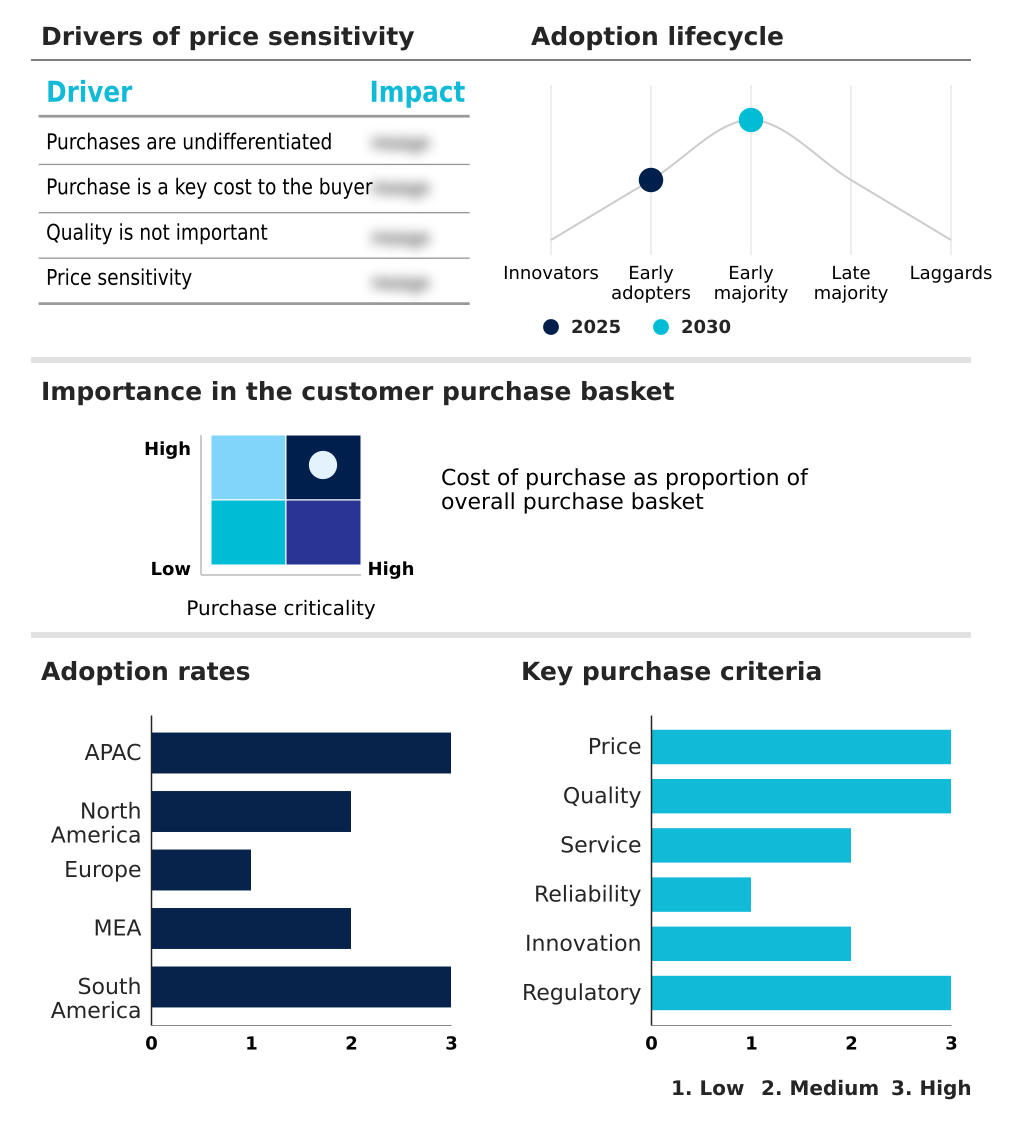
Exclusive Technavio Analysis on Customer Landscape

The fall protection market forecasting report includes the adoption lifecycle of the market, covering from the innovator’s stage to the laggard’s stage. It focuses on adoption rates in different regions based on penetration. Furthermore, the fall protection market report also includes key purchase criteria and drivers of price sensitivity to help companies evaluate and develop their market growth analysis strategies.

Customer Landscape of Fall Protection Industry

Competitive Landscape

Companies are implementing various strategies, such as strategic alliances, fall protection market forecast, partnerships, mergers and acquisitions, geographical expansion, and product/service launches, to enhance their presence in the industry.

3M Co. - Provides comprehensive fall protection systems, including personal and engineered solutions, integral to industrial safety and risk management protocols across multiple high-hazard sectors.

The industry research and growth report includes detailed analyses of the competitive landscape of the market and information about key companies, including:

  • 3M Co.
  • ABS Safety GmbH
  • Adolf Wurth GmbH and Co. KG
  • Bergman and Beving AB
  • FallTech
  • French Creek Production Inc.
  • Honeywell International Inc.
  • KARAM Safety Pvt. Ltd.
  • Kee Safety Systems and Services
  • Kennedy Wire Rope and Sling Co
  • Magid Glove and Safety Co
  • MSA Safety Inc.
  • PETZL Distribution
  • Pure Safety Group Inc.
  • Reliance Fall Protection
  • Safe Approach Inc.
  • SafeWaze
  • Super Anchor Safety
  • Uviraj Group
  • Webb Rite Safety
  • Werner Co.

Qualitative and quantitative analysis of companies has been conducted to help clients understand the wider business environment as well as the strengths and weaknesses of key industry players. Data is qualitatively analyzed to categorize companies as pure play, category-focused, industry-focused, and diversified; it is quantitatively analyzed to categorize companies as dominant, leading, strong, tentative, and weak.

Recent Development and News in Fall protection market

  • In January 2025, the Occupational Safety and Health Administration (OSHA) mandated a final rule requiring that all personal protective equipment, including fall arrest harnesses used in construction, must properly fit each worker, addressing historical safety gaps for diverse body types.
  • In March 2025, SureWerx completed its acquisition of Reliance Fall Protection, a strategic move to integrate engineered fall safety systems and advanced MicroLoc technology into its portfolio, reflecting consolidation in the connected safety market.
  • In September 2024, AT&T, in partnership with ActiveProtective and JACS Solutions, launched a new dedicated connectivity device for wearable fall prevention belts, enabling real-time alerts and rapid emergency response.
  • In November 2024, the initial public offering for Msafe Equipments, a height-safety specialist, was oversubscribed by more than one hundred and sixty-six times, signaling strong investor confidence in the growth of the specialized safety equipment and services sector.

Dive into Technavio’s robust research methodology, blending expert interviews, extensive data synthesis, and validated models for unparalleled Fall Protection Market insights. See full methodology.

Market Scope
Page number 302
Base year 2025
Historic period 2020-2024
Forecast period 2026-2030
Growth momentum & CAGR Accelerate at a CAGR of 14.5%
Market growth 2026-2030 USD 5877.4 million
Market structure Fragmented
YoY growth 2025-2026(%) 13.0%
Key countries China, India, Japan, South Korea, Australia, Indonesia, US, Canada, Mexico, Germany, UK, France, Italy, Spain, The Netherlands, Saudi Arabia, UAE, South Africa, Turkey, Egypt, Brazil, Argentina and Chile
Competitive landscape Leading Companies, Market Positioning of Companies, Competitive Strategies, and Industry Risks

Request Free Sample

Research Analyst Overview

  • The fall protection market is defined by a crucial pivot from passive compliance to proactive, technology-driven safety management. The foundation of worker protection remains anchored in robust personal fall arrest systems, including the essential full-body harness or fall arrest harness, connected via energy-absorbing lanyards or shock-absorbing lanyards to a certified anchorage point.
  • However, the integration of smart harness technology and iot-enabled safety monitoring into self-retracting lifelines and vertical lifeline systems is reshaping strategic boardroom decisions around capital expenditure. This shift requires significant investment in a connected ecosystem that includes active personal protective equipment and sophisticated software.
  • While passive fall arrest systems like safety net systems and temporary edge protection remain vital, the future lies in intelligent hardware. The adoption of virtual reality safety training, advanced rope access systems, and specialized confined space entry equipment like davit arm systems further exemplifies this trend.
  • Innovations in materials, such as high-tenacity synthetic fibers and aerospace-grade aluminum, are creating more durable and lightweight ladder climbing systems and modular guardrail systems, with automated inspection logs reducing administrative time by 40%.
  • This evolution towards permanent engineered solutions and engineered fall safety systems, including overhead track systems and non-penetrating rooftop guardrails, is critical for addressing complex hazards and ensuring suspension trauma prevention through effective rescue and evacuation systems. The market also addresses niche needs with arc-flash-rated ppe and robust dropped object prevention measures.

What are the Key Data Covered in this Fall Protection Market Research and Growth Report?

  • What is the expected growth of the Fall Protection Market between 2026 and 2030?

    • USD 5.88 billion, at a CAGR of 14.5%

  • What segmentation does the market report cover?

    • The report is segmented by Product (Safety harness, Safety nets, and Others), End-user (Construction, Energy and utilities, Oil and gas, Transportation, and Others), Type (Personal fall protection, Collective fall protection, and Access and rescue systems) and Geography (APAC, North America, Europe, Middle East and Africa, South America)

  • Which regions are analyzed in the report?

    • APAC, North America, Europe, Middle East and Africa and South America

  • What are the key growth drivers and market challenges?

    • Intensification of occupational safety and enforcement frameworks, Regulatory compression and escalating burden of certification alignment

  • Who are the major players in the Fall Protection Market?

    • 3M Co., ABS Safety GmbH, Adolf Wurth GmbH and Co. KG, Bergman and Beving AB, FallTech, French Creek Production Inc., Honeywell International Inc., KARAM Safety Pvt. Ltd., Kee Safety Systems and Services, Kennedy Wire Rope and Sling Co, Magid Glove and Safety Co, MSA Safety Inc., PETZL Distribution, Pure Safety Group Inc., Reliance Fall Protection, Safe Approach Inc., SafeWaze, Super Anchor Safety, Uviraj Group, Webb Rite Safety and Werner Co.

Market Research Insights

  • The dynamics of the fall protection market are shaped by an increasing focus on data-driven safety management and the establishment of a proactive safety culture. Organizations are moving beyond basic compliance, implementing comprehensive fall protection plans that integrate real-time worker monitoring to preemptively address hazards.
  • Adopting these advanced systems has shown measurable results; firms utilizing digital safety dashboards for equipment integrity monitoring have reported a 20% reduction in equipment-related incidents. Furthermore, standardizing site-specific safety planning and emergency rescue procedures has proven to enhance operational readiness.
  • Companies that invest in on-site safety audits and continuous competent person training demonstrate superior worker safety and compliance outcomes, with some achieving a 35% improvement in compliance metrics compared to those with less structured programs. This strategic shift underscores the market's evolution toward holistic, intelligent safety ecosystems.

We can help! Our analysts can customize this fall protection market research report to meet your requirements.

Get in touch

1. Executive Summary

1.1 Market overview

Executive Summary - Chart on Market Overview
Executive Summary - Data Table on Market Overview
Executive Summary - Chart on Global Market Characteristics
Executive Summary - Chart on Market by Geography
Executive Summary - Chart on Market Segmentation by Product
Executive Summary - Chart on Market Segmentation by End-user
Executive Summary - Chart on Market Segmentation by Type
Executive Summary - Chart on Incremental Growth
Executive Summary - Data Table on Incremental Growth
Executive Summary - Chart on Company Market Positioning

2. Technavio Analysis

2.1 Analysis of price sensitivity, lifecycle, customer purchase basket, adoption rates, and purchase criteria

2.2 Criticality of inputs and Factors of differentiation

Chart on Overview on criticality of inputs and factors of differentiation

2.3 Factors of disruption

Chart on Overview on factors of disruption

2.4 Impact of drivers and challenges

Chart on Impact of drivers and challenges in 2025 and 2030

3. Market Landscape

3.1 Market ecosystem

Chart on Parent Market
Data Table on - Parent Market

3.2 Market characteristics

Chart on Market characteristics analysis

3.3 Value chain analysis

Chart on Value chain analysis

4. Market Sizing

4.1 Market definition

Data Table on Offerings of companies included in the market definition

4.2 Market segment analysis

Market segments

4.3 Market size 2025

4.4 Market outlook: Forecast for 2025-2030

Chart on Global - Market size and forecast 2025-2030 ($ million)
Data Table on Global - Market size and forecast 2025-2030 ($ million)
Chart on Global Market: Year-over-year growth 2025-2030 (%)
Data Table on Global Market: Year-over-year growth 2025-2030 (%)

5. Historic Market Size

5.1 Global Fall Protection Market 2020 - 2024

Historic Market Size - Data Table on Global Fall Protection Market 2020 - 2024 ($ million)

5.2 Product segment analysis 2020 - 2024

Historic Market Size - Product Segment 2020 - 2024 ($ million)

5.3 End-user segment analysis 2020 - 2024

Historic Market Size - End-user Segment 2020 - 2024 ($ million)

5.4 Type segment analysis 2020 - 2024

Historic Market Size - Type Segment 2020 - 2024 ($ million)

5.5 Geography segment analysis 2020 - 2024

Historic Market Size - Geography Segment 2020 - 2024 ($ million)

5.6 Country segment analysis 2020 - 2024

Historic Market Size - Country Segment 2020 - 2024 ($ million)

6. Qualitative Analysis

6.1 Impact of AI in global fall protection market

7. Five Forces Analysis

7.1 Five forces summary

Five forces analysis - Comparison between 2025 and 2030

7.2 Bargaining power of buyers

Bargaining power of buyers - Impact of key factors 2025 and 2030

7.3 Bargaining power of suppliers

Bargaining power of suppliers - Impact of key factors in 2025 and 2030

7.4 Threat of new entrants

Threat of new entrants - Impact of key factors in 2025 and 2030

7.5 Threat of substitutes

Threat of substitutes - Impact of key factors in 2025 and 2030

7.6 Threat of rivalry

Threat of rivalry - Impact of key factors in 2025 and 2030

7.7 Market condition

Chart on Market condition - Five forces 2025 and 2030

8. Market Segmentation by Product

8.1 Market segments

Chart on Product - Market share 2025-2030 (%)
Data Table on Product - Market share 2025-2030 (%)

8.2 Comparison by Product

Chart on Comparison by Product
Data Table on Comparison by Product

8.3 Safety harness - Market size and forecast 2025-2030

Chart on Safety harness - Market size and forecast 2025-2030 ($ million)
Data Table on Safety harness - Market size and forecast 2025-2030 ($ million)
Chart on Safety harness - Year-over-year growth 2025-2030 (%)
Data Table on Safety harness - Year-over-year growth 2025-2030 (%)

8.4 Safety nets - Market size and forecast 2025-2030

Chart on Safety nets - Market size and forecast 2025-2030 ($ million)
Data Table on Safety nets - Market size and forecast 2025-2030 ($ million)
Chart on Safety nets - Year-over-year growth 2025-2030 (%)
Data Table on Safety nets - Year-over-year growth 2025-2030 (%)

8.5 Others - Market size and forecast 2025-2030

Chart on Others - Market size and forecast 2025-2030 ($ million)
Data Table on Others - Market size and forecast 2025-2030 ($ million)
Chart on Others - Year-over-year growth 2025-2030 (%)
Data Table on Others - Year-over-year growth 2025-2030 (%)

8.6 Market opportunity by Product

Market opportunity by Product ($ million)
Data Table on Market opportunity by Product ($ million)

9. Market Segmentation by End-user

9.1 Market segments

Chart on End-user - Market share 2025-2030 (%)
Data Table on End-user - Market share 2025-2030 (%)

9.2 Comparison by End-user

Chart on Comparison by End-user
Data Table on Comparison by End-user

9.3 Construction - Market size and forecast 2025-2030

Chart on Construction - Market size and forecast 2025-2030 ($ million)
Data Table on Construction - Market size and forecast 2025-2030 ($ million)
Chart on Construction - Year-over-year growth 2025-2030 (%)
Data Table on Construction - Year-over-year growth 2025-2030 (%)

9.4 Energy and utilities - Market size and forecast 2025-2030

Chart on Energy and utilities - Market size and forecast 2025-2030 ($ million)
Data Table on Energy and utilities - Market size and forecast 2025-2030 ($ million)
Chart on Energy and utilities - Year-over-year growth 2025-2030 (%)
Data Table on Energy and utilities - Year-over-year growth 2025-2030 (%)

9.5 Oil and gas - Market size and forecast 2025-2030

Chart on Oil and gas - Market size and forecast 2025-2030 ($ million)
Data Table on Oil and gas - Market size and forecast 2025-2030 ($ million)
Chart on Oil and gas - Year-over-year growth 2025-2030 (%)
Data Table on Oil and gas - Year-over-year growth 2025-2030 (%)

9.6 Transportation - Market size and forecast 2025-2030

Chart on Transportation - Market size and forecast 2025-2030 ($ million)
Data Table on Transportation - Market size and forecast 2025-2030 ($ million)
Chart on Transportation - Year-over-year growth 2025-2030 (%)
Data Table on Transportation - Year-over-year growth 2025-2030 (%)

9.7 Others - Market size and forecast 2025-2030

Chart on Others - Market size and forecast 2025-2030 ($ million)
Data Table on Others - Market size and forecast 2025-2030 ($ million)
Chart on Others - Year-over-year growth 2025-2030 (%)
Data Table on Others - Year-over-year growth 2025-2030 (%)

9.8 Market opportunity by End-user

Market opportunity by End-user ($ million)
Data Table on Market opportunity by End-user ($ million)

10. Market Segmentation by Type

10.1 Market segments

Chart on Type - Market share 2025-2030 (%)
Data Table on Type - Market share 2025-2030 (%)

10.2 Comparison by Type

Chart on Comparison by Type
Data Table on Comparison by Type

10.3 Personal fall protection - Market size and forecast 2025-2030

Chart on Personal fall protection - Market size and forecast 2025-2030 ($ million)
Data Table on Personal fall protection - Market size and forecast 2025-2030 ($ million)
Chart on Personal fall protection - Year-over-year growth 2025-2030 (%)
Data Table on Personal fall protection - Year-over-year growth 2025-2030 (%)

10.4 Collective fall protection - Market size and forecast 2025-2030

Chart on Collective fall protection - Market size and forecast 2025-2030 ($ million)
Data Table on Collective fall protection - Market size and forecast 2025-2030 ($ million)
Chart on Collective fall protection - Year-over-year growth 2025-2030 (%)
Data Table on Collective fall protection - Year-over-year growth 2025-2030 (%)

10.5 Access and rescue systems - Market size and forecast 2025-2030

Chart on Access and rescue systems - Market size and forecast 2025-2030 ($ million)
Data Table on Access and rescue systems - Market size and forecast 2025-2030 ($ million)
Chart on Access and rescue systems - Year-over-year growth 2025-2030 (%)
Data Table on Access and rescue systems - Year-over-year growth 2025-2030 (%)

10.6 Market opportunity by Type

Market opportunity by Type ($ million)
Data Table on Market opportunity by Type ($ million)

11. Customer Landscape

11.1 Customer landscape overview

Analysis of price sensitivity, lifecycle, customer purchase basket, adoption rates, and purchase criteria

12. Geographic Landscape

12.1 Geographic segmentation

Chart on Market share by geography 2025-2030 (%)
Data Table on Market share by geography 2025-2030 (%)

12.2 Geographic comparison

Chart on Geographic comparison
Data Table on Geographic comparison

12.3 APAC - Market size and forecast 2025-2030

Chart on APAC - Market size and forecast 2025-2030 ($ million)
Data Table on APAC - Market size and forecast 2025-2030 ($ million)
Chart on APAC - Year-over-year growth 2025-2030 (%)
Data Table on APAC - Year-over-year growth 2025-2030 (%)
Chart on Regional Comparison - APAC
Data Table on Regional Comparison - APAC

12.3.1 China - Market size and forecast 2025-2030

Chart on China - Market size and forecast 2025-2030 ($ million)
Data Table on China - Market size and forecast 2025-2030 ($ million)
Chart on China - Year-over-year growth 2025-2030 (%)
Data Table on China - Year-over-year growth 2025-2030 (%)

12.3.2 India - Market size and forecast 2025-2030

Chart on India - Market size and forecast 2025-2030 ($ million)
Data Table on India - Market size and forecast 2025-2030 ($ million)
Chart on India - Year-over-year growth 2025-2030 (%)
Data Table on India - Year-over-year growth 2025-2030 (%)

12.3.3 Japan - Market size and forecast 2025-2030

Chart on Japan - Market size and forecast 2025-2030 ($ million)
Data Table on Japan - Market size and forecast 2025-2030 ($ million)
Chart on Japan - Year-over-year growth 2025-2030 (%)
Data Table on Japan - Year-over-year growth 2025-2030 (%)

12.3.4 South Korea - Market size and forecast 2025-2030

Chart on South Korea - Market size and forecast 2025-2030 ($ million)
Data Table on South Korea - Market size and forecast 2025-2030 ($ million)
Chart on South Korea - Year-over-year growth 2025-2030 (%)
Data Table on South Korea - Year-over-year growth 2025-2030 (%)

12.3.5 Australia - Market size and forecast 2025-2030

Chart on Australia - Market size and forecast 2025-2030 ($ million)
Data Table on Australia - Market size and forecast 2025-2030 ($ million)
Chart on Australia - Year-over-year growth 2025-2030 (%)
Data Table on Australia - Year-over-year growth 2025-2030 (%)

12.3.6 Indonesia - Market size and forecast 2025-2030

Chart on Indonesia - Market size and forecast 2025-2030 ($ million)
Data Table on Indonesia - Market size and forecast 2025-2030 ($ million)
Chart on Indonesia - Year-over-year growth 2025-2030 (%)
Data Table on Indonesia - Year-over-year growth 2025-2030 (%)

12.4 North America - Market size and forecast 2025-2030

Chart on North America - Market size and forecast 2025-2030 ($ million)
Data Table on North America - Market size and forecast 2025-2030 ($ million)
Chart on North America - Year-over-year growth 2025-2030 (%)
Data Table on North America - Year-over-year growth 2025-2030 (%)
Chart on Regional Comparison - North America
Data Table on Regional Comparison - North America

12.4.1 US - Market size and forecast 2025-2030

Chart on US - Market size and forecast 2025-2030 ($ million)
Data Table on US - Market size and forecast 2025-2030 ($ million)
Chart on US - Year-over-year growth 2025-2030 (%)
Data Table on US - Year-over-year growth 2025-2030 (%)

12.4.2 Canada - Market size and forecast 2025-2030

Chart on Canada - Market size and forecast 2025-2030 ($ million)
Data Table on Canada - Market size and forecast 2025-2030 ($ million)
Chart on Canada - Year-over-year growth 2025-2030 (%)
Data Table on Canada - Year-over-year growth 2025-2030 (%)

12.4.3 Mexico - Market size and forecast 2025-2030

Chart on Mexico - Market size and forecast 2025-2030 ($ million)
Data Table on Mexico - Market size and forecast 2025-2030 ($ million)
Chart on Mexico - Year-over-year growth 2025-2030 (%)
Data Table on Mexico - Year-over-year growth 2025-2030 (%)

12.5 Europe - Market size and forecast 2025-2030

Chart on Europe - Market size and forecast 2025-2030 ($ million)
Data Table on Europe - Market size and forecast 2025-2030 ($ million)
Chart on Europe - Year-over-year growth 2025-2030 (%)
Data Table on Europe - Year-over-year growth 2025-2030 (%)
Chart on Regional Comparison - Europe
Data Table on Regional Comparison - Europe

12.5.1 Germany - Market size and forecast 2025-2030

Chart on Germany - Market size and forecast 2025-2030 ($ million)
Data Table on Germany - Market size and forecast 2025-2030 ($ million)
Chart on Germany - Year-over-year growth 2025-2030 (%)
Data Table on Germany - Year-over-year growth 2025-2030 (%)

12.5.2 UK - Market size and forecast 2025-2030

Chart on UK - Market size and forecast 2025-2030 ($ million)
Data Table on UK - Market size and forecast 2025-2030 ($ million)
Chart on UK - Year-over-year growth 2025-2030 (%)
Data Table on UK - Year-over-year growth 2025-2030 (%)

12.5.3 France - Market size and forecast 2025-2030

Chart on France - Market size and forecast 2025-2030 ($ million)
Data Table on France - Market size and forecast 2025-2030 ($ million)
Chart on France - Year-over-year growth 2025-2030 (%)
Data Table on France - Year-over-year growth 2025-2030 (%)

12.5.4 Italy - Market size and forecast 2025-2030

Chart on Italy - Market size and forecast 2025-2030 ($ million)
Data Table on Italy - Market size and forecast 2025-2030 ($ million)
Chart on Italy - Year-over-year growth 2025-2030 (%)
Data Table on Italy - Year-over-year growth 2025-2030 (%)

12.5.5 Spain - Market size and forecast 2025-2030

Chart on Spain - Market size and forecast 2025-2030 ($ million)
Data Table on Spain - Market size and forecast 2025-2030 ($ million)
Chart on Spain - Year-over-year growth 2025-2030 (%)
Data Table on Spain - Year-over-year growth 2025-2030 (%)

12.5.6 The Netherlands - Market size and forecast 2025-2030

Chart on The Netherlands - Market size and forecast 2025-2030 ($ million)
Data Table on The Netherlands - Market size and forecast 2025-2030 ($ million)
Chart on The Netherlands - Year-over-year growth 2025-2030 (%)
Data Table on The Netherlands - Year-over-year growth 2025-2030 (%)

12.6 Middle East and Africa - Market size and forecast 2025-2030

Chart on Middle East and Africa - Market size and forecast 2025-2030 ($ million)
Data Table on Middle East and Africa - Market size and forecast 2025-2030 ($ million)
Chart on Middle East and Africa - Year-over-year growth 2025-2030 (%)
Data Table on Middle East and Africa - Year-over-year growth 2025-2030 (%)
Chart on Regional Comparison - Middle East and Africa
Data Table on Regional Comparison - Middle East and Africa

12.6.1 Saudi Arabia - Market size and forecast 2025-2030

Chart on Saudi Arabia - Market size and forecast 2025-2030 ($ million)
Data Table on Saudi Arabia - Market size and forecast 2025-2030 ($ million)
Chart on Saudi Arabia - Year-over-year growth 2025-2030 (%)
Data Table on Saudi Arabia - Year-over-year growth 2025-2030 (%)

12.6.2 UAE - Market size and forecast 2025-2030

Chart on UAE - Market size and forecast 2025-2030 ($ million)
Data Table on UAE - Market size and forecast 2025-2030 ($ million)
Chart on UAE - Year-over-year growth 2025-2030 (%)
Data Table on UAE - Year-over-year growth 2025-2030 (%)

12.6.3 South Africa - Market size and forecast 2025-2030

Chart on South Africa - Market size and forecast 2025-2030 ($ million)
Data Table on South Africa - Market size and forecast 2025-2030 ($ million)
Chart on South Africa - Year-over-year growth 2025-2030 (%)
Data Table on South Africa - Year-over-year growth 2025-2030 (%)

12.6.4 Turkey - Market size and forecast 2025-2030

Chart on Turkey - Market size and forecast 2025-2030 ($ million)
Data Table on Turkey - Market size and forecast 2025-2030 ($ million)
Chart on Turkey - Year-over-year growth 2025-2030 (%)
Data Table on Turkey - Year-over-year growth 2025-2030 (%)

12.6.5 Egypt - Market size and forecast 2025-2030

Chart on Egypt - Market size and forecast 2025-2030 ($ million)
Data Table on Egypt - Market size and forecast 2025-2030 ($ million)
Chart on Egypt - Year-over-year growth 2025-2030 (%)
Data Table on Egypt - Year-over-year growth 2025-2030 (%)

12.7 South America - Market size and forecast 2025-2030

Chart on South America - Market size and forecast 2025-2030 ($ million)
Data Table on South America - Market size and forecast 2025-2030 ($ million)
Chart on South America - Year-over-year growth 2025-2030 (%)
Data Table on South America - Year-over-year growth 2025-2030 (%)
Chart on Regional Comparison - South America
Data Table on Regional Comparison - South America

12.7.1 Brazil - Market size and forecast 2025-2030

Chart on Brazil - Market size and forecast 2025-2030 ($ million)
Data Table on Brazil - Market size and forecast 2025-2030 ($ million)
Chart on Brazil - Year-over-year growth 2025-2030 (%)
Data Table on Brazil - Year-over-year growth 2025-2030 (%)

12.7.2 Argentina - Market size and forecast 2025-2030

Chart on Argentina - Market size and forecast 2025-2030 ($ million)
Data Table on Argentina - Market size and forecast 2025-2030 ($ million)
Chart on Argentina - Year-over-year growth 2025-2030 (%)
Data Table on Argentina - Year-over-year growth 2025-2030 (%)

12.7.3 Chile - Market size and forecast 2025-2030

Chart on Chile - Market size and forecast 2025-2030 ($ million)
Data Table on Chile - Market size and forecast 2025-2030 ($ million)
Chart on Chile - Year-over-year growth 2025-2030 (%)
Data Table on Chile - Year-over-year growth 2025-2030 (%)

12.8 Market opportunity by geography

Market opportunity by geography ($ million)
Data Tables on Market opportunity by geography ($ million)

13. Drivers, Challenges, and Opportunity

13.1 Market drivers

Intensification of occupational safety and enforcement frameworks
Rapid expansion of infrastructure projects and high-rise urban development
Integration of smart technology and IOT-enabled safety monitoring

13.2 Market challenges

Regulatory compression and escalating burden of certification alignment
Critical shortage of specialized safety personnel and training proficiency
Supply chain fragility and inflation of high-strength structural materials

13.3 Impact of drivers and challenges

Impact of drivers and challenges in 2025 and 2030

13.4 Market opportunities

Integration of active personal protective equipment and smart sensor ecosystems
Proliferation of permanent engineered solutions and modular guardrail systems
Evolution of virtual reality training and immersive safety education

14. Competitive Landscape

14.1 Overview

14.2

Overview on criticality of inputs and factors of differentiation

14.3 Landscape disruption

Overview on factors of disruption

14.4 Industry risks

Impact of key risks on business

15. Competitive Analysis

15.1 Companies profiled

Companies covered

15.2 Company ranking index

15.3 Market positioning of companies

Matrix on companies position and classification

15.4 3M Co.

3M Co. - Overview
3M Co. - Business segments
3M Co. - Key news
3M Co. - Key offerings
3M Co. - Segment focus
SWOT

15.5 ABS Safety GmbH

ABS Safety GmbH - Overview
ABS Safety GmbH - Product / Service
ABS Safety GmbH - Key offerings
SWOT

15.6 Adolf Wurth GmbH and Co. KG

Adolf Wurth GmbH and Co. KG - Overview
Adolf Wurth GmbH and Co. KG - Product / Service
Adolf Wurth GmbH and Co. KG - Key offerings
SWOT

15.7 Bergman and Beving AB

Bergman and Beving AB - Overview
Bergman and Beving AB - Business segments
Bergman and Beving AB - Key offerings
Bergman and Beving AB - Segment focus
SWOT

15.8 French Creek Production Inc.

French Creek Production Inc. - Overview
French Creek Production Inc. - Product / Service
French Creek Production Inc. - Key offerings
SWOT

15.9 Honeywell International Inc.

Honeywell International Inc. - Overview
Honeywell International Inc. - Business segments
Honeywell International Inc. - Key news
Honeywell International Inc. - Key offerings
Honeywell International Inc. - Segment focus
SWOT

15.10 KARAM Safety Pvt. Ltd.

KARAM Safety Pvt. Ltd. - Overview
KARAM Safety Pvt. Ltd. - Product / Service
KARAM Safety Pvt. Ltd. - Key offerings
SWOT

15.11 Kennedy Wire Rope and Sling Co

Kennedy Wire Rope and Sling Co - Overview
Kennedy Wire Rope and Sling Co - Product / Service
Kennedy Wire Rope and Sling Co - Key offerings
SWOT

15.12 MSA Safety Inc.

MSA Safety Inc. - Overview
MSA Safety Inc. - Business segments
MSA Safety Inc. - Key offerings
MSA Safety Inc. - Segment focus
SWOT

15.13 PETZL Distribution

PETZL Distribution - Overview
PETZL Distribution - Product / Service
PETZL Distribution - Key offerings
SWOT

15.14 Reliance Fall Protection

Reliance Fall Protection - Overview
Reliance Fall Protection - Product / Service
Reliance Fall Protection - Key offerings
SWOT

15.15 Safe Approach Inc.

Safe Approach Inc. - Overview
Safe Approach Inc. - Product / Service
Safe Approach Inc. - Key offerings
SWOT

15.16 Uviraj Group

Uviraj Group - Overview
Uviraj Group - Product / Service
Uviraj Group - Key offerings
SWOT

15.17 Webb Rite Safety

Webb Rite Safety - Overview
Webb Rite Safety - Product / Service
Webb Rite Safety - Key offerings
SWOT

15.18 Werner Co.

Werner Co. - Overview
Werner Co. - Product / Service
Werner Co. - Key offerings
SWOT

16. Appendix

16.1 Scope of the report

Market definition
Objectives
Notes and caveats

16.2 Inclusions and exclusions checklist

Inclusions checklist
Exclusions checklist

16.3 Currency conversion rates for US$

16.4 Research methodology

16.5 Data procurement

Information sources

16.6 Data validation

16.7 Validation techniques employed for market sizing

16.8 Data synthesis

16.9 360 degree market analysis

16.10 List of abbreviations

Research Methodology

Technavio presents a detailed picture of the market by way of study, synthesis, and summation of data from multiple sources. The analysts have presented the various facets of the market with a particular focus on identifying the key industry influencers. The data thus presented is comprehensive, reliable, and the result of extensive research, both primary and secondary.

INFORMATION SOURCES

Primary sources

  • Manufacturers and suppliers
  • Channel partners
  • Industry experts
  • Strategic decision makers

Secondary sources

  • Industry journals and periodicals
  • Government data
  • Financial reports of key industry players
  • Historical data
  • Press releases

DATA ANALYSIS

Data Synthesis

  • Collation of data
  • Estimation of key figures
  • Analysis of derived insights

Data Validation

  • Triangulation with data models
  • Reference against proprietary databases
  • Corroboration with industry experts

REPORT WRITING

Qualitative

  • Market drivers
  • Market challenges
  • Market trends
  • Five forces analysis

Quantitative

  • Market size and forecast
  • Market segmentation
  • Geographical insights
  • Competitive landscape

Interested in this report?

Get your sample now to see our research methodology and insights!

Download Now

Frequently Asked Questions

Fall Protection market growth will increase by USD 5877.4 million during 2026-2030.

The Fall Protection market is expected to grow at a CAGR of 14.5% during 2026-2030.

Fall Protection market is segmented by Product (Safety harness, Safety nets, Others) End-user (Construction, Energy and utilities, Oil and gas, Transportation, Others) Type (Personal fall protection, Collective fall protection, Access and rescue systems)

3M Co., ABS Safety GmbH, Adolf Wurth GmbH and Co. KG, Bergman and Beving AB, FallTech, French Creek Production Inc., Honeywell International Inc., KARAM Safety Pvt. Ltd., Kee Safety Systems and Services, Kennedy Wire Rope and Sling Co, Magid Glove and Safety Co, MSA Safety Inc., PETZL Distribution, Pure Safety Group Inc., Reliance Fall Protection, Safe Approach Inc., SafeWaze, Super Anchor Safety, Uviraj Group, Webb Rite Safety, Werner Co. are a few of the key vendors in the Fall Protection market.

APAC will register the highest growth rate of 34% among the other regions. Therefore, the Fall Protection market in APAC is expected to garner significant business opportunities for the vendors during the forecast period.

China, India, Japan, South Korea, Australia, Indonesia, US, Canada, Mexico, Germany, UK, France, Italy, Spain, The Netherlands, Saudi Arabia, UAE, South Africa, Turkey, Egypt, Brazil, Argentina, Chile

  • Intensification of occupational safety and enforcement frameworks is the driving factor this market.

The Fall Protection market vendors should focus on grabbing business opportunities from the Product segment as it accounted for the largest market share in the base year.