Family Entertainment Center Market Analysis, Size, and Forecast 2026-2030: North America (US, Canada, and Mexico), Europe (Germany, UK, and France), APAC (China, Japan, and India), South America (Brazil and Argentina), Middle East and Africa (Saudi Arabia, UAE, and South Africa), and Rest of World (ROW)

Family Entertainment Center Market Analysis, Size, and Forecast 2026-2030:
North America (US, Canada, and Mexico), Europe (Germany, UK, and France), APAC (China, Japan, and India), South America (Brazil and Argentina), Middle East and Africa (Saudi Arabia, UAE, and South Africa), and Rest of World (ROW)

Published: May 2026 328 Pages SKU: IRTNTR73659

Market Overview at a Glance

$38.32 B
Market Opportunity
14%
CAGR 2025 - 2030
34.9%
North America Growth
$20.16 B
Arcade studios segment 2024

Family Entertainment Center Market Size 2026-2030

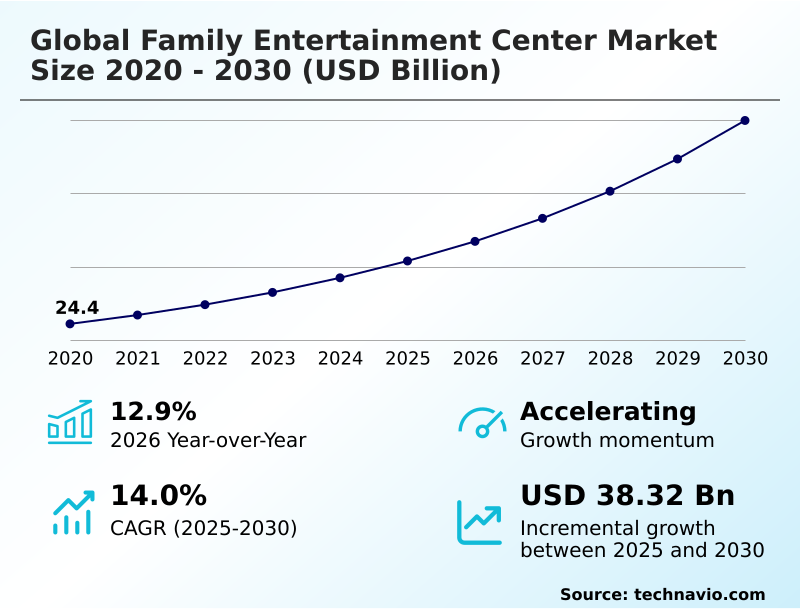
The family entertainment center market size is valued to increase by USD 38.32 billion, at a CAGR of 14% from 2025 to 2030. Expansion of AEI is augmenting market growth will drive the family entertainment center market.

Major Market Trends & Insights

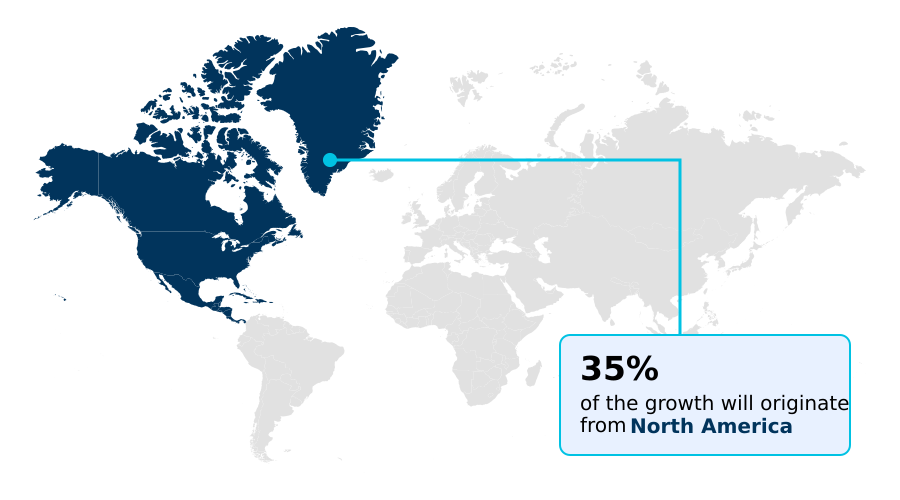
  • North America dominated the market and accounted for a 34.9% growth during the forecast period.
  • By Application - Arcade studios segment was valued at USD 20.16 billion in 2024
  • By Capacity - 10001 to 20000 square feet segment accounted for the largest market revenue share in 2024

Market Size & Forecast

  • Market Opportunities: USD 55.47 billion
  • Market Future Opportunities: USD 38.32 billion
  • CAGR from 2025 to 2030 : 14%

Market Summary

  • The Family Entertainment Center market is rapidly evolving beyond traditional leisure, becoming a hub for technology-driven social entertainment. Key market drivers include the rising demand for experiential entertainment and the expansion of amusement, entertainment, and indoor (AEI) recreation formats that blend physical and digital engagement.
  • Advanced attractions such as immersive VR arenas, multiplayer VR experiences, and interactive sports simulators are becoming standard. Operators are focusing on hybrid entertainment models that combine trampoline parks, bowling alleys, and soft play zones with high-tech competition games. However, high operational expenditure and the need for continuous innovation in themed entertainment zones present significant challenges.
  • For instance, a facility might leverage data-driven customer analytics to strategically place new redemption-based games, resulting in higher user engagement and a measurable lift in revenue per visitor without increasing its physical footprint, showcasing a move toward operational optimization and enhanced profitability.

What will be the Size of the Family Entertainment Center Market during the forecast period?

Get Key Insights on Market Forecast (PDF) Get Free Sample

How is the Family Entertainment Center Market Segmented?

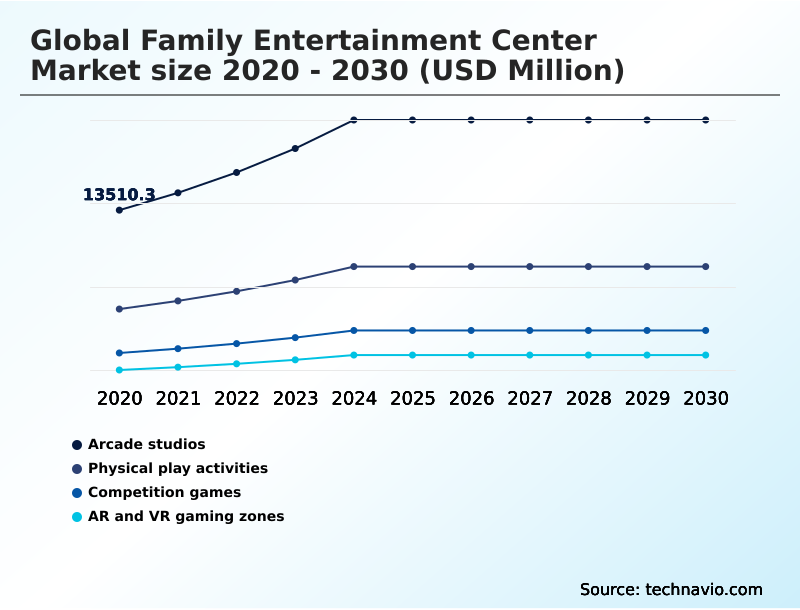
The family entertainment center industry research report provides comprehensive data (region-wise segment analysis), with forecasts and estimates in "USD million" for the period 2026-2030, as well as historical data from 2020-2024 for the following segments.

  • Application
    • Arcade studios
    • Physical play activities
    • Competition games
    • AR and VR gaming zones
  • Capacity
    • 10001 to 20000 square feet
    • More than 40000 square feet
    • 5001 to 10000 square feet
    • 20001 to 40000 square feet
    • Up to 5000 square feet
  • Age group
    • Teenagers (12-18)
    • Families with children (0-9)
    • Families with children (9-12)
    • Adults (24 and above)
    • Young adults (18-24)
  • Revenue stream
    • Entry fees and ticket sales
    • Food and beverages
    • Merchandising
    • Advertisement
  • Geography
    • North America
      • US
      • Canada
      • Mexico
    • Europe
      • Germany
      • UK
      • France
    • APAC
      • China
      • Japan
      • India
    • South America
      • Brazil
      • Argentina
    • Middle East and Africa
      • Saudi Arabia
      • UAE
      • South Africa
    • Rest of World (ROW)

By Application Insights

The arcade studios segment is estimated to witness significant growth during the forecast period.

The arcade studios segment is undergoing a significant transformation, evolving from simple game rooms to sophisticated entertainment hubs.

Modern facilities are pivotal for delivering shared social experiences, integrating a diverse mix of arcade gaming, virtual reality attractions, and redemption-based games to increase customer dwell time.

These venues are increasingly designed as family-oriented attractions, offering everything from classic bowling alleys to elaborate themed entertainment zones. This shift towards skill-based entertainment and group-based gaming is crucial for revenue diversification.

The use of competitive gaming formats in laser tag arenas and other attractions has proven to extend visitor engagement by over 20%, reinforcing the segment's role as a core component of the modern Family Entertainment Center.

Get Free Sample

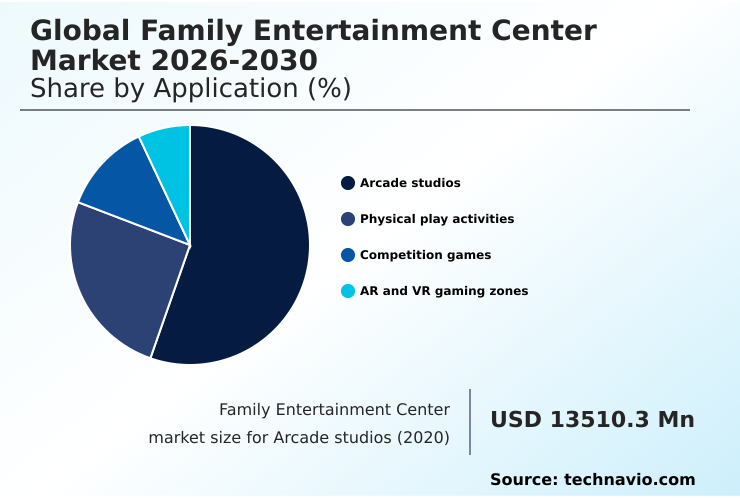
The Arcade studios segment was valued at USD 20.16 billion in 2024 and showed a gradual increase during the forecast period.

Get Free Sample

Regional Analysis

North America is estimated to contribute 34.9% to the growth of the global market during the forecast period.Technavio’s analysts have elaborately explained the regional trends and drivers that shape the market during the forecast period.

See How Family Entertainment Center Market Demand is Rising in North America Get Free Sample

The geographic landscape of the Family Entertainment Center market reflects varied adoption rates and consumer preferences. In North America, there is a strong emphasis on large-scale venues offering competitive virtual sports and high-speed electric indoor kart racing.

In contrast, the market in APAC is seeing faster growth, outpacing other regions by nearly 2 percentage points, driven by new themed infrastructure and a focus on story-driven simulations.

Venues are implementing stronger customer engagement strategies and a customer-centric service model to build brand recognition. This includes offering unique adventure rides and fantasy gaming zones that promote social interaction.

Enhanced safety and supervision protocols are paramount, with operators investing in technology-driven entertainment that also ensures a secure environment, thereby improving customer trust and retention.

Market Dynamics

Our researchers analyzed the data with 2025 as the base year, along with the key drivers, trends, and challenges. A holistic analysis of drivers will help companies refine their marketing strategies to gain a competitive advantage.

  • Strategic planning within the Family Entertainment Center market is now heavily focused on a variety of interconnected factors. Effective family entertainment center business models are crucial for navigating the competitive landscape. A key area of focus is the impact of technology on leisure facilities, which directly influences investment trends in leisure facilities.
  • Operators are closely examining VR integration in amusement parks and the associated arcade game maintenance and costs. To capture specific demographics, many are implementing teen-focused entertainment center design concepts. The core challenge remains balancing costs and revenue, requiring robust FEC operational efficiency strategies and techniques for optimizing FEC revenue per visitor.
  • Managing high maintenance costs in FECs is a constant battle, compelling a closer look at the profitability of bowling entertainment centers and other high-capital attractions. Simultaneously, aei recreation infrastructure development is creating new opportunities, demanding innovative marketing strategies for entertainment centers.
  • The role of edutainment in FECs is growing, influencing the design of themed indoor play areas and the structure of multi-activity entertainment hub design. This complex environment, with its seasonal visitor fluctuation management needs, has shown that facilities with integrated food and beverage services perform up to 25% better in terms of revenue per square foot compared to those without.
  • Adherence to safety standards for trampoline parks and other high-activity zones remains a non-negotiable aspect of customer engagement in entertainment venues, especially given the competition from home entertainment systems.

What are the key market drivers leading to the rise in the adoption of Family Entertainment Center Industry?

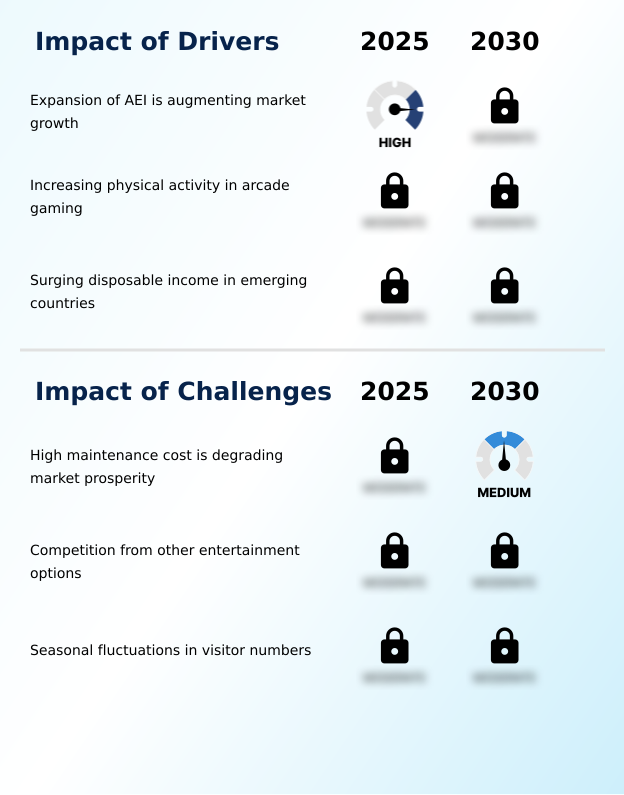
  • The expansion of amusement, entertainment, and indoor (AEI) recreation is a key driver augmenting market growth.

  • Market expansion is fundamentally driven by the consumer shift towards experiential entertainment and the development of comprehensive amusement facilities.
  • These indoor recreational spaces are evolving into multi-activity entertainment hubs that combine themed play areas, augmented reality attractions, and diverse food and beverage services to maximize revenue per visitor.
  • Enhanced user engagement is a critical factor, with operators focusing on creating attractions that encourage repeat visits and high levels of customer retention.
  • The success of corporate event hosting, for example, has been shown to increase overall facility utilization by over 25% annually.
  • This focus on social entertainment experiences is compelling operators to manage operational expenditure carefully while investing in facility modernization to maintain a competitive edge through superior customer service and safety and supervision.

What are the market trends shaping the Family Entertainment Center Industry?

  • The increasing integration of virtual reality within gaming applications is a significant trend. This development is accelerating overall market expansion.

  • A primary trend shaping the market is the deep integration of technology to enhance both operations and the customer journey. The adoption of cashless payment solutions and digital ticketing platforms is streamlining transactions, with facilities reporting up to a 40% reduction in queue times during peak hours.
  • Concurrently, operators are leveraging data-driven customer analytics to deploy dynamic pricing strategies, which have proven to boost off-peak attendance by 15-20%. The rise of hybrid entertainment models, combining physical attractions with digital elements like motion simulation systems and interactive sports simulators, is central to this evolution.
  • This is supported by facility modernization and the growth of franchise expansion models that rely on scalable, tech-forward blueprints for multiplayer VR experiences, creating a framework for sustained revenue diversification through sophisticated loyalty programs.

What challenges does the Family Entertainment Center Industry face during its growth?

  • High maintenance costs represent a key challenge, negatively impacting market prosperity and hindering industry growth.

  • Key challenges in the market revolve around balancing high operational expenditure with the need for continuous innovation to drive user engagement. Thinning profit margins are pressuring operators to refine their customer engagement strategies without compromising the quality of technology-driven entertainment.
  • The high cost of maintaining themed infrastructure for immersive gaming zones, AR and VR gaming zones, and indoor rides limits innovation budgets for many smaller players. This creates a competitive disadvantage, as strong brand recognition is often tied to the novelty and quality of physical play activities and interactive digital gaming.
  • To mitigate this, some operators are achieving a 10% reduction in maintenance overhead through predictive analytics. Success hinges on creating compelling social interaction and repeat visits, which is difficult when capital is constrained.

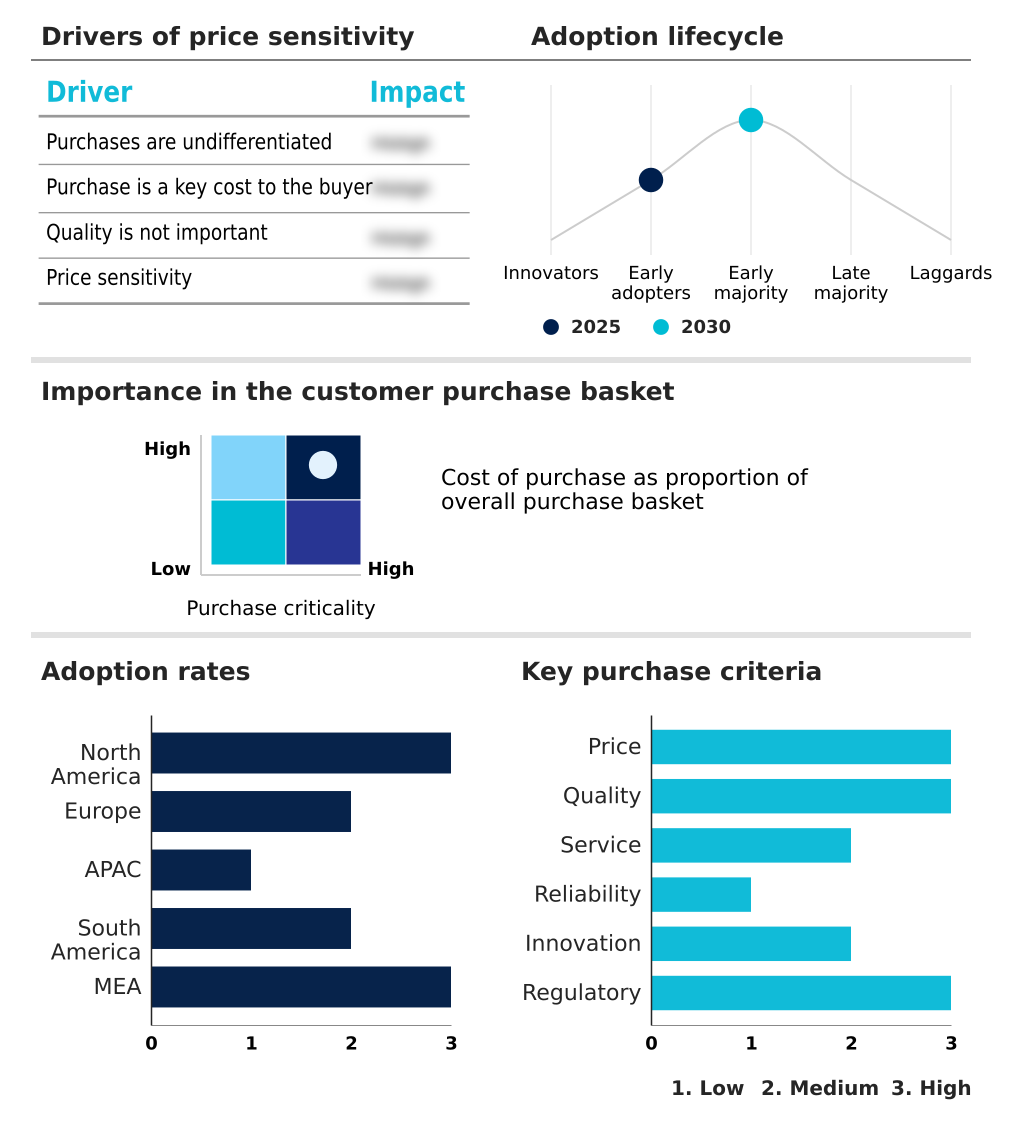
Exclusive Technavio Analysis on Customer Landscape

The family entertainment center market forecasting report includes the adoption lifecycle of the market, covering from the innovator’s stage to the laggard’s stage. It focuses on adoption rates in different regions based on penetration. Furthermore, the family entertainment center market report also includes key purchase criteria and drivers of price sensitivity to help companies evaluate and develop their market growth analysis strategies.

Customer Landscape of Family Entertainment Center Industry

Competitive Landscape

Companies are implementing various strategies, such as strategic alliances, family entertainment center market forecast, partnerships, mergers and acquisitions, geographical expansion, and product/service launches, to enhance their presence in the industry.

Andretti Indoor Karting and Games - Integrated amusement facilities and arcade gaming zones are leveraged with branded entertainment experiences to deliver comprehensive family entertainment solutions.

The industry research and growth report includes detailed analyses of the competitive landscape of the market and information about key companies, including:

  • Andretti Indoor Karting and Games
  • BANDAI NAMCO Europe S.A.S
  • Bowlero Corp.
  • CEC Entertainment Concepts L.P.
  • Cinergy Entertainment Group
  • Citymax Hotels Pvt. Ltd.
  • Dave and Busters Entertainment
  • Hollywood Bowl Group plc
  • KidZania S.A.P.I. de C.V.
  • Merlin Entertainments Ltd.
  • Nickels and Dimes Inc.
  • Round1 Entertainment Inc.
  • Scene 75 Entertainment Centers
  • Six Flags Entertainment Corp.
  • TEEG Australia Pty Ltd.
  • Tenpin Entertainment Ltd.
  • The Walt Disney Co.
  • Topgolf International Inc
  • Urban Air Trampoline
  • Veltmeijer Group

Qualitative and quantitative analysis of companies has been conducted to help clients understand the wider business environment as well as the strengths and weaknesses of key industry players. Data is qualitatively analyzed to categorize companies as pure play, category-focused, industry-focused, and diversified; it is quantitatively analyzed to categorize companies as dominant, leading, strong, tentative, and weak.

Recent Development and News in Family entertainment center market

  • In November 2024, Scene 75 Entertainment Centers expanded its AEI-driven facility by adding new immersive VR arenas and interactive sports simulators to enhance customer engagement.
  • In March 2025, CEC Entertainment Concepts L.P. disclosed increased maintenance and refurbishment expenses tied to arcade equipment and facility modernization across its Chuck E. Cheese venues.
  • In March 2025, Main Event Entertainment launched a new 15,000-square-foot center, expanding its mid-sized format with upgraded arcade gaming and compact bowling lanes.
  • In April 2025, The VOID partnered with major venue operators to expand its immersive VR experience zones across multiple locations in North America, signaling strong commercial adoption of VR technologies.

Dive into Technavio’s robust research methodology, blending expert interviews, extensive data synthesis, and validated models for unparalleled Family Entertainment Center Market insights. See full methodology.

Market Scope
Page number 328
Base year 2025
Historic period 2020-2024
Forecast period 2026-2030
Growth momentum & CAGR Accelerate at a CAGR of 14%
Market growth 2026-2030 USD 38323.6 million
Market structure Fragmented
YoY growth 2025-2026(%) 12.9%
Key countries US, Canada, Mexico, Germany, UK, France, Italy, Spain, The Netherlands, China, Japan, India, South Korea, Australia, Indonesia, Brazil, Argentina, Chile, Saudi Arabia, UAE, South Africa, Israel and Turkey
Competitive landscape Leading Companies, Market Positioning of Companies, Competitive Strategies, and Industry Risks

Request Free Sample

Research Analyst Overview

  • The Family Entertainment Center market is defined by a push toward technologically advanced, immersive experiences. Boardroom decisions increasingly center on the capital investment required for attractions like immersive VR arenas and high-speed electric indoor kart racing versus their projected return on engagement. The integration of amusement, entertainment and indoor (AEI) recreation with social entertainment is paramount.
  • Venues now combine traditional bowling alleys, trampoline parks, and laser tag arenas with high-tech motion simulation systems and virtual reality attractions. The goal is to create hybrid entertainment models offering a mix of physical play activities, competition games, and story-driven simulations. This requires a focus on edutainment, experiential entertainment, and collaborative gaming missions.
  • Operators are using themed entertainment zones, including fantasy gaming zones and AR and VR gaming zones with augmented reality attractions, to create unique indoor recreational spaces. The adoption of cashless payment solutions has been shown to reduce transaction times by up to 30%, improving throughput.
  • Key offerings like multiplayer VR experiences, indoor rides, and themed play areas, featuring sports challenges and redemption-based games, are essential for success in this dynamic environment.

What are the Key Data Covered in this Family Entertainment Center Market Research and Growth Report?

  • What is the expected growth of the Family Entertainment Center Market between 2026 and 2030?

    • USD 38.32 billion, at a CAGR of 14%

  • What segmentation does the market report cover?

    • The report is segmented by Application (Arcade studios, Physical play activities, Competition games, and AR and VR gaming zones), Capacity (10001 to 20000 square feet, More than 40000 square feet, 5001 to 10000 square feet, 20001 to 40000 square feet, and Up to 5000 square feet), Age Group (Teenagers (12-18), Families with children (0-9), Families with children (9-12), Adults (24 and above), and Young adults (18-24)), Revenue Stream (Entry fees and ticket sales, Food and beverages, Merchandising, and Advertisement) and Geography (North America, Europe, APAC, South America, Middle East and Africa)

  • Which regions are analyzed in the report?

    • North America, Europe, APAC, South America and Middle East and Africa

  • What are the key growth drivers and market challenges?

    • Expansion of AEI is augmenting market growth, High maintenance cost is degrading market prosperity

  • Who are the major players in the Family Entertainment Center Market?

    • Andretti Indoor Karting and Games, BANDAI NAMCO Europe S.A.S, Bowlero Corp., CEC Entertainment Concepts L.P., Cinergy Entertainment Group, Citymax Hotels Pvt. Ltd., Dave and Busters Entertainment, Hollywood Bowl Group plc, KidZania S.A.P.I. de C.V., Merlin Entertainments Ltd., Nickels and Dimes Inc., Round1 Entertainment Inc., Scene 75 Entertainment Centers, Six Flags Entertainment Corp., TEEG Australia Pty Ltd., Tenpin Entertainment Ltd., The Walt Disney Co., Topgolf International Inc, Urban Air Trampoline and Veltmeijer Group

Market Research Insights

  • The market's momentum is increasingly defined by strategic operational adjustments that enhance the visitor experience and bolster financial performance. Operators are adopting dynamic pricing strategies and sophisticated loyalty programs to smooth out demand fluctuations and encourage repeat business, with some achieving a 10-15% uplift in off-peak revenue.
  • The implementation of digital ticketing platforms and fully integrated cashless payment solutions has streamlined entry and in-venue purchases, reducing wait times by over 30% in high-traffic locations. Furthermore, data-driven customer analytics are empowering franchise expansion models, enabling targeted marketing and optimized attraction mixes that align with local demographic preferences, strengthening both customer retention and overall profitability.

We can help! Our analysts can customize this family entertainment center market research report to meet your requirements.

Get in touch

1. Executive Summary

1.1 Market overview

Executive Summary - Chart on Market Overview
Executive Summary - Data Table on Market Overview
Executive Summary - Chart on Global Market Characteristics
Executive Summary - Chart on Market by Geography
Executive Summary - Chart on Market Segmentation by Application
Executive Summary - Chart on Market Segmentation by Capacity
Executive Summary - Chart on Market Segmentation by Age Group
Executive Summary - Chart on Market Segmentation by Revenue Stream
Executive Summary - Chart on Incremental Growth
Executive Summary - Data Table on Incremental Growth
Executive Summary - Chart on Company Market Positioning

2. Technavio Analysis

2.1 Analysis of price sensitivity, lifecycle, customer purchase basket, adoption rates, and purchase criteria

2.2 Criticality of inputs and Factors of differentiation

Chart on Overview on criticality of inputs and factors of differentiation

2.3 Factors of disruption

Chart on Overview on factors of disruption

2.4 Impact of drivers and challenges

Chart on Impact of drivers and challenges in 2025 and 2030

3. Market Landscape

3.1 Market ecosystem

Chart on Parent Market
Data Table on - Parent Market

3.2 Market characteristics

Chart on Market characteristics analysis

3.3 Value chain analysis

Chart on Value chain analysis

4. Market Sizing

4.1 Market definition

Data Table on Offerings of companies included in the market definition

4.2 Market segment analysis

Market segments

4.3 Market size 2025

4.4 Market outlook: Forecast for 2025-2030

Chart on Global - Market size and forecast 2025-2030 ($ million)
Data Table on Global - Market size and forecast 2025-2030 ($ million)
Chart on Global Market: Year-over-year growth 2025-2030 (%)
Data Table on Global Market: Year-over-year growth 2025-2030 (%)

5. Historic Market Size

5.1 Global Family Entertainment Center Market 2020 - 2024

Historic Market Size - Data Table on Global Family Entertainment Center Market 2020 - 2024 ($ million)

5.2 Application segment analysis 2020 - 2024

Historic Market Size - Application Segment 2020 - 2024 ($ million)

5.3 Capacity segment analysis 2020 - 2024

Historic Market Size - Capacity Segment 2020 - 2024 ($ million)

5.4 Age Group segment analysis 2020 - 2024

Historic Market Size - Age Group Segment 2020 - 2024 ($ million)

5.5 Revenue Stream segment analysis 2020 - 2024

Historic Market Size - Revenue Stream Segment 2020 - 2024 ($ million)

5.6 Geography segment analysis 2020 - 2024

Historic Market Size - Geography Segment 2020 - 2024 ($ million)

5.7 Country segment analysis 2020 - 2024

Historic Market Size - Country Segment 2020 - 2024 ($ million)

6. Qualitative Analysis

6.1 Impact of AI on the Global Family Entertainment Center Market

6.2 Impact of Geopolitical Conflicts on the Global Family Entertainment Center Market

7. Five Forces Analysis

7.1 Five forces summary

Five forces analysis - Comparison between 2025 and 2030

7.2 Bargaining power of buyers

Bargaining power of buyers - Impact of key factors 2025 and 2030

7.3 Bargaining power of suppliers

Bargaining power of suppliers - Impact of key factors in 2025 and 2030

7.4 Threat of new entrants

Threat of new entrants - Impact of key factors in 2025 and 2030

7.5 Threat of substitutes

Threat of substitutes - Impact of key factors in 2025 and 2030

7.6 Threat of rivalry

Threat of rivalry - Impact of key factors in 2025 and 2030

7.7 Market condition

Chart on Market condition - Five forces 2025 and 2030

8. Market Segmentation by Application

8.1 Market segments

Chart on Application - Market share 2025-2030 (%)
Data Table on Application - Market share 2025-2030 (%)

8.2 Comparison by Application

Chart on Comparison by Application
Data Table on Comparison by Application

8.3 Arcade studios - Market size and forecast 2025-2030

Chart on Arcade studios - Market size and forecast 2025-2030 ($ million)
Data Table on Arcade studios - Market size and forecast 2025-2030 ($ million)
Chart on Arcade studios - Year-over-year growth 2025-2030 (%)
Data Table on Arcade studios - Year-over-year growth 2025-2030 (%)

8.4 Physical play activities - Market size and forecast 2025-2030

Chart on Physical play activities - Market size and forecast 2025-2030 ($ million)
Data Table on Physical play activities - Market size and forecast 2025-2030 ($ million)
Chart on Physical play activities - Year-over-year growth 2025-2030 (%)
Data Table on Physical play activities - Year-over-year growth 2025-2030 (%)

8.5 Competition games - Market size and forecast 2025-2030

Chart on Competition games - Market size and forecast 2025-2030 ($ million)
Data Table on Competition games - Market size and forecast 2025-2030 ($ million)
Chart on Competition games - Year-over-year growth 2025-2030 (%)
Data Table on Competition games - Year-over-year growth 2025-2030 (%)

8.6 AR and VR gaming zones - Market size and forecast 2025-2030

Chart on AR and VR gaming zones - Market size and forecast 2025-2030 ($ million)
Data Table on AR and VR gaming zones - Market size and forecast 2025-2030 ($ million)
Chart on AR and VR gaming zones - Year-over-year growth 2025-2030 (%)
Data Table on AR and VR gaming zones - Year-over-year growth 2025-2030 (%)

8.7 Market opportunity by Application

Market opportunity by Application ($ million)
Data Table on Market opportunity by Application ($ million)

9. Market Segmentation by Capacity

9.1 Market segments

Chart on Capacity - Market share 2025-2030 (%)
Data Table on Capacity - Market share 2025-2030 (%)

9.2 Comparison by Capacity

Chart on Comparison by Capacity
Data Table on Comparison by Capacity

9.3 10001 to 20000 square feet - Market size and forecast 2025-2030

Chart on 10001 to 20000 square feet - Market size and forecast 2025-2030 ($ million)
Data Table on 10001 to 20000 square feet - Market size and forecast 2025-2030 ($ million)
Chart on 10001 to 20000 square feet - Year-over-year growth 2025-2030 (%)
Data Table on 10001 to 20000 square feet - Year-over-year growth 2025-2030 (%)

9.4 More than 40000 square feet - Market size and forecast 2025-2030

Chart on More than 40000 square feet - Market size and forecast 2025-2030 ($ million)
Data Table on More than 40000 square feet - Market size and forecast 2025-2030 ($ million)
Chart on More than 40000 square feet - Year-over-year growth 2025-2030 (%)
Data Table on More than 40000 square feet - Year-over-year growth 2025-2030 (%)

9.5 5001 to 10000 square feet - Market size and forecast 2025-2030

Chart on 5001 to 10000 square feet - Market size and forecast 2025-2030 ($ million)
Data Table on 5001 to 10000 square feet - Market size and forecast 2025-2030 ($ million)
Chart on 5001 to 10000 square feet - Year-over-year growth 2025-2030 (%)
Data Table on 5001 to 10000 square feet - Year-over-year growth 2025-2030 (%)

9.6 20001 to 40000 square feet - Market size and forecast 2025-2030

Chart on 20001 to 40000 square feet - Market size and forecast 2025-2030 ($ million)
Data Table on 20001 to 40000 square feet - Market size and forecast 2025-2030 ($ million)
Chart on 20001 to 40000 square feet - Year-over-year growth 2025-2030 (%)
Data Table on 20001 to 40000 square feet - Year-over-year growth 2025-2030 (%)

9.7 Up to 5000 square feet - Market size and forecast 2025-2030

Chart on Up to 5000 square feet - Market size and forecast 2025-2030 ($ million)
Data Table on Up to 5000 square feet - Market size and forecast 2025-2030 ($ million)
Chart on Up to 5000 square feet - Year-over-year growth 2025-2030 (%)
Data Table on Up to 5000 square feet - Year-over-year growth 2025-2030 (%)

9.8 Market opportunity by Capacity

Market opportunity by Capacity ($ million)
Data Table on Market opportunity by Capacity ($ million)

10. Market Segmentation by Age Group

10.1 Market segments

Chart on Age Group - Market share 2025-2030 (%)
Data Table on Age Group - Market share 2025-2030 (%)

10.2 Comparison by Age Group

Chart on Comparison by Age Group
Data Table on Comparison by Age Group

10.3 Teenagers (12-18) - Market size and forecast 2025-2030

Chart on Teenagers (12-18) - Market size and forecast 2025-2030 ($ million)
Data Table on Teenagers (12-18) - Market size and forecast 2025-2030 ($ million)
Chart on Teenagers (12-18) - Year-over-year growth 2025-2030 (%)
Data Table on Teenagers (12-18) - Year-over-year growth 2025-2030 (%)

10.4 Families with children (0-9) - Market size and forecast 2025-2030

Chart on Families with children (0-9) - Market size and forecast 2025-2030 ($ million)
Data Table on Families with children (0-9) - Market size and forecast 2025-2030 ($ million)
Chart on Families with children (0-9) - Year-over-year growth 2025-2030 (%)
Data Table on Families with children (0-9) - Year-over-year growth 2025-2030 (%)

10.5 Families with children (9-12) - Market size and forecast 2025-2030

Chart on Families with children (9-12) - Market size and forecast 2025-2030 ($ million)
Data Table on Families with children (9-12) - Market size and forecast 2025-2030 ($ million)
Chart on Families with children (9-12) - Year-over-year growth 2025-2030 (%)
Data Table on Families with children (9-12) - Year-over-year growth 2025-2030 (%)

10.6 Adults (24 and above) - Market size and forecast 2025-2030

Chart on Adults (24 and above) - Market size and forecast 2025-2030 ($ million)
Data Table on Adults (24 and above) - Market size and forecast 2025-2030 ($ million)
Chart on Adults (24 and above) - Year-over-year growth 2025-2030 (%)
Data Table on Adults (24 and above) - Year-over-year growth 2025-2030 (%)

10.7 Young adults (18-24) - Market size and forecast 2025-2030

Chart on Young adults (18-24) - Market size and forecast 2025-2030 ($ million)
Data Table on Young adults (18-24) - Market size and forecast 2025-2030 ($ million)
Chart on Young adults (18-24) - Year-over-year growth 2025-2030 (%)
Data Table on Young adults (18-24) - Year-over-year growth 2025-2030 (%)

10.8 Market opportunity by Age Group

Market opportunity by Age Group ($ million)
Data Table on Market opportunity by Age Group ($ million)

11. Market Segmentation by Revenue Stream

11.1 Market segments

Chart on Revenue Stream - Market share 2025-2030 (%)
Data Table on Revenue Stream - Market share 2025-2030 (%)

11.2 Comparison by Revenue Stream

Chart on Comparison by Revenue Stream
Data Table on Comparison by Revenue Stream

11.3 Entry fees and ticket sales - Market size and forecast 2025-2030

Chart on Entry fees and ticket sales - Market size and forecast 2025-2030 ($ million)
Data Table on Entry fees and ticket sales - Market size and forecast 2025-2030 ($ million)
Chart on Entry fees and ticket sales - Year-over-year growth 2025-2030 (%)
Data Table on Entry fees and ticket sales - Year-over-year growth 2025-2030 (%)

11.4 Food and beverages - Market size and forecast 2025-2030

Chart on Food and beverages - Market size and forecast 2025-2030 ($ million)
Data Table on Food and beverages - Market size and forecast 2025-2030 ($ million)
Chart on Food and beverages - Year-over-year growth 2025-2030 (%)
Data Table on Food and beverages - Year-over-year growth 2025-2030 (%)

11.5 Merchandising - Market size and forecast 2025-2030

Chart on Merchandising - Market size and forecast 2025-2030 ($ million)
Data Table on Merchandising - Market size and forecast 2025-2030 ($ million)
Chart on Merchandising - Year-over-year growth 2025-2030 (%)
Data Table on Merchandising - Year-over-year growth 2025-2030 (%)

11.6 Advertisement - Market size and forecast 2025-2030

Chart on Advertisement - Market size and forecast 2025-2030 ($ million)
Data Table on Advertisement - Market size and forecast 2025-2030 ($ million)
Chart on Advertisement - Year-over-year growth 2025-2030 (%)
Data Table on Advertisement - Year-over-year growth 2025-2030 (%)

11.7 Market opportunity by Revenue Stream

Market opportunity by Revenue Stream ($ million)
Data Table on Market opportunity by Revenue Stream ($ million)

12. Customer Landscape

12.1 Customer landscape overview

Analysis of price sensitivity, lifecycle, customer purchase basket, adoption rates, and purchase criteria

13. Geographic Landscape

13.1 Geographic segmentation

Chart on Market share by geography 2025-2030 (%)
Data Table on Market share by geography 2025-2030 (%)

13.2 Geographic comparison

Chart on Geographic comparison
Data Table on Geographic comparison

13.3 North America - Market size and forecast 2025-2030

Chart on North America - Market size and forecast 2025-2030 ($ million)
Data Table on North America - Market size and forecast 2025-2030 ($ million)
Chart on North America - Year-over-year growth 2025-2030 (%)
Data Table on North America - Year-over-year growth 2025-2030 (%)
Chart on Regional Comparison - North America
Data Table on Regional Comparison - North America

13.3.1 US - Market size and forecast 2025-2030

Chart on US - Market size and forecast 2025-2030 ($ million)
Data Table on US - Market size and forecast 2025-2030 ($ million)
Chart on US - Year-over-year growth 2025-2030 (%)
Data Table on US - Year-over-year growth 2025-2030 (%)

13.3.2 Canada - Market size and forecast 2025-2030

Chart on Canada - Market size and forecast 2025-2030 ($ million)
Data Table on Canada - Market size and forecast 2025-2030 ($ million)
Chart on Canada - Year-over-year growth 2025-2030 (%)
Data Table on Canada - Year-over-year growth 2025-2030 (%)

13.3.3 Mexico - Market size and forecast 2025-2030

Chart on Mexico - Market size and forecast 2025-2030 ($ million)
Data Table on Mexico - Market size and forecast 2025-2030 ($ million)
Chart on Mexico - Year-over-year growth 2025-2030 (%)
Data Table on Mexico - Year-over-year growth 2025-2030 (%)

13.4 Europe - Market size and forecast 2025-2030

Chart on Europe - Market size and forecast 2025-2030 ($ million)
Data Table on Europe - Market size and forecast 2025-2030 ($ million)
Chart on Europe - Year-over-year growth 2025-2030 (%)
Data Table on Europe - Year-over-year growth 2025-2030 (%)
Chart on Regional Comparison - Europe
Data Table on Regional Comparison - Europe

13.4.1 Germany - Market size and forecast 2025-2030

Chart on Germany - Market size and forecast 2025-2030 ($ million)
Data Table on Germany - Market size and forecast 2025-2030 ($ million)
Chart on Germany - Year-over-year growth 2025-2030 (%)
Data Table on Germany - Year-over-year growth 2025-2030 (%)

13.4.2 UK - Market size and forecast 2025-2030

Chart on UK - Market size and forecast 2025-2030 ($ million)
Data Table on UK - Market size and forecast 2025-2030 ($ million)
Chart on UK - Year-over-year growth 2025-2030 (%)
Data Table on UK - Year-over-year growth 2025-2030 (%)

13.4.3 France - Market size and forecast 2025-2030

Chart on France - Market size and forecast 2025-2030 ($ million)
Data Table on France - Market size and forecast 2025-2030 ($ million)
Chart on France - Year-over-year growth 2025-2030 (%)
Data Table on France - Year-over-year growth 2025-2030 (%)

13.4.4 Italy - Market size and forecast 2025-2030

Chart on Italy - Market size and forecast 2025-2030 ($ million)
Data Table on Italy - Market size and forecast 2025-2030 ($ million)
Chart on Italy - Year-over-year growth 2025-2030 (%)
Data Table on Italy - Year-over-year growth 2025-2030 (%)

13.4.5 Spain - Market size and forecast 2025-2030

Chart on Spain - Market size and forecast 2025-2030 ($ million)
Data Table on Spain - Market size and forecast 2025-2030 ($ million)
Chart on Spain - Year-over-year growth 2025-2030 (%)
Data Table on Spain - Year-over-year growth 2025-2030 (%)

13.4.6 The Netherlands - Market size and forecast 2025-2030

Chart on The Netherlands - Market size and forecast 2025-2030 ($ million)
Data Table on The Netherlands - Market size and forecast 2025-2030 ($ million)
Chart on The Netherlands - Year-over-year growth 2025-2030 (%)
Data Table on The Netherlands - Year-over-year growth 2025-2030 (%)

13.5 APAC - Market size and forecast 2025-2030

Chart on APAC - Market size and forecast 2025-2030 ($ million)
Data Table on APAC - Market size and forecast 2025-2030 ($ million)
Chart on APAC - Year-over-year growth 2025-2030 (%)
Data Table on APAC - Year-over-year growth 2025-2030 (%)
Chart on Regional Comparison - APAC
Data Table on Regional Comparison - APAC

13.5.1 China - Market size and forecast 2025-2030

Chart on China - Market size and forecast 2025-2030 ($ million)
Data Table on China - Market size and forecast 2025-2030 ($ million)
Chart on China - Year-over-year growth 2025-2030 (%)
Data Table on China - Year-over-year growth 2025-2030 (%)

13.5.2 Japan - Market size and forecast 2025-2030

Chart on Japan - Market size and forecast 2025-2030 ($ million)
Data Table on Japan - Market size and forecast 2025-2030 ($ million)
Chart on Japan - Year-over-year growth 2025-2030 (%)
Data Table on Japan - Year-over-year growth 2025-2030 (%)

13.5.3 India - Market size and forecast 2025-2030

Chart on India - Market size and forecast 2025-2030 ($ million)
Data Table on India - Market size and forecast 2025-2030 ($ million)
Chart on India - Year-over-year growth 2025-2030 (%)
Data Table on India - Year-over-year growth 2025-2030 (%)

13.5.4 South Korea - Market size and forecast 2025-2030

Chart on South Korea - Market size and forecast 2025-2030 ($ million)
Data Table on South Korea - Market size and forecast 2025-2030 ($ million)
Chart on South Korea - Year-over-year growth 2025-2030 (%)
Data Table on South Korea - Year-over-year growth 2025-2030 (%)

13.5.5 Australia - Market size and forecast 2025-2030

Chart on Australia - Market size and forecast 2025-2030 ($ million)
Data Table on Australia - Market size and forecast 2025-2030 ($ million)
Chart on Australia - Year-over-year growth 2025-2030 (%)
Data Table on Australia - Year-over-year growth 2025-2030 (%)

13.5.6 Indonesia - Market size and forecast 2025-2030

Chart on Indonesia - Market size and forecast 2025-2030 ($ million)
Data Table on Indonesia - Market size and forecast 2025-2030 ($ million)
Chart on Indonesia - Year-over-year growth 2025-2030 (%)
Data Table on Indonesia - Year-over-year growth 2025-2030 (%)

13.6 South America - Market size and forecast 2025-2030

Chart on South America - Market size and forecast 2025-2030 ($ million)
Data Table on South America - Market size and forecast 2025-2030 ($ million)
Chart on South America - Year-over-year growth 2025-2030 (%)
Data Table on South America - Year-over-year growth 2025-2030 (%)
Chart on Regional Comparison - South America
Data Table on Regional Comparison - South America

13.6.1 Brazil - Market size and forecast 2025-2030

Chart on Brazil - Market size and forecast 2025-2030 ($ million)
Data Table on Brazil - Market size and forecast 2025-2030 ($ million)
Chart on Brazil - Year-over-year growth 2025-2030 (%)
Data Table on Brazil - Year-over-year growth 2025-2030 (%)

13.6.2 Argentina - Market size and forecast 2025-2030

Chart on Argentina - Market size and forecast 2025-2030 ($ million)
Data Table on Argentina - Market size and forecast 2025-2030 ($ million)
Chart on Argentina - Year-over-year growth 2025-2030 (%)
Data Table on Argentina - Year-over-year growth 2025-2030 (%)

13.6.3 Chile - Market size and forecast 2025-2030

Chart on Chile - Market size and forecast 2025-2030 ($ million)
Data Table on Chile - Market size and forecast 2025-2030 ($ million)
Chart on Chile - Year-over-year growth 2025-2030 (%)
Data Table on Chile - Year-over-year growth 2025-2030 (%)

13.7 Middle East and Africa - Market size and forecast 2025-2030

Chart on Middle East and Africa - Market size and forecast 2025-2030 ($ million)
Data Table on Middle East and Africa - Market size and forecast 2025-2030 ($ million)
Chart on Middle East and Africa - Year-over-year growth 2025-2030 (%)
Data Table on Middle East and Africa - Year-over-year growth 2025-2030 (%)
Chart on Regional Comparison - Middle East and Africa
Data Table on Regional Comparison - Middle East and Africa

13.7.1 Saudi Arabia - Market size and forecast 2025-2030

Chart on Saudi Arabia - Market size and forecast 2025-2030 ($ million)
Data Table on Saudi Arabia - Market size and forecast 2025-2030 ($ million)
Chart on Saudi Arabia - Year-over-year growth 2025-2030 (%)
Data Table on Saudi Arabia - Year-over-year growth 2025-2030 (%)

13.7.2 UAE - Market size and forecast 2025-2030

Chart on UAE - Market size and forecast 2025-2030 ($ million)
Data Table on UAE - Market size and forecast 2025-2030 ($ million)
Chart on UAE - Year-over-year growth 2025-2030 (%)
Data Table on UAE - Year-over-year growth 2025-2030 (%)

13.7.3 South Africa - Market size and forecast 2025-2030

Chart on South Africa - Market size and forecast 2025-2030 ($ million)
Data Table on South Africa - Market size and forecast 2025-2030 ($ million)
Chart on South Africa - Year-over-year growth 2025-2030 (%)
Data Table on South Africa - Year-over-year growth 2025-2030 (%)

13.7.4 Israel - Market size and forecast 2025-2030

Chart on Israel - Market size and forecast 2025-2030 ($ million)
Data Table on Israel - Market size and forecast 2025-2030 ($ million)
Chart on Israel - Year-over-year growth 2025-2030 (%)
Data Table on Israel - Year-over-year growth 2025-2030 (%)

13.7.5 Turkey - Market size and forecast 2025-2030

Chart on Turkey - Market size and forecast 2025-2030 ($ million)
Data Table on Turkey - Market size and forecast 2025-2030 ($ million)
Chart on Turkey - Year-over-year growth 2025-2030 (%)
Data Table on Turkey - Year-over-year growth 2025-2030 (%)

13.8 Market opportunity by geography

Market opportunity by geography ($ million)
Data Tables on Market opportunity by geography ($ million)

14. Drivers, Challenges, and Opportunity

14.1 Market drivers

Expansion of AEI is augmenting market growth
Increasing physical activity in arcade gaming
Surging disposable income in emerging countries

14.2 Market challenges

High maintenance cost is degrading market prosperity
Competition from other entertainment options
Seasonal fluctuations in visitor numbers

14.3 Impact of drivers and challenges

Impact of drivers and challenges in 2025 and 2030

14.4 Market opportunities

Rising integration of VR in games is expediting market growth
Strategic alliance and partnership
Launch of new arcade games

15. Competitive Landscape

15.1 Overview

15.2

Overview on criticality of inputs and factors of differentiation

15.3 Landscape disruption

Overview on factors of disruption

15.4 Industry risks

Impact of key risks on business

16. Competitive Analysis

16.1 Companies profiled

Companies covered

16.2 Company ranking index

16.3 Market positioning of companies

Matrix on companies position and classification

16.4 BANDAI NAMCO Europe S.A.S

BANDAI NAMCO Europe S.A.S - Overview
BANDAI NAMCO Europe S.A.S - Product / Service
BANDAI NAMCO Europe S.A.S - Key offerings
SWOT

16.5 Bowlero Corp.

Bowlero Corp. - Overview
Bowlero Corp. - Product / Service
Bowlero Corp. - Key offerings
SWOT

16.6 CEC Entertainment Concepts L.P.

CEC Entertainment Concepts L.P. - Overview
CEC Entertainment Concepts L.P. - Product / Service
CEC Entertainment Concepts L.P. - Key offerings
SWOT

16.7 Cinergy Entertainment Group

Cinergy Entertainment Group - Overview
Cinergy Entertainment Group - Product / Service
Cinergy Entertainment Group - Key offerings
SWOT

16.8 Dave and Busters Entertainment

Dave and Busters Entertainment - Overview
Dave and Busters Entertainment - Product / Service
Dave and Busters Entertainment - Key offerings
SWOT

16.9 Hollywood Bowl Group plc

Hollywood Bowl Group plc - Overview
Hollywood Bowl Group plc - Product / Service
Hollywood Bowl Group plc - Key offerings
SWOT

16.10 KidZania S.A.P.I. de C.V.

KidZania S.A.P.I. de C.V. - Overview
KidZania S.A.P.I. de C.V. - Product / Service
KidZania S.A.P.I. de C.V. - Key offerings
SWOT

16.11 Merlin Entertainments Ltd.

Merlin Entertainments Ltd. - Overview
Merlin Entertainments Ltd. - Product / Service
Merlin Entertainments Ltd. - Key offerings
SWOT

16.12 Nickels and Dimes Inc.

Nickels and Dimes Inc. - Overview
Nickels and Dimes Inc. - Product / Service
Nickels and Dimes Inc. - Key offerings
SWOT

16.13 Round1 Entertainment Inc.

Round1 Entertainment Inc. - Overview
Round1 Entertainment Inc. - Product / Service
Round1 Entertainment Inc. - Key offerings
SWOT

16.14 Scene 75 Entertainment Centers

Scene 75 Entertainment Centers - Overview
Scene 75 Entertainment Centers - Product / Service
Scene 75 Entertainment Centers - Key offerings
SWOT

16.15 Six Flags Entertainment Corp.

Six Flags Entertainment Corp. - Overview
Six Flags Entertainment Corp. - Product / Service
Six Flags Entertainment Corp. - Key offerings
SWOT

16.16 TEEG Australia Pty Ltd.

TEEG Australia Pty Ltd. - Overview
TEEG Australia Pty Ltd. - Product / Service
TEEG Australia Pty Ltd. - Key offerings
SWOT

16.17 Tenpin Entertainment Ltd.

Tenpin Entertainment Ltd. - Overview
Tenpin Entertainment Ltd. - Product / Service
Tenpin Entertainment Ltd. - Key offerings
SWOT

16.18 The Walt Disney Co.

The Walt Disney Co. - Overview
The Walt Disney Co. - Business segments
The Walt Disney Co. - Key offerings
The Walt Disney Co. - Segment focus
SWOT

17. Appendix

17.1 Scope of the report

Market definition
Objectives
Notes and caveats

17.2 Inclusions and exclusions checklist

Inclusions checklist
Exclusions checklist

17.3 Currency conversion rates for US$

17.4 Research methodology

17.5 Data procurement

Information sources

17.6 Data validation

17.7 Validation techniques employed for market sizing

17.8 Data synthesis

17.9 360 degree market analysis

17.10 List of abbreviations

Research Methodology

Technavio presents a detailed picture of the market by way of study, synthesis, and summation of data from multiple sources. The analysts have presented the various facets of the market with a particular focus on identifying the key industry influencers. The data thus presented is comprehensive, reliable, and the result of extensive research, both primary and secondary.

INFORMATION SOURCES

Primary sources

  • Manufacturers and suppliers
  • Channel partners
  • Industry experts
  • Strategic decision makers

Secondary sources

  • Industry journals and periodicals
  • Government data
  • Financial reports of key industry players
  • Historical data
  • Press releases

DATA ANALYSIS

Data Synthesis

  • Collation of data
  • Estimation of key figures
  • Analysis of derived insights

Data Validation

  • Triangulation with data models
  • Reference against proprietary databases
  • Corroboration with industry experts

REPORT WRITING

Qualitative

  • Market drivers
  • Market challenges
  • Market trends
  • Five forces analysis

Quantitative

  • Market size and forecast
  • Market segmentation
  • Geographical insights
  • Competitive landscape

Interested in this report?

Get your sample now to see our research methodology and insights!

Download Now

Frequently Asked Questions

Family Entertainment Center market growth will increase by USD 38323.6 million during 2026-2030.

The Family Entertainment Center market is expected to grow at a CAGR of 14% during 2026-2030.

Family Entertainment Center market is segmented by Application (Arcade studios, Physical play activities, Competition games, AR and VR gaming zones) Capacity (10001 to 20000 square feet, More than 40000 square feet, 5001 to 10000 square feet, 20001 to 40000 square feet, Up to 5000 square feet) Age group (Teenagers (12-18), Families with children (0-9), Families with children (9-12), Adults (24 and above), Young adults (18-24)) Revenue stream (Entry fees and ticket sales, Food and beverages, Merchandising, Advertisement)

Andretti Indoor Karting and Games, BANDAI NAMCO Europe S.A.S, Bowlero Corp., CEC Entertainment Concepts L.P., Cinergy Entertainment Group, Citymax Hotels Pvt. Ltd., Dave and Busters Entertainment, Hollywood Bowl Group plc, KidZania S.A.P.I. de C.V., Merlin Entertainments Ltd., Nickels and Dimes Inc., Round1 Entertainment Inc., Scene 75 Entertainment Centers, Six Flags Entertainment Corp., TEEG Australia Pty Ltd., Tenpin Entertainment Ltd., The Walt Disney Co., Topgolf International Inc, Urban Air Trampoline, Veltmeijer Group are a few of the key vendors in the Family Entertainment Center market.

North America will register the highest growth rate of 34.9% among the other regions. Therefore, the Family Entertainment Center market in North America is expected to garner significant business opportunities for the vendors during the forecast period.

US, Canada, Mexico, Germany, UK, France, Italy, Spain, The Netherlands, China, Japan, India, South Korea, Australia, Indonesia, Brazil, Argentina, Chile, Saudi Arabia, UAE, South Africa, Israel, Turkey

  • Expansion of AEI is augmenting market growth is the driving factor this market.

The Family Entertainment Center market vendors should focus on grabbing business opportunities from the Application segment as it accounted for the largest market share in the base year.
RIA - Research AI Assistant
Ask RIA