Fatigue Sensing Wearables Market In Automotive Sector Size 2024-2028
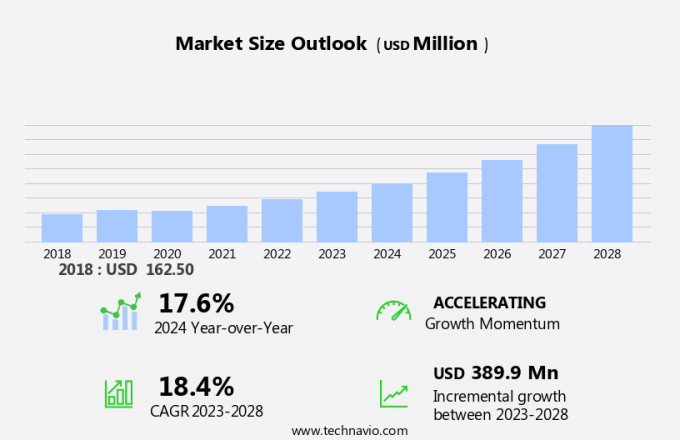
The fatigue sensing wearables market in automotive sector size is forecast to increase by USD 389.9 million at a CAGR of 18.4% between 2023 and 2028.
- The fatigue sensing wearables market In the automotive sector is experiencing significant growth, driven by new product launches and partnerships between key industry players. These collaborations are aimed at advancing technology and expanding the reach of fatigue-sensing wearables In the automotive industry. However, the market faces challenges in gaining widespread acceptance due to consumer skepticism and concerns over privacy and data security. Despite these hurdles, the potential benefits of fatigue sensing wearables, such as improved road safety and reduced driver fatigue, make it an attractive area for innovation and investment. As the market continues to evolve, stakeholders need to stay informed of the latest trends and developments to remain competitive.
What will be the Size of the Fatigue Sensing Wearables Market In Automotive Sector During the Forecast Period?
- The fatigue sensing wearables market In the automotive sector is experiencing significant growth due to increasing concerns over driver safety and the integration of autonomous driving technologies. Wearable devices, including wristbands, headbands, and clip-ons, employ various sensing capabilities such as electroencephalography (EEG), electrocardiography (ECG), electromyography (EMG), photoplethysmography (PPG), and others, to measure physiological signals indicative of driver fatigue. These data are subjected to data analytics, machine learning algorithms, and artificial intelligence for real-time assessment of driver fatigue levels.
- Integration with vehicle systems and connected vehicles enables seamless data transfer and analysis, enhancing overall safety. However, privacy concerns and data security are crucial factors influencing market growth. Brainwave-based measurement through EEG is gaining popularity due to its ability to provide more accurate and reliable results. User-friendly interfaces and customization options are essential for widespread adoption. The market is expected to continue expanding, driven by advancements in technology and the increasing demand for safer transportation solutions.
How is this Fatigue Sensing Wearables In the Automotive Sector Industry segmented and which is the largest segment?
The fatigue sensing wearables in automotive sector industry research report provides comprehensive data (region-wise segment analysis), with forecasts and estimates in "USD million" for the period 2024-2028, as well as historical data from 2018-2022 for the following segments.
- Type
- Smart watches
- Smart bands
- Wearable glasses
- Wearable headbands
- Technology
- Biometric sensors
- Optical sensors
- EEG sensors
- ECG sensors
- Geography
- North America
- Canada
- US
- Europe
- Germany
- UK
- France
- APAC
- China
- India
- Japan
- South Korea
- Middle East and Africa
- South America
- North America
By Type Insights
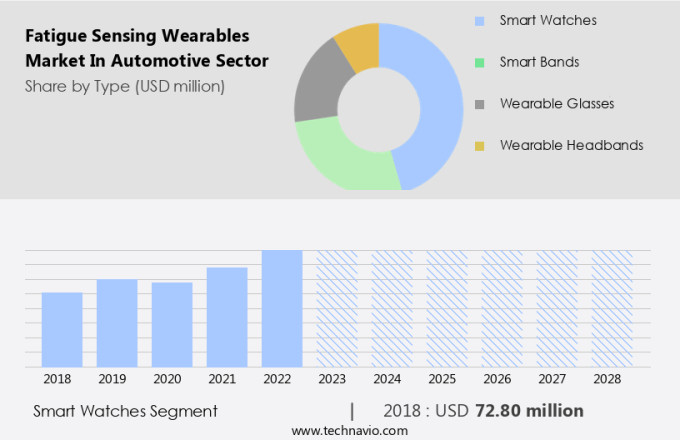
- The smart watches segment is estimated to witness significant growth during the forecast period.
The global market for fatigue sensing wearables In the automotive sector is experiencing notable growth due to the integration of advanced health monitoring technologies and the heightened emphasis on safety in transportation and industrial applications. Smartwatches, a segment of this market, have gained popularity due to their comprehensive health monitoring capabilities, including heart rate, sleep tracking, and other physiological parameters. These devices offer real-time health insights, enabling users to maintain optimal health and prevent fatigue-related incidents. In addition, innovative solutions like Fatigue Science's ReadiWatch, launched in September 2021, provide predictive fatigue management features for safety-critical industries. This smartwatch offers real-time fatigue alerts and predictive analytics, empowering operators and enterprises to effectively manage fatigue risks and promote road safety.
Get a glance at the Fatigue Sensing Wearables In Automotive Sector Industry report of share of various segments Request Free Sample
The smart watches segment was valued at USD 72.80 million in 2018 and showed a gradual increase during the forecast period.
Regional Analysis
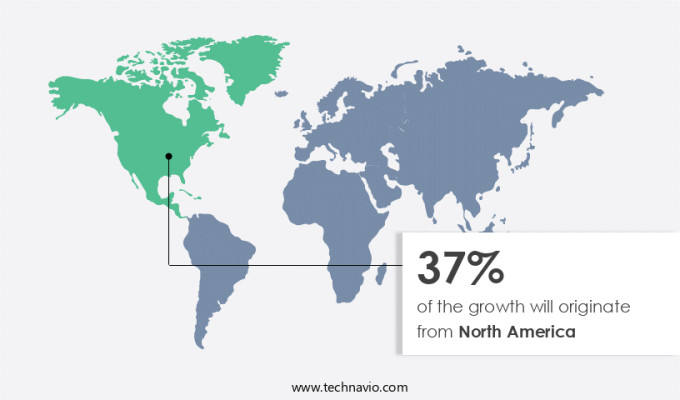
- North America is estimated to contribute 37% to the growth of the global market during the forecast period.
Technavio's analysts have elaborately explained the regional trends and drivers that shape the market during the forecast period.
For more insights on the market share of various regions, Request Free Sample
The North American market for fatigue sensing wearables In the automotive sector is experiencing significant growth due to the increasing priority placed on vehicle safety and the reduction of accidents caused by driver fatigue. These advanced technologies, which monitor physiological signals such as eye movement, heart rate, and brain activity, provide real-time alerts to drivers and fleet managers when fatigue is detected. According to the National Highway Traffic Safety Administration (NHTSA), drowsy driving led to approximately 91,000 police-reported crashes annually between 2017 and 2021, resulting in 50,000 injuries and 800 fatalities. To mitigate this issue, both automakers and fleet operators are turning to fatigue-sensing wearables as a solution. These connected devices, which are integral to the Internet of Things (IoT), offer extended battery life and real-time data analysis, making them a valuable investment for professional drivers and industrial workers in high-risk industries.
Market Dynamics
Our fatigue sensing wearables market in automotive sector researchers analyzed the data with 2023 as the base year, along with the key drivers, trends, and challenges. A holistic analysis of drivers will help companies refine their marketing strategies to gain a competitive advantage.
What are the key market drivers leading to the rise In the adoption of Fatigue Sensing Wearables In Automotive Sector Industry?
New launches by companies is the key driver of the market.
- The fatigue sensing wearables market In the automotive sector is witnessing significant growth due to the introduction of advanced technologies aimed at enhancing driver safety and detecting fatigue. For instance, in June 2024, Telematics and technology provider WHG collaborated with Sleep Advice Technologies Srl (SAT) to launch a next-generation wearable platform. This platform utilizes state-of-the-art fatigue detection and wearable sensor technology, providing an evolved alternative to traditional in-cabin driver monitoring systems (DMS). By leveraging technology for positive outcomes, including the ultimate goal of achieving zero road fatalities, WHG is driving innovation withIn the transport sector. Fatigue-sensing wearables, such as wristbands, headbands, clipons, and earbuds, employ various modalities like Electroencephalography (EEG), Electrocardiography (ECG), Electromyography (EMG), Photoplethysmography (PPG), and other sensors to monitor physiological parameters such as heart rate variability, skin conductance, body heat exposure, and drowsiness detection.
- These nonintrusive systems are integrated with driver assistance systems (ADAS) and real-time monitoring capabilities, enabling timely interventions and fatigue management systems. The automotive sector, including passenger cars and motorcycles, is increasingly adopting these wearable technologies to address driver fatigue, drowsy driving, cognitive functions, motor skill coordination, and distraction. The integration of these wearables with vehicle systems and artificial intelligence (AI) and machine learning algorithms further enhances their capabilities, providing user-friendly interfaces for customization and personalization. Despite the numerous benefits, concerns regarding privacy, data security, and battery life remain. As the market for connected devices and the Internet of Things (IoT) continues to grow, fatigue-sensing wearables must address these concerns while ensuring data analytics and safety features are prioritized. By focusing on these aspects, the fatigue sensing wearables market In the automotive sector is poised for continued growth and innovation.
What are the market trends shaping the Fatigue Sensing Wearables In Automotive Sector Industry?
Partnerships and collaborations is the upcoming market trend.
- Partnerships and collaborations are driving innovation In the fatigue sensing wearables market In the automotive sector. These strategic alliances bring together diverse expertise and resources, enhancing the capabilities of fatigue detection systems. Such collaborations enable the development of more sophisticated and accurate fatigue-sensing technologies, addressing complex challenges more effectively than individual entities working in isolation. In the automotive sector, fatigue sensing wearables employ various modalities such as Electroencephalography (EEG), Electrocardiography (ECG), Electromyography (EMG), Photoplethysmography (PPG), and other physiological parameters to monitor driver fatigue, drowsy driving, cognitive functions, and motor skill coordination.
- These nonintrusive systems integrate with Driver Assistance Systems (ADAS), Road Safety, and Autonomous driving technologies, providing real-time monitoring and timely interventions. Fatigue-sensing wearables can be worn as Wristbands, Headbands, Clipons, Earbuds, or Rings. They utilize machine learning algorithms, data analytics, and artificial intelligence to analyze physiological signals such as heart rate variability, skin conductance, and body heat exposure. These wearables can detect drowsiness, distractions, and other fatigue-related conditions, alerting the driver to take necessary actions. Connected devices and the Internet of Things (IoT) play a significant role In the integration of fatigue-sensing wearables with vehicle systems. These technologies facilitate safety features, sleep tracking, activity tracking, and data security. However, privacy concerns and data security remain critical challenges In the market. The market is further fueled by advancements in wearable technology, machine learning algorithms, and the integration of these technologies with vehicle systems.
What challenges does the Fatigue Sensing Wearables In Automotive Sector Industry face during its growth?
Lack of acceptance of fatigue-sensing wearables is a key challenge affecting the industry growth.
- Fatigue sensing wearables, including wristbands, headbands, clip-ons, and other modality devices, have emerged as promising solutions to address driver fatigue and improve road safety In the automotive sector. These wearables utilize advanced technologies such as Electroencephalography (EEG), Electrocardiography (ECG), Electromyography (EMG), Photoplethysmography (PPG), and other sensors to analyze physiological parameters like heart rate variability, skin conductance, and body heat exposure. By monitoring cognitive functions and motor skill coordination, these nonintrusive systems can detect early signs of driver fatigue and drowsy driving, enabling real-time interventions and timely alerts. However, the integration of these wearable technologies into passenger cars and motorcycles poses several challenges.
- Concerns regarding their effectiveness and reliability in diverse driving conditions and among different individuals persist. Moreover, privacy implications and data security are significant barriers to acceptance. The implementation of these fatigue-sensing wearables in driver assistance systems (ADAS) and autonomous driving technologies requires extensive vehicle systems integration and data analytics, along with artificial intelligence and machine learning algorithms. Despite these challenges, the potential benefits of these wearables in enhancing driver safety and preventing fatigue-related accidents are significant. They can also be applied to monitor worker fatigue in industrial settings and pilot fatigue in aviation. User-friendly interfaces, customization, and personalization are essential features to ensure wide adoption.
Exclusive Customer Landscape
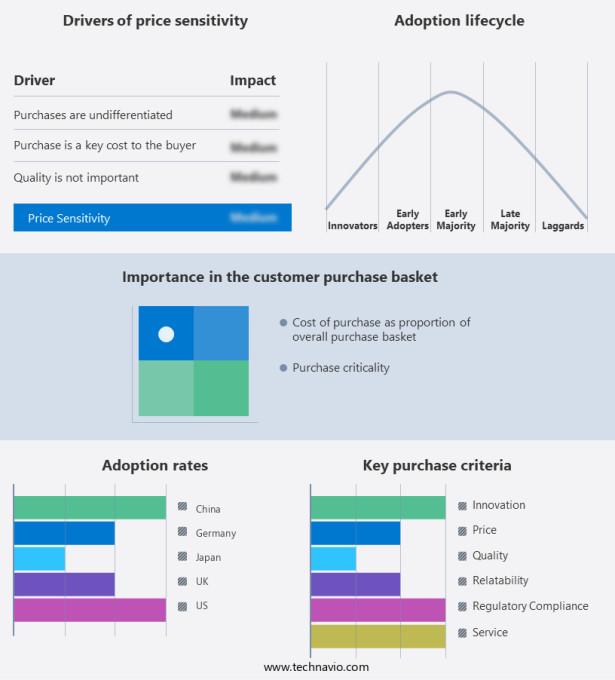
The fatigue sensing wearables market in the automotive sector forecasting report includes the adoption lifecycle of the market, covering from the innovator's stage to the laggard's stage. It focuses on adoption rates in different regions based on penetration. Furthermore, the fatigue sensing wearables market in the automotive sector report also includes key purchase criteria and drivers of price sensitivity to help companies evaluate and develop their market growth analysis strategies.
Customer Landscape
Key Companies & Market Insights
Companies are implementing various strategies, such as strategic alliances, fatigue sensing wearables market in automotive sector forecast, partnerships, mergers and acquisitions, geographical expansion, and product/service launches, to enhance their presence In the industry.
Continental AG - The company offers illuminated safety jacket for the driver monitoring system. This system is designed to monitor driver fatigue and alertness.
The industry research and growth report includes detailed analyses of the competitive landscape of the market and information about key companies, including:
- Continental AG
- Fatigue Science Technologies International Ltd.
- Fujitsu Ltd.
- Inova Design Solutions Ltd
- Optalert Australia Pty Ltd
- Samsung Electronics Co. Ltd.
- Wenco International Mining Systems Ltd.
Qualitative and quantitative analysis of companies has been conducted to help clients understand the wider business environment as well as the strengths and weaknesses of key industry players. Data is qualitatively analyzed to categorize companies as pure play, category-focused, industry-focused, and diversified; it is quantitatively analyzed to categorize companies as dominant, leading, strong, tentative, and weak.
Research Analyst Overview
The automotive industry is witnessing a paradigm shift towards advanced driver assistance systems (ADAS) and autonomous driving technologies. One of the significant challenges in this context is addressing driver fatigue, a leading cause of automotive accidents. Fatigue-sensing wearables have emerged as a promising solution to mitigate the risks associated with drowsy driving. Fatigue-sensing wearables are non-intrusive systems designed to monitor and analyze physiological parameters to detect driver fatigue. These wearable devices can be In the form of headbands, wristbands, earbuds, rings, or clip-ons. They leverage various sensing capabilities, such as electroencephalography (EEG), electrocardiography (ECG), electromyography (EMG), photoplethysmography (PPG), heart rate variability (HRV), skin conductance, body heat exposure, and eye movements.
Moreover, driver fatigue is a complex phenomenon that affects cognitive functions and motor skill coordination. It can lead to reduced reaction times, decreased attention, and impaired decision-making abilities. Traditional methods of detecting driver fatigue, such as monitoring eye closure or head movements, have limitations. Fatigue-sensing wearables offer a more comprehensive approach by analyzing multiple physiological signals in real-time. The integration of these wearables with vehicle systems can lead to timely interventions and effective fatigue management. For instance, when the system detects signs of driver fatigue, it can alert the driver with visual or auditory cues, suggest taking a break, or even activate autonomous driving features.
Furthermore, this can significantly enhance road safety and reduce the risk of accidents caused by driver fatigue. The automotive sector is not the only industry benefiting from fatigue-sensing wearables. Professional drivers, industrial workers, and pilots also face similar challenges. These wearables can help monitor their fatigue levels and provide real-time alerts, enabling them to take necessary breaks and maintain optimal performance. The development of fatigue-sensing wearables is a multidisciplinary effort, involving expertise in areas such as data analytics, machine learning algorithms, artificial intelligence, and user-friendly interfaces. These technologies can be integrated with connected devices and the Internet of Things (IoT) to provide personalized and customized solutions.
|
Fatigue Sensing Wearables Market In Automotive Sector Scope |
|
|
Report Coverage |
Details |
|
Page number |
194 |
|
Base year |
2023 |
|
Historic period |
2018-2022 |
|
Forecast period |
2024-2028 |
|
Growth momentum & CAGR |
Accelerate at a CAGR of 18.4% |
|
Market Growth 2024-2028 |
USD 389.9 million |
|
Market structure |
Concentrated |
|
YoY growth 2023-2024(%) |
17.6 |
|
Key countries |
US, Germany, Japan, China, UK, France, Canada, India, South Korea, and Russia |
|
Competitive landscape |
Leading Companies, Market Positioning of Companies, Competitive Strategies, and Industry Risks, market research and growth, market research report, market growth and forecasting, Market forecasting, market report, market forecast |
What are the Key Data Covered in this Fatigue Sensing Wearables Market In Automotive Sector Research and Growth Report?
- CAGR of the Fatigue Sensing Wearables In Automotive Sector industry during the forecast period
- Detailed information on factors that will drive the Fatigue Sensing Wearables In Automotive Sector growth and forecasting between 2024 and 2028
- Precise estimation of the size of the market and its contribution of the industry in focus to the parent market
- Accurate predictions about upcoming growth and trends and changes in consumer behaviour
- Growth of the market across North America, Europe, APAC, Middle East and Africa, and South America
- Thorough analysis of the market's competitive landscape and detailed information about companies
- Comprehensive analysis of factors that will challenge the fatigue sensing wearables market in automotive sector growth of industry companies
We can help! Our analysts can customize this fatigue sensing wearables market in automotive sector research report to meet your requirements.


