
Femtech Market Size 2025-2029
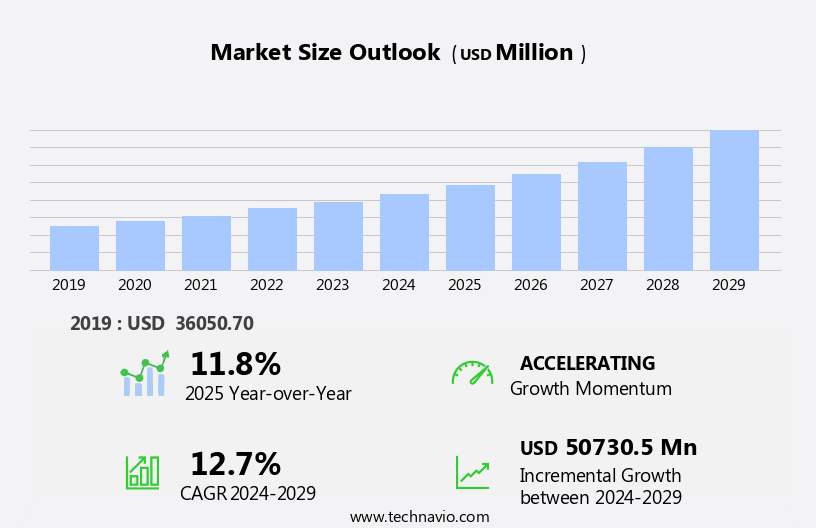
The femtech market size is forecast to increase by USD 50.73 billion at a CAGR of 12.7% between 2024 and 2029.
- The market is experiencing significant growth due to the increasing prevalence of conditions such as infertility and obesity-related health issues in women. These issues have led to a greater awareness and demand for advanced technologies and solutions designed specifically for women's health. However, the market is not without challenges. Lack of investment and insufficient research and development in this sector have hindered the growth of the market.
- Despite these challenges, the market presents a vast opportunity for companies seeking to innovate and address unmet needs in women's health. By focusing on developing solutions for conditions with high prevalence and investing in research and development, companies can capitalize on this growing market and make a positive impact on women's lives. The market encompasses a burgeoning sector of digital health solutions specifically designed for women's and female health. This dynamic market is characterized by the development and implementation of innovative technologies, including digital therapeutics, health data management systems, industry partnerships, and remote monitoring solutions.
What will be the Size of the Femtech Market during the forecast period?
- Digital health policy and regulatory frameworks continue to evolve, enabling the integration of femtech offerings into the digital health ecosystem. Key trends include the adoption of mobile health, wearable technology, and biometric monitoring for personalized medicine and lifestyle interventions. Digital diagnostics and predictive analytics are transforming healthcare by enabling early detection and prevention of health issues.
How is this Femtech Industry segmented?
The femtech industry research report provides comprehensive data (region-wise segment analysis), with forecasts and estimates in "USD million" for the period 2025-2029, as well as historical data from 2019-2023 for the following segments.
- End-user
- Direct-to-consumer
- Hospitals
- Fertility clinics
- Others
- Type
- Devices
- Software
- Services
- Others
- Application
- Menstruation care and fertility tracking
- Pregnancy and nursing care
- General health and wellness
- Menopausal health
- Geography
- North America
- US
- Canada
- Mexico
- Europe
- France
- Germany
- Italy
- UK
- Asia
- China
- India
- Rest of World (ROW)
- North America
By End-user Insights
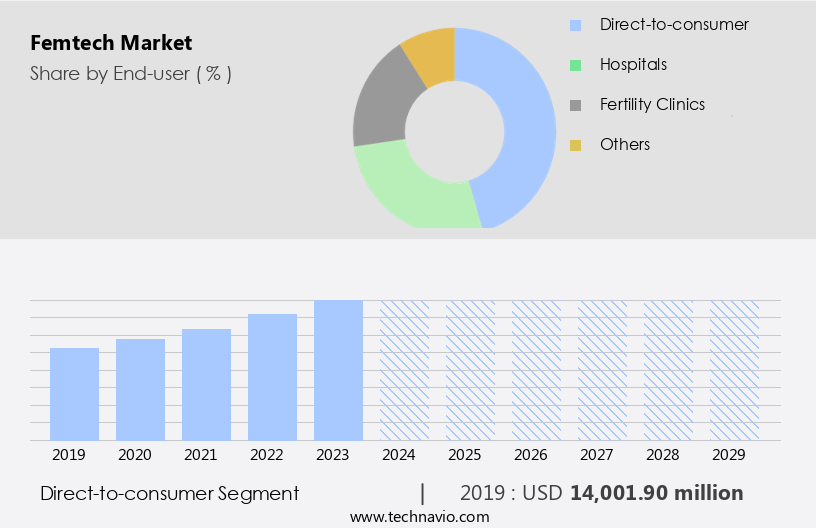
The direct-to-consumer segment is estimated to witness significant growth during the forecast period. Femtech businesses are technology-driven companies focusing on addressing women's health concerns through innovative solutions. These businesses primarily target issues related to contraception, pelvic and sexual health, menopause, menstrual health, and fertility, as well as conditions that disproportionately affect women. The stigma surrounding women's health issues, such as menstruation, sexual, and pelvic health, is being challenged by these companies. Maven Clinic, a virtual clinic, is an example of a femtech business that offers services to women and families. Initially focusing on maternity care, it has since expanded to cater to various stages of the reproductive cycle. Femtech solutions include wearable devices for sleep tracking and fitness, menstrual cycle management apps, contraception apps, and pregnancy planning apps, all utilizing advanced technologies like artificial intelligence, machine learning algorithms, and big data analytics.
Get a glance at the market report of share of various segments Request Free Sample
The Direct-to-consumer segment was valued at USD 14 billion in 2019 and showed a gradual increase during the forecast period. These businesses prioritize data privacy and regulatory compliance while providing personalized experiences, patient engagement, and user-centered design. They aim to empower women through digital health literacy and telehealth platforms, fostering online communities and support groups for mental health, hormonal health, and sexual well-being. Investment firms and venture capital are increasingly recognizing the potential of femtech, leading to the emergence of digital therapeutics and AI-powered diagnostics. Lifestyle management, nutrition tracking, ovulation prediction, and stress management are additional areas where femtech businesses are making a significant impact. By integrating smart sensors, virtual care, and cloud computing, these companies are driving the digital transformation of healthcare systems, collaborating with insurance companies and healthcare providers to offer comprehensive, accessible, and affordable solutions.
Regional Analysis
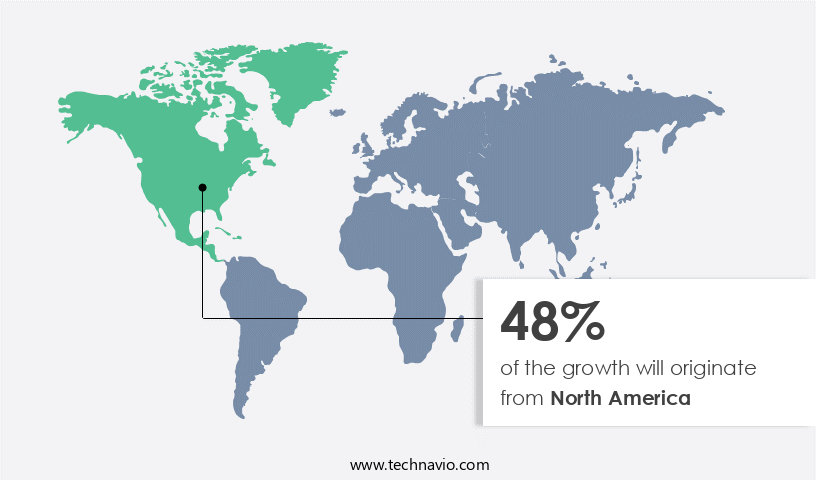
North America is estimated to contribute 48% to the growth of the global market during the forecast period. Technavio's analysts have elaborately explained the regional trends and drivers that shape the market during the forecast period.
For more insights on the market size of various regions, Request Free Sample
The market in North America is experiencing significant growth due to the advanced healthcare system that prioritizes women's health. Sleep tracking, menstrual cycle management, hormonal health, and family planning are key areas where wearable devices and apps are making a substantial impact. Data privacy is a critical concern, with regulatory compliance ensuring user data is securely managed. Biometric data, such as heart rate variability and stress levels, are analyzed using machine learning algorithms and AI-powered diagnostics to provide personalized experiences and patient engagement. Contraception apps, pregnancy planning, and fertility tracking are popular categories, with investment firms and digital therapeutics showing increased interest.
Market Dynamics
Our researchers analyzed the data with 2024 as the base year, along with the key drivers, trends, and challenges. A holistic analysis of drivers will help companies refine their marketing strategies to gain a competitive advantage.
What are the key market drivers leading to the rise in the adoption of Femtech Industry?
- Increase in rate of infertility and obesity-related cases in women is the key driver of the market. The market experiences continuous expansion due to several factors. One significant driver is the rising incidence of infertility among women. Infertility is a global concern, impacting a substantial number of females. Various causative factors, including advanced maternal age, hormonal disorders, lifestyle choices, genetic factors, and infections, contribute to this issue. With the escalating infertility rate, the demand for women's health technologies, such as femtech, is increasing. These solutions cater to assisted reproductive techniques and help women overcome infertility and achieve pregnancy. This trend propels the market's growth, making it an essential sector for businesses and investors.
- Another significant area of growth is menstrual cycle management. Period tracking apps and fertility tracking solutions leverage machine learning algorithms to provide accurate predictions and insights, enabling women to better understand their bodies and plan their lives accordingly. These apps also offer user-centered design features, creating a more engaging and accessible experience. Online communities and support groups are essential components of the Femtech ecosystem, offering a platform for women to connect, share experiences, and access health education. Hormonal health, mental health, and sexual well-being are common themes within these communities, fostering a sense of empowerment and promoting open dialogue. The integration of AI and big data analytics is revolutionizing the Femtech landscape, enabling the development of digital therapeutics and personalized medicine.
What are the market trends shaping the Femtech Industry?
- Increasing awareness about female infertility and STD is the upcoming market trend. Female infertility is a significant health concern, driving the need for increased awareness and research. Several organizations, including RESOLVE and the Endometriosis Association Inc., are dedicated to raising awareness about this condition and the available treatment options. RESOLVE hosts the National Infertility Awareness Week annually in April to encourage grassroots advocacy and support for couples dealing with infertility. World Fertility Day, initiated by IVF BABBLE on November 2nd, aims to raise awareness about fertility issues on a global scale. Additionally, Endometriosis Awareness Month, which takes place in March, focuses on increasing awareness about endometriosis, a major risk factor for female infertility. These initiatives demonstrate the importance of ongoing efforts to educate the public about female infertility and the resources available to those affected.
- Lifestyle management, nutrition tracking, and stress management are essential aspects of women's health addressed by these apps. Online communities and support groups provide a platform for user-centered design, health education, and mental health resources. Telehealth platforms and virtual care are transforming healthcare systems, with insurance companies and healthcare providers embracing digital transformation. Big data analytics and cloud computing facilitate the integration of various health data, enabling better patient outcomes and improving digital health literacy. Sexual health apps cater to sexual well-being, while remote patient monitoring and smart sensors ensure continuous care. The market's future lies in the integration of wearable devices, AI, and digital therapeutics to provide comprehensive, personalized solutions for women's health.
What challenges does the Femtech Industry face during its growth?
- Lack of investment and insufficient research and development is a key challenge affecting the industry growth. The women's health technology, or femtech, sector has historically received less investment compared to other healthcare industries. This specialized area of business remains underfunded, with companies facing challenges in growing and gaining traction. Research has shown an increase in interest and investment in femtech, particularly in areas such as fertility, maternal health, and sexual well-being. However, the overall funding for femtech still lags behind other healthcare sectors. The high cost of implementing digital solutions in healthcare can hinder development in this sector. Despite these challenges, femtech presents significant opportunities for innovation and improvement in women's health. Companies in this sector must navigate the funding landscape and find ways to overcome the financial hurdles to succeed in this emerging market.
- Health data security and healthcare financing remain critical concerns, with a growing emphasis on data privacy and consumer-driven healthcare. Femtech startups are driving innovation in areas such as reproductive health, women's health, and health equity. The digital health landscape is increasingly collaborative, with the emergence of inclusive healthcare initiatives, innovation hubs, public-private partnerships, and healthcare investment opportunities. Digital health literacy and health education are essential components of this ecosystem, ensuring that users can effectively engage with and benefit from these advanced technologies.
Exclusive Customer Landscape
The femtech market forecasting report includes the adoption lifecycle of the market, covering from the innovator's stage to the laggard's stage. It focuses on adoption rates in different regions based on penetration. Furthermore, the femtech market report also includes key purchase criteria and drivers of price sensitivity to help companies evaluate and develop their market growth analysis strategies.
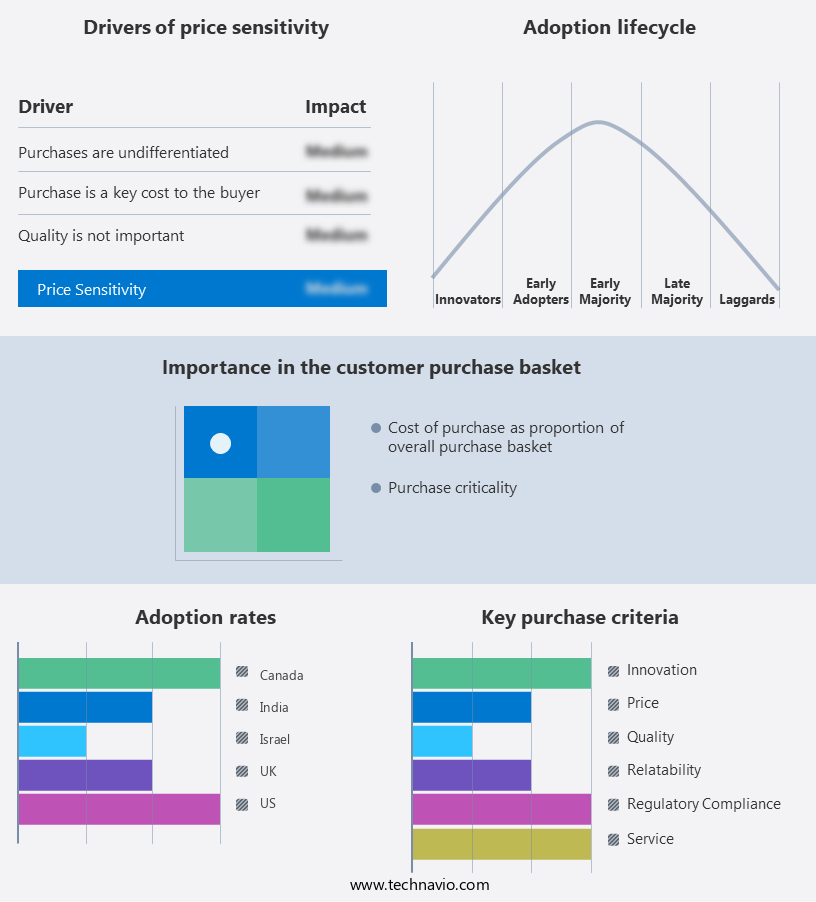
Customer Landscape
Key Companies & Market Insights
Companies are implementing various strategies, such as strategic alliances, femtech market forecast, partnerships, mergers and acquisitions, geographical expansion, and product/service launches, to enhance their presence in the industry.
BioWink GmbH - The company specializes in innovative Femtech solutions, including electric and manual breast pumps, under the brand Elvie.
The industry research and growth report includes detailed analyses of the competitive landscape of the market and information about key companies, including:
- BioWink GmbH
- Chiaro Technology Ltd.
- Flo Health UK Ltd.
- HeraMED
- Glow Inc.
- IBREVE Ltd.
- Laboratory Corp. of America Holdings
- Maven Clinic Co.
- Natural Cycles Nordic AB
- Naya Health
- NIRAMAI Health Analytix Pvt. Ltd.
- Roman Health Ventures Inc.
- Savantini Ltd.
- The Flex Co.
- Tia Inc.
- Uniq Health Inc.
- Willow Innovations Inc.
- YS BRANDS PVT. LTD.
Qualitative and quantitative analysis of companies has been conducted to help clients understand the wider business environment as well as the strengths and weaknesses of key industry players. Data is qualitatively analyzed to categorize companies as pure play, category-focused, industry-focused, and diversified; it is quantitatively analyzed to categorize companies as dominant, leading, strong, tentative, and weak.
Research Analyst Overview
The market encompasses a range of digital health solutions designed to address the unique health needs of women. This dynamic sector is characterized by the integration of advanced technologies such as wearable devices, biometric data tracking, and artificial intelligence (AI) to deliver personalized experiences and enhance patient engagement. One of the key areas of focus within the market is sleep tracking. This technology enables women to monitor their sleep patterns and identify any disruptions, providing valuable insights into their overall health and well-being. Data privacy is a critical concern in this context, with companies implementing security measures to protect the sensitive biometric data collected. Medical devices and wearables can monitor vital signs, track menstrual cycles, and offer insights into overall health, enabling early detection and prevention of related health complications.
These innovative solutions leverage real-time data to deliver targeted interventions, improving patient outcomes and enhancing the overall healthcare experience. Investment firms and venture capitalists are increasingly recognizing the potential of the market, driving significant growth and innovation. Digital health literacy is also a critical factor, with telehealth platforms and virtual care services becoming increasingly popular as women seek convenient and accessible healthcare solutions. Regulatory compliance is a key consideration within the Femtech sector, with healthcare systems and insurance companies requiring stringent adherence to regulatory frameworks. This ensures the safety and efficacy of the technologies and services being offered, instilling confidence in consumers and promoting long-term growth. Solutions range from mental health management to menopausal symptoms, reproductive health, and telemedicine.
Lifestyle management, stress management, and nutrition tracking are additional areas of focus within the market, with smart sensors and AI-powered diagnostics providing valuable insights and interventions. Pregnancy planning and pregnancy apps are also popular solutions, offering women comprehensive support and resources throughout their pregnancy journey. The market represents a dynamic and innovative sector, driven by the integration of advanced technologies and a focus on personalized experiences and patient engagement. As women increasingly demand more convenient, accessible, and effective healthcare solutions, the market is poised for significant growth and transformation.
|
Market Scope |
|
|
Report Coverage |
Details |
|
Page number |
226 |
|
Base year |
2024 |
|
Historic period |
2019-2023 |
|
Forecast period |
2025-2029 |
|
Growth momentum & CAGR |
Accelerate at a CAGR of 12.7% |
|
Market growth 2025-2029 |
USD 50.73 billion |
|
Market structure |
Fragmented |
|
YoY growth 2024-2025(%) |
11.8 |
|
Key countries |
US, UK, Canada, Israel, India, Germany, France, Mexico, China, and Italy |
|
Competitive landscape |
Leading Companies, Market Positioning of Companies, Competitive Strategies, and Industry Risks |
What are the Key Data Covered in this Femtech Market Research and Growth Report?
- CAGR of the Femtech industry during the forecast period
- Detailed information on factors that will drive the growth and forecasting between 2025 and 2029
- Precise estimation of the size of the market and its contribution of the industry in focus to the parent market
- Accurate predictions about upcoming growth and trends and changes in consumer behaviour
- Growth of the market across North America, Europe, Asia, and Rest of World (ROW)
- Thorough analysis of the market's competitive landscape and detailed information about companies
- Comprehensive analysis of factors that will challenge the femtech market growth of industry companies
We can help! Our analysts can customize this femtech market research report to meet your requirements.
 RIA -
RIA - 
