Fiberglass Recycling Market Size 2024-2028
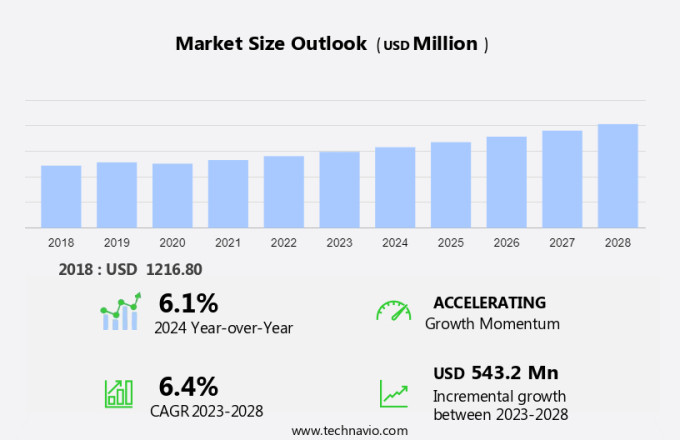
The fiberglass recycling market size is forecast to increase by USD 543.2 million at a CAGR of 6.4% between 2023 and 2028.
- The market is experiencing significant growth due to increasing emphasis on eco-friendly practices for resource efficiency. One key trend driving market growth is the development of methods for recycling fiberglass from wind turbines. However, challenges remain in effectively recycling wind turbine blades, which are large and complex in structure. These challenges include the high cost of recycling and the need for specialized equipment and processes. Despite these hurdles, the market is expected to continue expanding as the demand for sustainable solutions increases. Fiberglass recycling offers a viable solution for reducing waste and minimizing the environmental impact of the wind energy industry.
What will be the Size of the Fiberglass Recycling Market During the Forecast Period?
- The fiber-reinforced plastic (FRP) recycling market encompasses the production and sale of recycled glass-fiber reinforced plastic (GFRP). This market is driven by the increasing demand for sustainable solutions in various sectors, including building and construction and transportation. The recycling of FRP waste contributes to the circular economy by reducing plastic pollution and landfill waste. Recycling technologies, such as pyrolysis, mechanical, thermal, and chemical processes, are employed to convert FRP waste into valuable recycled materials.
- However, high recycling costs and end-of-life management challenges remain obstacles. The engineering sector seeks innovative solutions for fiberglass recycling to meet waste management regulations and reduce reliance on virgin materials. The market for recycled FRP is expanding as more applications emerge, including In the engineering sector and renewable materials production. Despite these opportunities, the recycling demand for fiberglass types, such as carbon and glass, varies depending on their specific applications.
How is this Fiberglass Recycling Industry segmented and which is the largest segment?
The fiberglass recycling industry research report provides comprehensive data (region-wise segment analysis), with forecasts and estimates in "USD million" for the period 2024-2028, as well as historical data from 2018-2022 for the following segments.
- End-user
- Construction
- Automotive
- Aerospace
- Wind energy
- Others
- Type
- Mechanical recycling
- Thermal recycling
- Chemical recycling
- Geography
- APAC
- China
- Japan
- North America
- Canada
- US
- Europe
- Germany
- South America
- Middle East and Africa
- APAC
By End-user Insights
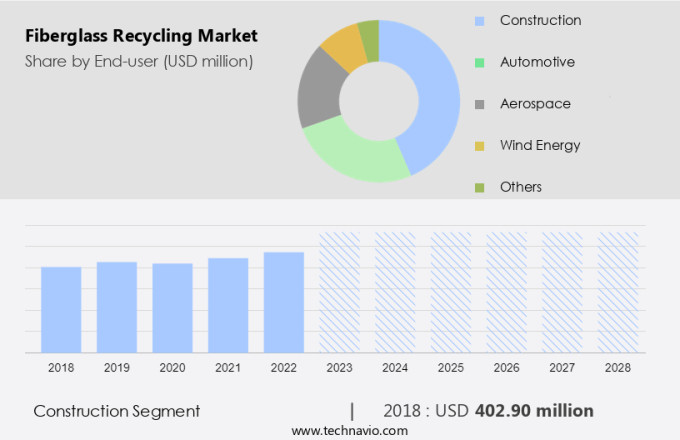
- The construction segment is estimated to witness significant growth during the forecast period.
The market encompasses the processes of transforming post-consumer fiberglass waste into new products, primarily for the construction industry. Two primary recycling methods include thermal and chemical processes. Thermal recycling involves melting and reforming fiberglass waste into new materials, while chemical recycling breaks down the waste into its base components for reuse. With increasing waste disposal regulations, closed-loop recycling systems have gained traction, reducing the environmental impact of fiberglass production. Renewable materials are also being explored as alternatives to fiberglass composites.
Furthermore, the construction sector, particularly residential roofing, is a significant consumer of recycled fiberglass, utilizing fiberglass mats for their cost-effectiveness and versatility. These mats come in various colors and styles, catering to diverse architectural designs and neighborhood aesthetics. Thicker architectural shingles can mimic the appearance of high-end materials like wood shakes or natural slate.
Get a glance at the Fiberglass Recycling Industry report of share of various segments Request Free Sample
The construction segment was valued at USD 402.90 billion in 2018 and showed a gradual increase during the forecast period.
Regional Analysis
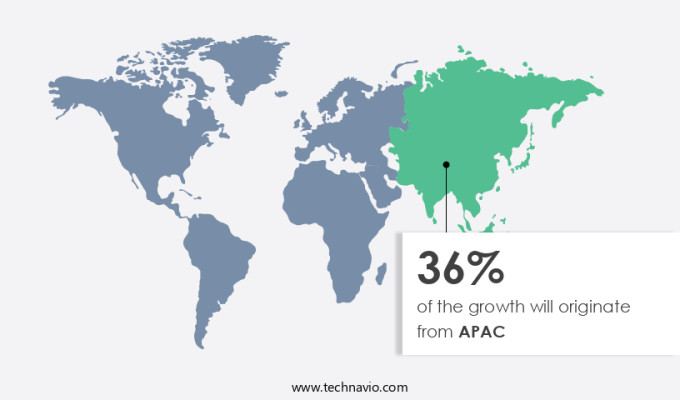
- APAC is estimated to contribute 36% to the growth of the global market during the forecast period.
Technavio’s analysts have elaborately explained the regional trends and drivers that shape the market during the forecast period.
For more insights on the market share of various regions, Request Free Sample
The Asia Pacific region is leading The market due to the growing need to manage waste from wind energy equipment and the emphasis on sustainability. China is at the forefront of this development, pioneering innovative recycling methods for wind turbine components. Fiberglass, which makes up around 10% of wind turbines, poses a significant recycling challenge due to its complex composition. In response, Chinese companies are investing in new technologies and processes.
For instance, a company in Shandong Province has developed a self-operated hydraulic robot to cut and reuse fiberglass blades for other turbines. This innovation not only reduces waste but also contributes to the circular economy In the building and construction and transportation sectors. The fiber-reinforced plastic (FRP) recycling market is expected to experience steady sales revenue growth In the coming years as more companies adopt sustainable practices.
Market Dynamics
Our fiberglass recycling market researchers analyzed the data with 2023 as the base year, along with the key drivers, trends, and challenges. A holistic analysis of drivers will help companies refine their marketing strategies to gain a competitive advantage.
What are the key market drivers leading to the rise In the adoption of Fiberglass Recycling Industry?
Emphasis on eco-friendly practices for resource efficiency is the key driver of the market.
- The Fiber-reinforced plastic (FRP) recycling market is gaining momentum due to the increasing focus on circular economy principles and waste management in various sectors, including building and construction, transportation, and engineering. One of the leading companies in this industry, Johns Manville Corp, is taking significant strides toward fiberglass waste reduction and recycling. In 2021, the company launched a recycling unit at its Trnava plant in Slovakia, which is expected to improve production processes and minimize environmental impact. This initiative is part of Johns Manville's ongoing commitment to sustainability and aligns with the growing demand for recycled materials In the market. Fiberglass recycling technologies, such as mechanical, thermal, and chemical methods, are being explored to address the high costs associated with end-of-life management of fiberglass composites. These methods include pyrolysis, chemical recycling, and mechanical recycling, which can transform fiberglass waste into valuable resources for various applications. The engineering sector, particularly in lightweight vehicles and electric vehicles, is a significant consumer of recycled fiberglass materials.
- Additionally, green building initiatives and the renewable energy sector, including wind energy, are also driving the demand for recycled fiberglass. Woven Roving, Thermoplastic Fiberglass, and various fiberglass types with high, medium, and low fiberglass content are being recycled for various applications. Surface Mat is another recycling application for fiberglass waste. The recycling methods employed depend on the specific fiberglass type and its intended application. As waste disposal regulations become more stringent, the demand for closed-loop recycling systems is increasing to reduce landfill waste and promote sustainable practices. Overall, the market is poised for growth as the circular economy gains traction and the need for resource efficiency and waste reduction becomes increasingly important.
What are the market trends shaping the Fiberglass Recycling Industry?
Methods for recycling fiberglass from wind turbines are the upcoming market trends.
- The market is experiencing notable growth, particularly In the area of recycling fiberglass from wind turbines. Innovative recycling processes are being introduced to boost sustainability and operational efficiency. In June 2024, a new facility in Fairfax, US, launched a groundbreaking turbine blade recycling technology. This facility utilizes a patent-pending process that can recycle around 12 tons of turbine blades per hour. The process involves shredding the blades and separating non-recyclable materials, resulting in a shredded fiberglass composite. This composite can be transformed into various forms, including fine powder and different sizes, catering to a wide range of industrial applications. The recycling of fiberglass composites, such as fiber-reinforced plastic (FRP) and glass-fiber reinforced plastic (GFRP), is essential in reducing waste and adhering to waste disposal regulations. Mechanical recycling, thermal recycling, and chemical recycling are some of the methods employed In the recycling of fiberglass. In the building and construction sector, fiberglass waste can be recycled and used In the production of new composites.
- In the transportation industry, recycled fiberglass materials are utilized In the manufacturing of lightweight vehicles and electric vehicles. The engineering sector also benefits from the use of recycled fiberglass In the production of high fiberglass content, medium fiberglass content, and low fiberglass content composites. The circular economy is gaining momentum, and the demand for recycling technologies is increasing, making fiberglass recycling a vital aspect of waste management and end-of-life management. Despite the high recycling costs, the benefits of fiberglass recycling outweigh the costs, making it a worthwhile investment for businesses and industries. The use of renewable materials in place of virgin materials is a key driver of the market. The recycling methods, including closed-loop recycling systems, surface mats, woven roving, thermoplastic fiberglass, and woven roving, offer various advantages and applications. The recycling of fiberglass composites is essential in reducing landfill waste, mitigating plastic pollution, and promoting a more sustainable future.
What challenges does the Fiberglass Recycling Industry face during its growth?
Challenges in recycling wind turbine blades are key challenges affecting the industry's growth.
- The market encompasses the processes and technologies employed In the recycling of Fiber-reinforced Plastic (FRP), specifically Glass-fiber reinforced plastic (GFRP), to reduce waste and generate sales revenue. In industries such as Building and Construction and Transportation, the production of FRP waste is substantial due to the extensive use of this material in manufacturing lightweight vehicles, electric vehicles, and wind energy components. Recycling technologies, including Mechanical Recycling, Thermal Recycling, and Chemical Recycling, are crucial in addressing the challenge of FRP waste management. Mechanical Recycling involves the reprocessing of waste materials into new products, while Thermal Recycling, including Pyrolysis, converts waste into energy. Chemical Recycling breaks down the composite material into its base components for reuse. The engineering sector, particularly In the areas of Green Building initiatives and End-of-Life Management, has shown increased demand for recycled materials.
- However, high recycling costs and the unique challenges of recycling high-fiberglass content materials, such as Woven Roving, Thermoplastic Fiberglass, and Surface Mat, pose significant obstacles. Circular economy principles aim to minimize plastic pollution and promote waste disposal regulations that encourage the implementation of closed-loop recycling systems. As the market for Fiberglass Recycling continues to evolve, advancements in recycling methods, such as those for recycling Fiberglass Types with medium and low fiberglass content, will play a crucial role in reducing landfill waste and increasing the demand for recycled materials in various industries.
Exclusive Customer Landscape
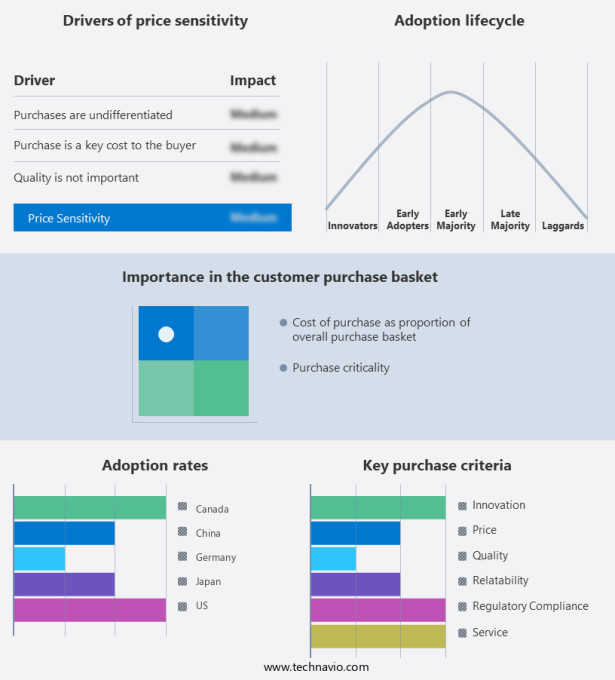
The fiberglass recycling market forecasting report includes the adoption lifecycle of the market, covering from the innovator’s stage to the laggard’s stage. It focuses on adoption rates in different regions based on penetration. Furthermore, the fiberglass recycling market report also includes key purchase criteria and drivers of price sensitivity to help companies evaluate and develop their market growth analysis strategies.
Customer Landscape
Key Companies & Market Insights
Companies are implementing various strategies, such as strategic alliances, fiberglass recycling market forecast, partnerships, mergers and acquisitions, geographical expansion, and product/service launches, to enhance their presence In the industry. The industry research and growth report includes detailed analyses of the competitive landscape of the market and information about key companies, including:
- Adesso Advanced Materials
- Borealis AG
- Carbon Rivers Inc.
- Eco Wolf Inc.
- European Metal Recycling Ltd.
- Gen 2 Carbon Ltd.
- General Kinematics Corp.
- Global Fiberglass Solutions Inc.
- Johns Manville Corp
- Neowa GmbH
- Owens Corning
- ReFiber ApS
- Sinoma Science and Technology Co. Ltd.
- Strategic Materials Inc.
- Toray Industries Inc.
- Veolia Environnement SA
- Vestas Wind Systems AS
- WindEurope VZW ASBL
Qualitative and quantitative analysis of companies has been conducted to help clients understand the wider business environment as well as the strengths and weaknesses of key industry players. Data is qualitatively analyzed to categorize companies as pure play, category-focused, industry-focused, and diversified; it is quantitatively analyzed to categorize companies as dominant, leading, strong, tentative, and weak.
Research Analyst Overview
Fiber-reinforced plastic (FRP), also known as glass-fiber reinforced plastic (GFRP), is a composite material with high demand in various industries, including building and construction and transportation. As the usage of FRP continues to expand, so does the generation of FRP waste. The recycling of FRP waste has emerged as a critical aspect of the circular economy, reducing plastic pollution and minimizing landfill waste. The recycling market for FRP waste is driven by several factors. The engineering sector's increasing focus on sustainability and end-of-life management of materials is a significant factor. High recycling costs have historically hindered the widespread adoption of FRP recycling, but advancements in recycling technologies are making the process more cost-effective. The circular economy's principles are gaining traction in various industries, and FRP recycling is no exception. Recycling technologies, such as mechanical and thermal methods, are being developed to process FRP waste into valuable recycled materials.
Furthermore, mechanical recycling involves the reprocessing of FRP waste into new products with similar properties as the original material. Thermal recycling, on the other hand, involves the conversion of FRP waste into energy through pyrolysis or incineration. The demand for recycled materials In the FRP industry is increasing, with applications ranging from building and construction to transportation. In the building and construction sector, recycled FRP materials can be used In the production of new composite structures, reducing the need for virgin materials. In the transportation industry, recycled FRP can be used In the manufacturing of lightweight vehicles and electric vehicles, contributing to the reduction of greenhouse gas emissions. The recycling of FRP waste also offers benefits In the renewable energy sector. For instance, recycled FRP can be used In the production of wind energy components, such as blades and towers.
Additionally, recycled FRP can be used In the aerospace and defense industries, where high-performance and lightweight materials are essential. The recycling of FRP waste is also influenced by waste disposal regulations. Governments and regulatory bodies are increasingly implementing regulations to reduce plastic waste and promote the circular economy. These regulations are driving the development of closed-loop recycling systems, which aim to keep materials in use for as long as possible. The recycling of FRP waste presents challenges, such as the varying fiberglass content in different FRP waste streams. Woven roving and thermoplastic fiberglass are two common types of FRP waste, each with unique recycling requirements. High fiberglass content waste is typically easier to recycle than medium or low fiberglass content waste. Despite these challenges, the FRP recycling market is expected to grow as the demand for sustainable materials and circular economy principles continues to gain momentum.
Thus, the development of advanced recycling technologies and the increasing focus on end-of-life management of materials are expected to drive the growth of the market. Overall, the recycling of FRP waste is a critical aspect of the circular economy, reducing plastic pollution and minimizing landfill waste. The market for FRP recycling is driven by various factors, including the increasing focus on sustainability, advancements in recycling technologies, and waste disposal regulations. The recycling of FRP waste offers benefits in various industries, including building and construction, transportation, renewable energy, and aerospace and defense. Despite challenges, such as varying fiberglass content, the market for FRP recycling is expected to grow as the demand for sustainable materials and circular economy principles continues to gain momentum.
|
Fiberglass Recycling Market Scope |
|
|
Report Coverage |
Details |
|
Page number |
212 |
|
Base year |
2023 |
|
Historic period |
2018-2022 |
|
Forecast period |
2024-2028 |
|
Growth momentum & CAGR |
Accelerate at a CAGR of 6.4% |
|
Market growth 2024-2028 |
USD 543.2 million |
|
Market structure |
Fragmented |
|
YoY growth 2023-2024(%) |
6.1 |
|
Key countries |
US, China, Germany, Canada, and Japan |
|
Competitive landscape |
Leading Companies, Market Positioning of Companies, Competitive Strategies, and Industry Risks |
What are the Key Data Covered in this Fiberglass Recycling Market Research and Growth Report?
- CAGR of the Fiberglass Recycling industry during the forecast period
- Detailed information on factors that will drive the Fiberglass Recycling growth and forecasting between 2024 and 2028
- Precise estimation of the size of the market and its contribution of the industry in focus to the parent market
- Accurate predictions about upcoming growth and trends and changes in consumer behaviour
- Growth of the market across APAC, North America, Europe, South America, and Middle East and Africa
- Thorough analysis of the market’s competitive landscape and detailed information about companies
- Comprehensive analysis of factors that will challenge the fiberglass recycling market growth of industry companies
We can help! Our analysts can customize this fiberglass recycling market research report to meet your requirements.


