Fishmeal Market Size 2024-2028
The fishmeal market size is forecast to increase by USD 1.74 billion at a CAGR of 4.5% between 2023 and 2028.
- The market is driven by several key factors, including the rising consumption of meat and poultry in various regions, leading to an increased demand for fishmeal as a source of animal protein. Additionally, the global expansion of aquaculture production and consumption contributes significantly to market growth. Strict regulations regarding the use of marine resources in the production of fishmeal are also a notable trend, ensuring sustainable and ethical practices. Key species used in the production of fishmeal include marine fish such as mackerel, capelin, pilchard, herring, and anchoveta, as well as crustaceans like shrimp, crab, and krill. These ingredients are essential for the livestock industry, particularly for swine and other aquatic animals. The market is expected to experience steady growth due to these factors.
What will be the Size of the Market During the Forecast Period?
- The market holds significant importance in the global animal feed industry due to its nutritional benefits. This market caters to various sectors, including pig farms and poultry, by providing essential nutrients for optimal animal growth. Fishmeal is a traditional feed ingredient, rich in crude protein, which contributes to the development and maintenance of muscles in animals. Its amino acid composition is particularly advantageous, as it provides all the essential amino acids required for animal growth. Moreover, fishmeal is a valuable source of omega-3 fatty acids, specifically DHA, which contribute to improved health and productivity in livestock. In the realm of aquaculture, fishmeal plays a pivotal role as a protein source for fish feed. Its nutritional content, including DHA and EPA, is crucial for the growth and development of farmed fish.
- Furthermore, fishmeal's inclusion in fish feed enhances the nutritional qualities of the final product, making it an attractive option for consumers. The fishmeal market also encompasses specialized variants, such as crustacean-derived bioactive compounds, which find applications in the pharmaceutical industry. These compounds offer unique health benefits, making fishmeal an essential component in the production of premium feed additives. Sustainable intensification is a growing trend in the animal feed industry, and fishmeal aligns with this approach. As concerns regarding the environmental impact of synthetic feed additives and chemical-based fertilizers increase, fishmeal offers a more sustainable alternative. Organic nitrogen, derived from fishmeal, is a natural and renewable source of nutrients for animal feed.
How is this market segmented and which is the largest segment?
The market research report provides comprehensive data (region-wise segment analysis), with forecasts and estimates in "USD million" for the period 2024-2028, as well as historical data from 2018-2022 for the following segments.
- Application
- Animal feed
- Agriculture
- Pharmaceuticals
- Geography
- North America
- Canada
- Mexico
- US
- APAC
- China
- India
- Japan
- Europe
- Germany
- UK
- France
- South America
- Brazil
- Middle East and Africa
- North America
By Application Insights
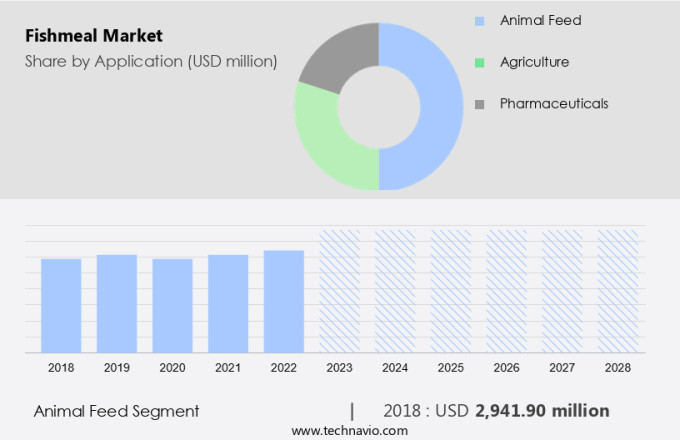
- The animal feed segment is estimated to witness significant growth during the forecast period.
Fishmeal is an essential ingredient in the production of animal feed, particularly for aquaculture and livestock farming. Furthermore, the market has experienced significant growth in the animal feed segment due to the increasing demand for fishmeal as a cost-effective source of high-quality protein for farm animals. This protein-rich feed source is derived primarily from marine fish, such as mackerel, capelin, pilchard, herring, anchoveta, and crustaceans, including shrimp, crab, and krill. The high protein content of fishmeal, which ranges from 62% to 70% by weight, makes it an indispensable nutrient for the growth and development of various aquatic animals and livestock, including swine and poultry. In the animal feed industry, fishmeal is widely used to produce fish feed for species like trout and salmon.
This, in turn, contributes to the production of high-quality animal products, such as bacon, eggs, pork, and chicken. The use of fishmeal as a protein supplement in pig and poultry farms is expected to continue, driving the growth of the fishmeal market in the coming years.
Get a glance at the market report of share of various segments Request Free Sample
The animal feed segment was valued at USD 2.94 billion in 2018 and showed a gradual increase during the forecast period.
Regional Analysis
- APAC is estimated to contribute 37% to the growth of the global market during the forecast period.
Technavio's analysts have elaborately explained the regional market trends and drivers that shape the market during the forecast period.
For more insights on the market share of various regions Request Free Sample
In the market, North America held the largest market share in terms of value in 2023, a trend that is anticipated to continue during the forecast period. The region's dominance can be attributed to the rising demand for poultry meat due to the expanding urban population and the proliferation of fast-food establishments. Moreover, there is a growing preference for healthy and nutritious animal feed in North America, as consumers become more conscious of alternative feed ingredients like fishmeal. These ingredients offer numerous nutritional benefits, including high protein content, essential amino acids, and calcium. Protein-rich fish meals are essential components of aquafeed, which is in high demand due to the increasing seafood consumption and fisheries restrictions.
Therefore, the market in North America is poised for steady growth, with key players focusing on innovation and product development to meet the evolving needs of the industry. Traditional feed ingredients, such as corn gluten meal and soybean meal, continue to be important competitors in the market. However, fishmeal's unique nutritional profile and its positive impact on animal health make it a valuable addition to the animal feed industry.
Market Dynamics
Our researchers analyzed the data with 2023 as the base year, along with the key drivers, trends, and challenges. A holistic analysis of drivers will help companies refine their marketing strategies to gain a competitive advantage.
What are the key market drivers leading to the rise in adoption of Fishmeal Market?
Increasing consumption of meat and poultry is the key driver of the market.
- The global fishmeal market is witnessing significant growth due to the increasing demand for animal protein sources, particularly in the fish processing industry. Sardine-based fish meal, derived from natural ingredients, plays a crucial role in enhancing the weight, flesh quality, and nutritional value of farmed fish, such as cod, tuna, and salmon. High-quality protein is essential for the growth and development of these aquaculture species, making fishmeal an indispensable component of their diets.
- Moreover, the demand for alternative protein sources, including mushroom substrate, single-cell organisms, insects, and citrus byproducts, is on the rise. These ingredients offer sustainable and eco-friendly alternatives to traditional fishmeal, aligning with consumers' growing preference for environmentally friendly food production methods. The meat, poultry, and seafood segment, also known as the fresh meat and poultry industry, is projected to continue its steady growth during the forecast period. Consumers' increasing focus on protein-rich food sources further fuels this trend. Thus, such factors are driving the growth of the market during the forecast period.
What are the market trends shaping the Fishmeal Market?
Growing aquaculture production and consumption worldwide is the upcoming trend in the market.
- The global fishmeal market is experiencing significant growth due to the increasing demand for high-quality aquaculture feed. Aquaculture, a vital sector in the agricultural industry, is witnessing a growth in production to meet the rising consumption of various aquatic species such as carp, marine shrimps, tilapias, salmons, trouts, and freshwater crustaceans. These species are major consumers of fishmeal, which is rich in crude protein, omega-3 fatty acids, including DHA, and other essential nutrients. Moreover, the cultivation of these aquatic species is on the rise, particularly in North America, due to the growing preference for sustainable intensification in aquaculture. Fishmeal, a natural source of these nutrients, is an essential component of specialized variants of aquaculture feed.
- Additionally, crustacean-derived bioactive compounds, which are increasingly being used in pharmaceutical applications, are also sourced from fishmeal. Synthetic feed additives, while an alternative, cannot fully replace the nutritional content provided by fishmeal. However, concerns regarding heavy metals and other contaminants in fishmeal have led to the development of premium feed additives that address these issues while maintaining the nutritional benefits. As the aquaculture industry continues to evolve, the demand for fishmeal is expected to remain strong. Thus, such trends will shape the growth of the market during the forecast period.
What challenges does Fishmeal Market face during the growth?
Increasing the stringency of regulations is a key challenge affecting the market growth.
- The fishmeal market is a significant sector in the global agriculture industry, with wild-caught fish serving as a primary source for producing this essential livestock feed ingredient. Fishmeal's nutritional qualities, particularly its high protein content and amino acid composition, make it an indispensable component in various animal feed formulations. In addition to its use in livestock feed, fishmeal also finds applications in fertilizers as an organic nitrogen source. However, the production and trade of fishmeal are subject to various regulations. Manufacturers must comply with national and regional environmental and health and safety regulations to obtain permits and authorizations. These regulations include specific technical restrictions, such as product testing, certification, and shipment inspection requirements.
- Moreover, fishmeal plays a vital role in the seafood processing industry, contributing to shrimp farming and seafood consumption. As the demand for sustainable and eco-friendly practices grows, the fishmeal market is expected to adapt, with potential shifts towards organic and sustainable production methods. In conclusion, the fishmeal market is subject to various regulations, necessitating manufacturers' awareness of the specific requirements in each target market. Adherence to these regulations is crucial to maintain market access and ensure product quality and safety. Additionally, the fishmeal market's role in the agriculture, fertilizer, and seafood industries highlights its importance as a versatile and valuable ingredient. Hence, the above factors will impede the growth of the market during the forecast period.
Exclusive Customer Landscape
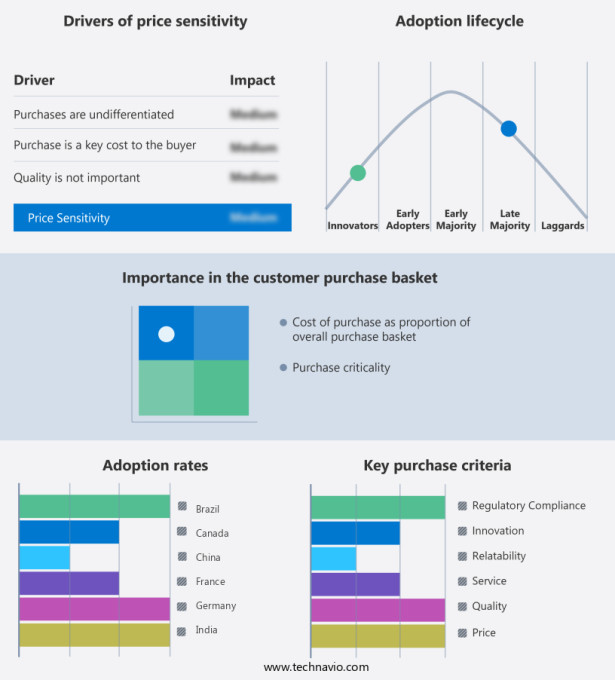
The market forecasting report includes the adoption lifecycle of the market, covering from the innovator's stage to the laggard's stage. It focuses on adoption rates in different regions based on penetration. Furthermore, the market report also includes key purchase criteria and drivers of price sensitivity to help companies evaluate and develop their market growth analysis strategies.
Customer Landscape
Key Companies & Market Insights
Companies are implementing various strategies, such as strategic alliances, market forecast, partnerships, mergers and acquisitions, geographical expansion, and product/service launches, to enhance their presence in the market.
The market research and growth report includes detailed analyses of the competitive landscape of the market and information about key companies, including:
- Alpha Atlantique
- Animalfeeds International Corp.
- Austevoll Seafood ASA
- Bawa Fishmeal and Oil Co.
- Corpesca SA
- CorporaciOn Pesquera Inca SAC Av.
- Diamond Aqua Fishes Meal
- FF SKAGEN AS
- Hayduk Fisheries SA
- Omega Protein Corp.
- Pesquera Exalmar SAA
- Sardina d.o.o.
- Tasa
- The Scoular Co.
- TripleNine
Qualitative and quantitative analysis of companies has been conducted to help clients understand the wider business environment as well as the strengths and weaknesses of key market players. Data is qualitatively analyzed to categorize companies as pure play, category-focused, industry-focused, and diversified; it is quantitatively analyzed to categorize companies as dominant, leading, strong, tentative, and weak.
Research Analyst Overview
Fishmeal is a valuable animal feed ingredient derived from the processing of wild-caught or farmed fish. It is rich in crude protein, essential amino acids, and nutrients such as calcium. Fishmeal is particularly prized for its high omega-3 fatty acid content, including DHA, which is essential for the growth and development of aquatic animals and livestock. Specialized variants of fishmeal, such as crustacean-derived bioactive compounds, are used in the pharmaceutical industry and in the production of premium pet food. In the aquaculture industry, fishmeal is a crucial component of aquafeed, providing essential nutrients for the growth and health of marine fish, such as mackerel, capelin, pilchard, herring, anchoveta, and crustaceans like shrimp and crab. Fishmeal production is subject to sustainable intensification practices to ensure the long-term availability of this important feed ingredient. Synthetic feed additives and heavy metals are minimized to maintain the nutritional content and health-promoting omega-3 PUFA in fishmeal.
Furthermore, fishmeal is also used as a protein source in livestock feed, particularly in pig farms and poultry production. It is often used as a replacement for traditional feed ingredients like corn gluten meal and soybean meal. The nutrient digestibility and amino acid composition of fishmeal make it an ideal protein source for animal rearing. Fishmeal is also used as a fertilizer, providing organic nitrogen and phosphorus to improve soil health and promote plant growth. In recent years, there has been a growing demand for fishmeal as a sustainable and natural alternative to chemical-based fertilizers. The nutritional qualities of fishmeal make it an essential ingredient in the production of high-quality protein for both animal feed and seafood processing. The use of wild-caught fish, single-cell organisms, insects, citrus byproducts, fish oil, and other natural ingredients in fishmeal production ensures a consistent and sustainable supply of this valuable feed ingredient.
|
Market Scope |
|
|
Report Coverage |
Details |
|
Page number |
158 |
|
Base year |
2023 |
|
Historic period |
2018-2022 |
|
Forecast period |
2024-2028 |
|
Growth momentum & CAGR |
Accelerate at a CAGR of 4.5% |
|
Market Growth 2024-2028 |
USD 1.74 billion |
|
Market structure |
Fragmented |
|
YoY growth 2023-2024(%) |
4.3 |
|
Key countries |
US, China, Germany, UK, Japan, France, India, Canada, Mexico, and Brazil |
|
Competitive landscape |
Leading Companies, Market Positioning of Companies, Competitive Strategies, and Industry Risks |
What are the Key Data Covered in this Market Research and Growth Report?
- CAGR of the market during the forecast period
- Detailed information on factors that will drive the market growth and forecasting between 2024 and 2028
- Precise estimation of the size of the market and its contribution of the market in focus to the parent market
- Accurate predictions about upcoming market growth and trends and changes in consumer behaviour
- Growth of the market across North America, APAC, Europe, South America, and Middle East and Africa
- Thorough analysis of the market's competitive landscape and detailed information about companies
- Comprehensive analysis of factors that will challenge the growth of market companies
We can help! Our analysts can customize this market research report to meet your requirements. Get in touch


