Flexible Printed Circuit Board Market Size 2024-2028
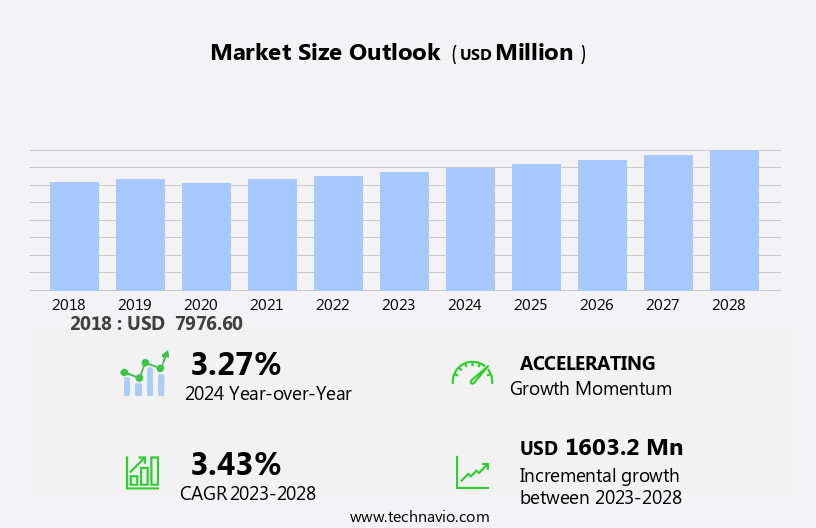
The flexible printed circuit board market size is forecast to increase by USD 1.6 billion, at a CAGR of 3.43% between 2023 and 2028.
- The market is experiencing significant growth due to several key trends. The increasing adoption of smartphones and other portable electronic devices is driving the demand for FPCBs, as they offer advantages such as lightweight design, flexibility, and improved connectivity. Additionally, the automation of various industries is leading to an increased use of electronic components, including FPCBs, in manufacturing processes. Foldable smartphones and lightweight, foldable devices are significant trends, as is the integration of FPCBs in electric vehicles, healthcare wearables, smart packaging solutions, and the Internet of Things. Furthermore, market dynamics, such as the emergence of new technologies and changing consumer preferences, are also contributing to the growth of the FPCB market. These trends are expected to continue, making the FPCB market a promising investment opportunity for businesses In the electronics industry.
What will be the Size of the Flexible Printed Circuit Board Market During the Forecast Period?
- The flexible printed circuit board (FPCB) market encompasses a diverse range of advanced technologies, including copperclad laminate, singlesided, doublesided, multilayer, rigidflex, and miniaturized circuit boards. This market is driven by the growing demand for high-speed electronics, efficient interconnectivity, and circuit complexity in various industries.
- The market is also influenced by the miniaturization of electronic devices, which necessitates compact designs and increased circuit complexity. Technological advancements in manufacturing processes, such as solder paste and customization techniques, contribute to the market's growth. The integration of artificial intelligence and 5G technologies further expands the potential applications of FPCBs, ensuring their continued relevance In the evolving electronic landscape.
How is this Flexible Printed Circuit Board Industry segmented and which is the largest segment?
The flexible printed circuit board industry research report provides comprehensive data (region-wise segment analysis), with forecasts and estimates in "USD million" for the period 2024-2028, as well as historical data from 2018-2022 for the following segments.
- End-user
- Consumer electronics
- Automotive
- Industrial
- Others
- Geography
- APAC
- China
- Japan
- South Korea
- North America
- US
- Europe
- Middle East and Africa
- South America
- APAC
By End-user Insights
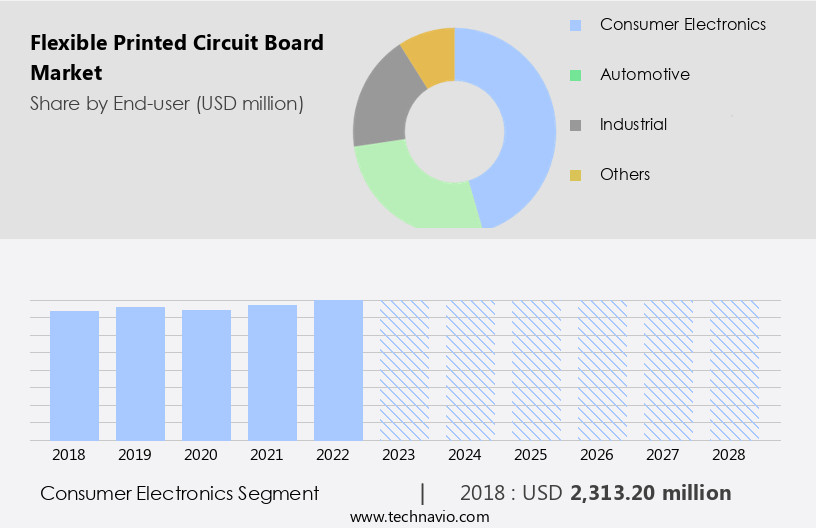
- The consumer electronics segment is estimated to witness significant growth during the forecast period.
The market caters to the consumer electronics sector, including audio systems, smartphones, tablets, personal computers, smart home appliances, smart wearables, and TVs. FPCBs are essential for these devices due to their compact size, high reliability, and low mass. Flexible PCBs offer advantages such as space savings, lightweight design, and high ductility, making them ideal for compact, multi-functional devices. These boards feature fast electrical transmission rates, thin structural designs, and low power consumption, contributing to their widespread adoption.
Key technologies in FPCB manufacturing include Copperclad laminates, Polyimide film, adhesive materials, conductive inks, and solder. FPCBs are integral to the operation of devices, with applications ranging from flexible diode displays and organic light-emitting diodes to telecommunication and electronic appliances. The automotive, industrial, and healthcare sectors also utilize FPCBs for advanced electronics integration, customization, and manufacturing advancements.
Get a glance at the market report of share of various segments Request Free Sample
The consumer electronics segment was valued at USD 2.31 billion in 2018 and showed a gradual increase during the forecast period.
Regional Analysis
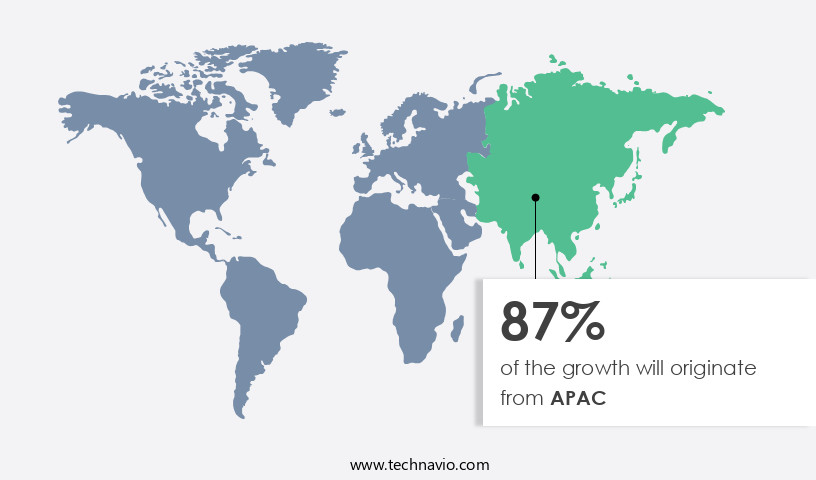
- APAC is estimated to contribute 87% to the growth of the global market during the forecast period.
Technavio's analysts have elaborately explained the regional trends and drivers that shape the market during the forecast period.
For more insights on the market size of various regions, Request Free Sample
The flexible printed circuit board (FPCB) market is primarily driven by the consumer electronics industry, with APAC leading the global market due to the region's high concentration of manufacturers. The established electronics supply chain in APAC, including flat-panel TV, smartphone, tablet, and wearable device manufacturers in South Korea, Japan, Taiwan, and China, will continue to fuel market growth. Flexible PCBs enable efficient interconnectivity, circuit complexity, and electronic device miniaturization, making them essential for foldable smartphones, artificial intelligence, 5G, high-speed electronics, green PCBs, and various consumer and industrial applications.
Key components of FPCBs include Copper clad laminates, adhesive materials, conductive inks, resistors, capacitors, integrated circuits, and solder. Manufacturing advancements, such as the use of polyimide film, stiffeners, and conductive inks, enhance the flexibility and reliability of FPCBs. The market is further expected to benefit from the increasing demand for lightweight, foldable devices in sectors like electric vehicles, healthcare wearables, smart packaging solutions, and automotive electronics integration.
Market Dynamics
Our researchers analyzed the data with 2023 as the base year, along with the key drivers, trends, and challenges. A holistic analysis of drivers will help companies refine their marketing strategies to gain a competitive advantage.
What are the key market drivers leading to the rise In the adoption of Flexible Printed Circuit Board Industry?
Rising adoption of smartphones is the key driver of the market.
-
The global adoption of smartphones is anticipated to grow rapidly due to the availability of affordable smartphones and the expansion of global internet access. In emerging markets like India and China, where disposable incomes are rising and populations are large, the demand for smartphones is increasing. Additionally, smartphones have evolved from 4G LTE to 5G, with 5G smartphones requiring more space for RF front ends due to the complexity of massive multiple-input multiple-output (MIMO) antenna systems. As the volume of data processed by 5G systems grows, the need for higher battery capacity will also increase.
-
This necessitates further miniaturization and compression of PCBs and electronic components to achieve higher density and smaller form factors, leading to the development of thinner, more complex high-density interconnect (HDI) PCBs. In 2023, the global flexible printed circuit board market has been heavily influenced by the increasing demand for flexible PCBs in mobile devices. The rise in smartphone adoption in developing Asian countries is further boosting this trend. With the rising number of mobile devices, the market for flexible PCBs is expanding.
What are the market trends shaping the Flexible Printed Circuit Board Industry?
Increasing industry automation is the upcoming market trend.
-
The adoption of automation in industries is rapidly increasing as companies turn to computers and machines for more effective and efficient control systems. To remain competitive in the global flexible printed circuit board market, industries are being driven to implement automation, which helps optimize productivity, reduce operation costs, improve product quality, and enhance safety. One of the key concerns with the rising power density of electrical equipment is ensuring optimal power consumption, and flexible PCBs play a crucial role in enabling efficient power usage within smaller application sizes.
-
Additionally, the growing use of co-bots, industrial robots, and drones is contributing to the rise of industrial automation. Flexible PCBs are expected to see increasing adoption in industrial applications due to their benefits, including significant reductions in space, weight, and costs when compared to equivalent solutions using rigid PCBs. These advantages will drive the growth of the global flexible printed circuit board market during the forecast period.
What challenges does the Flexible Printed Circuit Board Industry face during its growth?
Changing market dynamics is a key challenge affecting the industry growth.
-
The global electronic component market is heavily influenced by the ongoing trade conflict between the US and China. Both nations have imposed tariffs and restrictions on a wide range of goods, including electronic components like flexible PCBs, transformers, and integrated circuits (ICs). These tariffs have led to an increase in the average selling price (ASP) of ICs and the equipment that incorporates these components. Consequently, there has been a decline in demand for these products in the affected markets, resulting in a demand-supply imbalance within the global electronic components market.
-
The US-China trade war is expected to negatively impact the pricing of many components. For instance, the prices of PCBs decreased in 2022 due to the combined effects of the trade war and an oversupply in the market. However, this price reduction may create additional pricing pressures on PCB manufacturers, particularly those with low-profit margins. Such macroeconomic factors heighten operational risks for vendors, which could hinder the growth of the global flexible printed circuit board market during the forecast period.
Exclusive Customer Landscape
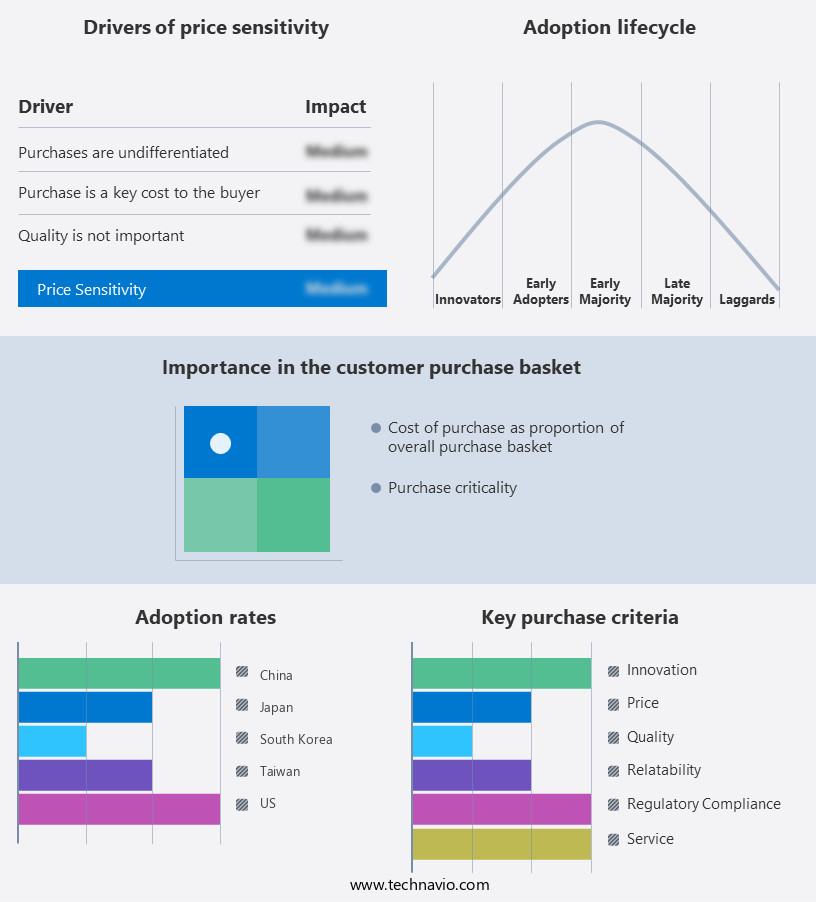
The flexible printed circuit board market forecasting report includes the adoption lifecycle of the market, covering from the innovator's stage to the laggard's stage. It focuses on adoption rates in different regions based on penetration. Furthermore, the flexible printed circuit board market report also includes key purchase criteria and drivers of price sensitivity to help companies evaluate and develop their market growth analysis strategies.
Customer Landscape
Key Companies & Market Insights
Companies are implementing various strategies, such as strategic alliances, flexible printed circuit board market forecast, partnerships, mergers and acquisitions, geographical expansion, and product/service launches, to enhance their presence In the industry.
The industry research and growth report includes detailed analyses of the competitive landscape of the market and information about key companies, including:
- Allpcb
- AT and S Austria Technologie and Systemtechnik Aktiengesellschaft
- Cicor
- Eltek Ltd.
- Flexible Circuit Technologies Inc.
- Gul Technologies Singapore Ltd.
- PCBGOGO
- PCBWay
- RAYMING TECHNOLOGY
- Shengyi Electronics Ltd.
- Shenzhen FastPrint Circuit Tech Co. Ltd.
- Shenzhen Kinwong Electronic Co. Ltd
- Shenzhen Sun and Lynn Circuits Co. Ltd.
- Sumitomo Electric Industries Ltd.
- Sunstone Circuits LLC
- Suntak Technology Co. Ltd.
- Suzhou Dongshan Precision Manufacturing Co.,Ltd.
- TTM Technologies Inc.
- United Microelectronics Corp.
- Zhen Ding Technology Holding Ltd.
Qualitative and quantitative analysis of companies has been conducted to help clients understand the wider business environment as well as the strengths and weaknesses of key industry players. Data is qualitatively analyzed to categorize companies as pure play, category-focused, industry-focused, and diversified; it is quantitatively analyzed to categorize companies as dominant, leading, strong, tentative, and weak.
Research Analyst Overview
The flexible printed circuit board (FPCB) market encompasses a wide range of advanced technologies that cater to the evolving demands of various industries. These boards, which can be bent or folded without damage, offer significant advantages over traditional rigid boards in terms of efficient interconnectivity, circuit complexity, and electronic device miniaturization. FPCBs have gained increasing popularity In the consumer electronics sector, particularly In the development of foldable smartphones. The integration of artificial intelligence (AI) and the Internet of Things (IoT) In these devices necessitates high-speed electronics, which FPCBs can deliver through their flexibility and compact design. Moreover, the automotive industry is also embracing FPCBs for their lightweight and foldable properties, contributing to the growth of this market.
Further, the integration of FPCBs in electric vehicles and healthcare wearables is expected to drive demand, as these applications require efficient interconnectivity and compact components. The manufacturing process of FPCBs involves the use of copper clad laminate, polyimide film, adhesive materials, conductive inks, resistors, capacitors, and integrated circuits. Copper foil is applied to the laminate, followed by the deposition of conductive patterns using photo-imagable processes. The application of adhesive materials, coverlay, stiffeners, and solder paste completes the manufacturing process. Manufacturing advancements, such as technological integration and customization, have enabled the production of tailored FPCBs for various applications. This design freedom and high packaging flexibility have led to improved quality performance and error detection, ensuring the reliability and accuracy of electronic devices.
|
Market Scope |
|
|
Report Coverage |
Details |
|
Page number |
139 |
|
Base year |
2023 |
|
Historic period |
2018-2022 |
|
Forecast period |
2024-2028 |
|
Growth momentum & CAGR |
Accelerate at a CAGR of 3.43% |
|
Market Growth 2024-2028 |
USD 1.6 billion |
|
Market structure |
Fragmented |
|
YoY growth 2023-2024(%) |
3.27 |
|
Key countries |
China, Taiwan, South Korea, US, and Japan |
|
Competitive landscape |
Leading Companies, Market Positioning of Companies, Competitive Strategies, and Industry Risks |
What are the Key Data Covered in this Flexible Printed Circuit Board Market Research and Growth Report?
- CAGR of the Flexible Printed Circuit Board industry during the forecast period
- Detailed information on factors that will drive the market growth and forecasting between 2024 and 2028
- Precise estimation of the size of the market and its contribution of the industry in focus to the parent market
- Accurate predictions about upcoming growth and trends and changes in consumer behaviour
- Growth of the market across APAC, North America, Europe, Middle East and Africa, and South America
- Thorough analysis of the market's competitive landscape and detailed information about companies
- Comprehensive analysis of factors that will challenge the flexible printed circuit board market growth of industry companies
We can help! Our analysts can customize this flexible printed circuit board market research report to meet your requirements.


