Floating Hotels Market Analysis North America, APAC, Europe, South America, Middle East and Africa - US, China, Canada, Japan, India, Germany, South Korea, UK, France, Italy - Size and Forecast 2024-2028

Floating Hotels Market Analysis North America, APAC, Europe, South America, Middle East and Africa - US, China, Canada, Japan, India, Germany, South Korea, UK, France, Italy - Size and Forecast 2024-2028

Published: Nov 2024 158 Pages SKU: IRTNTR74389

Market Overview at a Glance

$1.76 B
Market Opportunity
6.7%
CAGR
6.2
YoY growth 2023-2024(%)

Floating Hotels Market Size and Trends

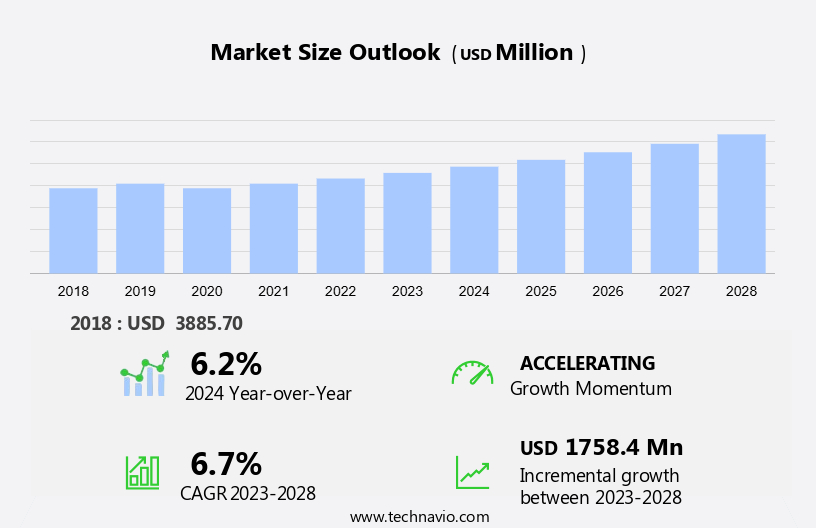
The floating hotels market size is forecast to increase by USD 1.76 billion at a CAGR of 6.7% between 2023 and 2028. The floating hotel market is experiencing significant growth due to several key factors. First, the rise in disposable income among travelers and the expansion of the travel and tourism industry globally are driving demand for unique and luxurious accommodations. Online travel providers and booking channels have made it easier than ever for consumers to make reservations for single occupancy rooms on these floating hotels. The trend towards experiential traveling and affordable luxury is also contributing to the market's growth. Floating hotels offer a new and exciting way to experience ocean cruises and lavish accommodations, making them an attractive option for travelers looking for something beyond traditional hotels. Micro hotels, which offer smaller, more efficient rooms, are also gaining popularity in the floating hotel market due to their affordability and convenience. Overall, the floating hotel market is poised for continued growth as travelers seek out new and unique experiences.

Floating Hotels Market Size

 Request Free Sample

Floating hotels, also known as hotel boats or floating resorts, offer travelers unique and memorable experiences by providing luxurious accommodations on water bodies. These structures provide a perfect blend of on-water adventure and comfort, making them an attractive option for tourists seeking experiential traveling. Location and Setting: Floating hotels are situated on various water bodies, including oceans, rivers, and lakes. The breathtaking views of the surrounding water and landscapes contribute significantly to the allure of these accommodations. Tourists can enjoy the serene ambiance and tranquility of the water while experiencing the comforts of lavish accommodations. Floating hotels offer a range of onboard facilities, including restaurants, bars, spas, fitness centers, and various water activities. These facilities cater to diverse leisure preferences, ensuring that guests have an enjoyable and relaxing stay. Activities such as swimming, snorkeling, and water skiing are popular options for guests seeking adventure.

Further, floating hotels provide an unparalleled travel experience, combining the convenience of a hotel with the excitement of being on the water. These accommodations are not only popular among tourists but also contribute to the growth of sustainable tourism. Many floating hotels employ eco-friendly shipbuilding technologies and follow sustainable practices to minimize their environmental impact. The floating hotel market continues to expand as travelers seek unique and memorable experiences. Coastal and cruise tourism are significant contributors to the growth of this market, with an increasing number of tourists opting for floating hotels as their preferred accommodation option. Construction of new floating hotels and the refurbishment of existing ones are ongoing to cater to the growing demand. Floating hotels offer travelers a unique and unforgettable accommodation experience. With their breathtaking views, onboard facilities, and various activities, these accommodations provide a perfect blend of adventure and comfort. The floating hotel market is expected to grow as more tourists seek experiential traveling and sustainable accommodation options.

Market Segmentation

The market research report provides comprehensive data (region-wise segment analysis), with forecasts and estimates in "USD billion" for the period 2024-2028, as well as historical data from 2018 - 2022 for the following segments.

  • Price Range
    • Premium
    • Super premium
    • Regular
  • Geography
    • North America
      • Canada
      • US
    • APAC
      • China
      • India
      • Japan
      • South Korea
    • Europe
      • Germany
      • UK
      • France
      • Italy
    • South America
    • Middle East and Africa

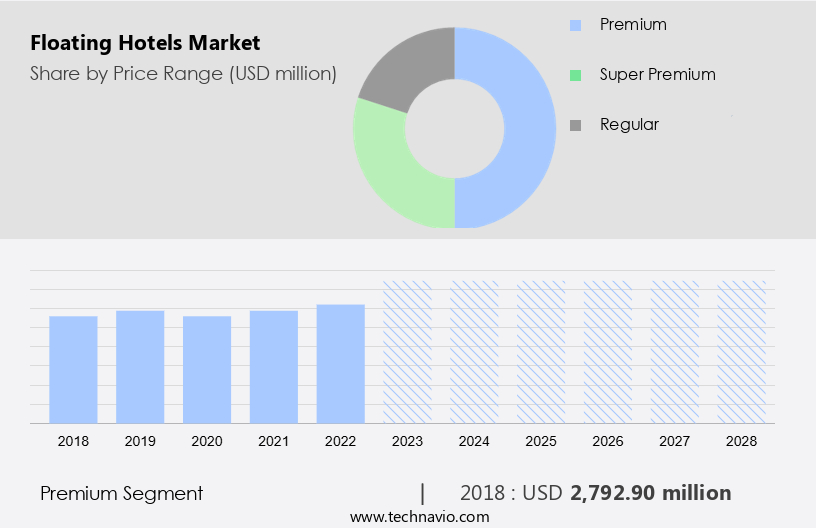
By Price Range Insights

The premium segment is estimated to witness significant growth during the forecast period. The floating hotels market is experiencing a notable expansion, particularly in the premium segment. This growth can be attributed to the escalating travel and tourism industry, with a strong emphasis on luxury experiences and adventure tourism. Digital nomads and high-end travelers are increasingly seeking unique accommodations that offer a blend of comfort, convenience, and exclusivity. Floating hotels provide an unparalleled experience, allowing tourists to immerse themselves in marine life and biodiversity. These accommodations offer a range of amenities, including educational activities, conference spaces, and exceptional services.

Floating Hotels Market Size

Get a glance at the market share of various segments Download the PDF Sample

The premium segment was valued at USD 2.79 billion in 2018. The allure of these offerings has attracted a significant number of tourists, especially honeymooners, seeking memorable experiences. The premium price range segment is expected to witness substantial growth due to the rising demand for luxurious and personalized services. Consumers are willing to pay a premium for amenities such as stunning designs, pleasant fragrances, enhanced security, and comfortable rooms with luxurious beds. These features cater to the discerning traveler's preferences, making the floating hotels market an attractive investment opportunity. In conclusion, the floating hotels market is poised for growth, driven by the increasing demand for unique and luxurious travel experiences. The premium segment, in particular, is expected to thrive due to the rising trend of adventure tourism and the growing number of digital nomads seeking comfortable and convenient accommodations. Floating hotels offer a perfect blend of luxury, adventure, and convenience, making them an excellent choice for tourists seeking a memorable and exclusive travel experience.

Regional Analysis

Floating Hotels Market Share by Geography

For more insights on the market share of various regions Download PDF Sample now!

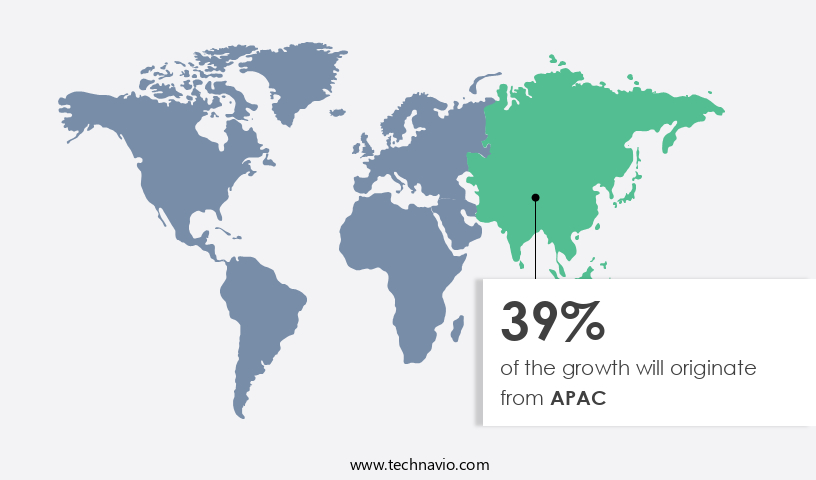
APAC is estimated to contribute 39% to the growth of the global market during the forecast period. Technavio's analysts have elaborately explained the regional trends and drivers that shape the market during the forecast period.

In North America, the floating hotels market is experiencing growth due to the increasing trend of millennials spending on travel activities and the rising demand for affordable accommodations. Notable vendors in the region include SAS CITY FLOATING AUSTERLITZ, The Manta Resort, River Kwai Jungle Rafts, Unique and Unusual Hotels, Secret Retreats, Aqua Expeditions, and others, particularly in countries like Canada, Mexico, and the US. With growing disposable income and changing lifestyles, the middle class is seeking international travel and investing more in leisure activities, such as exploratory travel. According to US travel and tourism statistics, Americans spent approximately USD 1.99 billion on overseas travel in 2023. Online booking channels have become increasingly popular for booking floating hotels, offering convenience and accessibility for travelers. Medical tourism is also a significant factor driving demand for floating hotels, as they offer unique and accessible healthcare facilities for patients seeking treatment abroad.

Our researchers analyzed the data with 2023 as the base year, along with the key drivers, trends, and challenges. A holistic analysis of drivers will help companies refine their marketing strategies to gain a competitive advantage.

Floating Hotels Market Driver

Growing disposable income among travelers is notably driving market growth. The floating hotel market is experiencing significant growth due to the increasing number of travelers in North America who prefer budget-friendly and unique accommodation options. With breathtaking views and a serene ambiance, floating hotels offer an unparalleled experience for tourists looking to explore water bodies. These hotels provide onboard facilities such as restaurants, bars, and various activities, making them a popular choice for vacationers.

Further, the rise in disposable income in North America has led to an increase in spending on travel activities. For instance, from 2000 to 2022, the disposable per capita income in Canada increased by approximately 60%. On average, households in Canada spent 2.09% of their gross-adjusted disposable income on leisure activities in 2022. This trend is expected to continue, driving the demand for floating hotels in the region. Thus, such factors are driving the growth of the market during the forecast period.

Floating Hotels Market Trends

Growth in travel and tourism globally is the key trend in the market. The tourism industry has experienced a notable expansion in recent years, with Europe, Southeast Asia, and North America leading the way. Countries like Panama, Costa Rica, Chile, and Argentina in South America are also gaining ground in this sector. In response to this industry growth, the number of floating hotels worldwide has risen. The United Nations General Assembly declared 2017 as the International Year of Sustainable Tourism for Development, highlighting the significant economic influence of tourism.

Moroever, online travel providers have capitalized on this trend, offering booking channels for floating hotels through online reservation systems. These unique accommodations provide affordable luxury for travelers seeking experiential adventures. Floating hotels offer a distinct alternative to ocean cruises, providing lavish accommodations reminiscent of micro hotels. Thus, such trends will shape the growth of the market during the forecast period.

Floating Hotels Market Challenge

Presence of affordable hotels is the major challenge that affects the growth of the market. Floating hotels, which offer unique experiences with onboard amenities such as spas, fitness centers, swimming pools, water sports, and more, face significant challenges in the market. The high construction costs, which include designing and engineering the floating structure, procuring machinery and equipment, and installing facilities, can deter potential investors. Ongoing operational expenses, including maintenance, staffing, and fuel, are also higher than traditional hotels, making it challenging to maintain affordable prices. Seasonal demand fluctuations further impact revenue and profitability, particularly during off-peak seasons, which can pose challenges in maintaining occupancy rates. Despite these challenges, floating hotels continue to attract adventurous tourists, nature enthusiasts, honeymooners, and those seeking action-packed vacations. Swimming with dolphins, exploring coral reefs, and enjoying water sports are just a few of the experiences that set floating hotels apart from traditional accommodations. As the demand for unique travel experiences grows, the floating hotel market is expected to expand.

However, to stay competitive, floating hotel operators must focus on providing exceptional guest experiences and maintaining high-quality amenities. Marketing efforts should target specific demographics, such as adventure seekers and honeymooners, to maximize revenue during peak seasons. Additionally, partnerships with local tour operators and attractions can help attract guests and increase occupancy rates during off-peak seasons. In conclusion, while the floating hotel market presents unique challenges, it also offers significant opportunities for growth. By focusing on guest experiences, maintaining high-quality amenities, and targeting specific demographics, floating hotel operators can differentiate themselves from traditional hotels and attract a loyal customer base. Hence, the above factors will impede the growth of the market during the forecast period.

Exclusive Customer Landscape

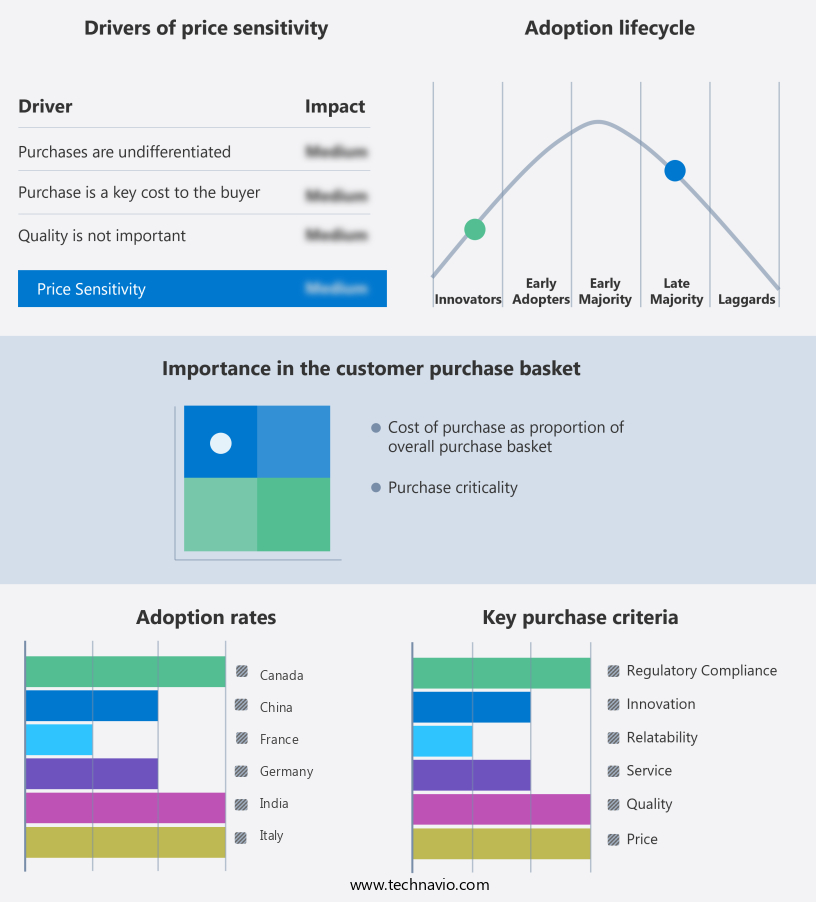
The market forecasting report includes the adoption lifecycle of the market, covering from the innovator's stage to the laggard's stage. It focuses on adoption rates in different regions based on penetration. Furthermore, the report also includes key purchase criteria and drivers of price sensitivity to help companies evaluate and develop their market growth analysis strategies.

Floating Hotels Market Share by Geography

 Customer Landscape

Key Companies & Market Insights

Companies are implementing various strategies, such as strategic alliances, partnerships, mergers and acquisitions, geographical expansion, and product/service launches, to enhance their presence in the market.

Aqua Expeditions - The company offers floating hotel services such as 4 Rivers Floating Lodge.

The market research and growth report also includes detailed analyses of the competitive landscape of the market and information about key companies, including:

  • Alila Hotels and Resorts
  • Aqua Expeditions
  • Archello BV
  • COMO Hotels and Resorts
  • Conrad Maldives Rangali Island
  • Four Seasons Hotels Ltd.
  • MEYER Floating Solutions Ltd.
  • Poovar Island Resort
  • River Kwai Jungle Rafts
  • Salt and Sill
  • SAS CITY FLOATING AUSTERLITZ
  • Secret Retreats
  • Solent Forts
  • Sunborn London
  • The Manta Resort
  • The Zambezi Queen Collection
  • Unique and Unusual Hotels
  • Village Flottant de Pressac Etang du Ponteil

Qualitative and quantitative analysis of companies has been conducted to help clients understand the wider business environment as well as the strengths and weaknesses of key market players. Data is qualitatively analyzed to categorize companies as pure play, category-focused, industry-focused, and diversified; it is quantitatively analyzed to categorize companies as dominant, leading, strong, tentative, and weak.

The floating hotel market caters to travelers seeking unique and unforgettable accommodation experiences on water bodies. These hotels offer breathtaking views and a serene ambiance, making them popular among adventurous tourists, nature enthusiasts, honeymooners, and digital nomads. Onboard facilities include restaurants, bars, spas, fitness centers, swimming pools, water sports, and various activities to keep guests entertained. Floating hotels provide lavish accommodations, ranging from micro hotels to full-service ones, with options for single and double occupancy rooms. Construction of these hotels employs advanced shipbuilding technologies, ensuring premium pricing for the luxury experiences they offer. Tourism industries, including ocean cruises, ecotourism, sustainable tourism, and coastal tourism, have embraced the concept of floating hotels. Tourists can enjoy various leisure preferences, from action-packed vacations to educational activities, and even swim with dolphins in some cases. Online travel providers and booking channels facilitate easy online reservations for these hotels, making them accessible to a wider audience. With a focus on clean energy and eco-friendly practices, floating hotels cater to the growing demand for sustainable tourism.

Market Scope

Report Coverage

Details

Page number

158

Base year

2023

Historic period

2018-2022

Forecast period

2024-2028

Growth momentum & CAGR

Accelerate at a CAGR of 6.7%

Market growth 2024-2028

USD 1.76 billion

Market structure

Fragmented

YoY growth 2023-2024(%)

6.2

Regional analysis

North America, APAC, Europe, South America, and Middle East and Africa

Performing market contribution

APAC at 39%

Key countries

US, China, Canada, Japan, India, Germany, South Korea, UK, France, and Italy

Competitive landscape

Leading Companies, Market Positioning of Companies, Competitive Strategies, and Industry Risks

Key companies profiled

Alila Hotels and Resorts, Aqua Expeditions, Archello BV, COMO Hotels and Resorts, Conrad Maldives Rangali Island, Four Seasons Hotels Ltd., MEYER Floating Solutions Ltd., Poovar Island Resort, River Kwai Jungle Rafts, Salt and Sill, SAS CITY FLOATING AUSTERLITZ, Secret Retreats, Solent Forts, Sunborn London, The Manta Resort, The Zambezi Queen Collection, Unique and Unusual Hotels, and Village Flottant de Pressac Etang du Ponteil

Market dynamics

Parent market analysis, Market growth inducers and obstacles, Fast-growing and slow-growing segment analysis, COVID-19 impact and recovery analysis and future consumer dynamics, Market condition analysis for the market forecast period.

Customization purview

If our market report has not included the data that you are looking for, you can reach out to our analysts and get segments customized.

Download PDF Sample

What are the Key Data Covered in this Market Research Report?

  • CAGR of the market during the forecast period
  • Detailed information on factors that will drive the market growth and forecasting between 2024 and 2028
  • Precise estimation of the size of the market  and its contribution of the market in focus to the parent market
  • Accurate predictions about upcoming market growth and trends and changes in consumer behaviour
  • Growth of the market across North America, APAC, Europe, South America, and Middle East and Africa
  • Thorough analysis of the market's competitive landscape and detailed information about companies
  • Comprehensive analysis of factors that will challenge the growth of market companies

We can help! Our analysts can customize this market research report to meet your requirements. Get in touch

1 Executive Summary

  • 1.1 Market overview
    • Executive Summary - Chart on Market Overview
    • Executive Summary - Data Table on Market Overview
    • Executive Summary - Chart on Global Market Characteristics
    • Executive Summary - Chart on Market by Geography
    • Executive Summary - Chart on Market Segmentation by Price Range
    • Executive Summary - Chart on Incremental Growth
    • Executive Summary - Data Table on Incremental Growth
    • Executive Summary - Chart on Company Market Positioning

2 Technavio Analysis

  • 2.1 Analysis of price sensitivity, lifecycle, customer purchase basket, adoption rates, and purchase criteria
    • Analysis of price sensitivity, lifecycle, customer purchase basket, adoption rates, and purchase criteria
  • 2.2 Criticality of inputs and Factors of differentiation
    • Overview on criticality of inputs and factors of differentiation
  • 2.3 Factors of disruption
    • Overview on factors of disruption
  • 2.4 Impact of drivers and challenges
    • Impact of drivers and challenges in 2023 and 2028

3 Market Landscape

  • 3.1 Market ecosystem
    • Parent Market
    • Data Table on - Parent Market
  • 3.2 Market characteristics
    • Market characteristics analysis
  • 3.3 Value chain analysis
    • Value Chain Analysis

4 Market Sizing

  • 4.1 Market definition
    • Offerings of companies included in the market definition
  • 4.2 Market segment analysis
    • Market segments
  • 4.3 Market size 2023
    • 4.4 Market outlook: Forecast for 2023-2028
      • Chart on Global - Market size and forecast 2023-2028 ($ million)
      • Data Table on Global - Market size and forecast 2023-2028 ($ million)
      • Chart on Global Market: Year-over-year growth 2023-2028 (%)
      • Data Table on Global Market: Year-over-year growth 2023-2028 (%)

    5 Historic Market Size

    • 5.1 Global Floating Hotels Market 2018 - 2022
      • Historic Market Size - Data Table on Global Floating Hotels Market 2018 - 2022 ($ million)
    • 5.2 Price Range segment analysis 2018 - 2022
      • Historic Market Size - Price Range Segment 2018 - 2022 ($ million)
    • 5.3 Geography segment analysis 2018 - 2022
      • Historic Market Size - Geography Segment 2018 - 2022 ($ million)
    • 5.4 Country segment analysis 2018 - 2022
      • Historic Market Size - Country Segment 2018 - 2022 ($ million)

    6 Qualitative Analysis

    • 6.1 The AI impact on Global Floating Hotels Market

      7 Five Forces Analysis

      • 7.1 Five forces summary
        • Five forces analysis - Comparison between 2023 and 2028
      • 7.2 Bargaining power of buyers
        • Bargaining power of buyers - Impact of key factors 2023 and 2028
      • 7.3 Bargaining power of suppliers
        • Bargaining power of suppliers - Impact of key factors in 2023 and 2028
      • 7.4 Threat of new entrants
        • Threat of new entrants - Impact of key factors in 2023 and 2028
      • 7.5 Threat of substitutes
        • Threat of substitutes - Impact of key factors in 2023 and 2028
      • 7.6 Threat of rivalry
        • Threat of rivalry - Impact of key factors in 2023 and 2028
      • 7.7 Market condition
        • Chart on Market condition - Five forces 2023 and 2028

      8 Market Segmentation by Price Range

      • 8.1 Market segments
        • Chart on Price Range - Market share 2023-2028 (%)
        • Data Table on Price Range - Market share 2023-2028 (%)
      • 8.2 Comparison by Price Range
        • Chart on Comparison by Price Range
        • Data Table on Comparison by Price Range
      • 8.3 Premium - Market size and forecast 2023-2028
        • Chart on Premium - Market size and forecast 2023-2028 ($ million)
        • Data Table on Premium - Market size and forecast 2023-2028 ($ million)
        • Chart on Premium - Year-over-year growth 2023-2028 (%)
        • Data Table on Premium - Year-over-year growth 2023-2028 (%)
      • 8.4 Super premium - Market size and forecast 2023-2028
        • Chart on Super premium - Market size and forecast 2023-2028 ($ million)
        • Data Table on Super premium - Market size and forecast 2023-2028 ($ million)
        • Chart on Super premium - Year-over-year growth 2023-2028 (%)
        • Data Table on Super premium - Year-over-year growth 2023-2028 (%)
      • 8.5 Regular - Market size and forecast 2023-2028
        • Chart on Regular - Market size and forecast 2023-2028 ($ million)
        • Data Table on Regular - Market size and forecast 2023-2028 ($ million)
        • Chart on Regular - Year-over-year growth 2023-2028 (%)
        • Data Table on Regular - Year-over-year growth 2023-2028 (%)
      • 8.6 Market opportunity by Price Range
        • Market opportunity by Price Range ($ million)
        • Data Table on Market opportunity by Price Range ($ million)

      9 Customer Landscape

      • 9.1 Customer landscape overview
        • Analysis of price sensitivity, lifecycle, customer purchase basket, adoption rates, and purchase criteria

      10 Geographic Landscape

      • 10.1 Geographic segmentation
        • Chart on Market share by geography 2023-2028 (%)
        • Data Table on Market share by geography 2023-2028 (%)
      • 10.2 Geographic comparison
        • Chart on Geographic comparison
        • Data Table on Geographic comparison
      • 10.3 North America - Market size and forecast 2023-2028
        • Chart on North America - Market size and forecast 2023-2028 ($ million)
        • Data Table on North America - Market size and forecast 2023-2028 ($ million)
        • Chart on North America - Year-over-year growth 2023-2028 (%)
        • Data Table on North America - Year-over-year growth 2023-2028 (%)
      • 10.4 APAC - Market size and forecast 2023-2028
        • Chart on APAC - Market size and forecast 2023-2028 ($ million)
        • Data Table on APAC - Market size and forecast 2023-2028 ($ million)
        • Chart on APAC - Year-over-year growth 2023-2028 (%)
        • Data Table on APAC - Year-over-year growth 2023-2028 (%)
      • 10.5 Europe - Market size and forecast 2023-2028
        • Chart on Europe - Market size and forecast 2023-2028 ($ million)
        • Data Table on Europe - Market size and forecast 2023-2028 ($ million)
        • Chart on Europe - Year-over-year growth 2023-2028 (%)
        • Data Table on Europe - Year-over-year growth 2023-2028 (%)
      • 10.6 South America - Market size and forecast 2023-2028
        • Chart on South America - Market size and forecast 2023-2028 ($ million)
        • Data Table on South America - Market size and forecast 2023-2028 ($ million)
        • Chart on South America - Year-over-year growth 2023-2028 (%)
        • Data Table on South America - Year-over-year growth 2023-2028 (%)
      • 10.7 Middle East and Africa - Market size and forecast 2023-2028
        • Chart on Middle East and Africa - Market size and forecast 2023-2028 ($ million)
        • Data Table on Middle East and Africa - Market size and forecast 2023-2028 ($ million)
        • Chart on Middle East and Africa - Year-over-year growth 2023-2028 (%)
        • Data Table on Middle East and Africa - Year-over-year growth 2023-2028 (%)
      • 10.8 US - Market size and forecast 2023-2028
        • Chart on US - Market size and forecast 2023-2028 ($ million)
        • Data Table on US - Market size and forecast 2023-2028 ($ million)
        • Chart on US - Year-over-year growth 2023-2028 (%)
        • Data Table on US - Year-over-year growth 2023-2028 (%)
      • 10.9 China - Market size and forecast 2023-2028
        • Chart on China - Market size and forecast 2023-2028 ($ million)
        • Data Table on China - Market size and forecast 2023-2028 ($ million)
        • Chart on China - Year-over-year growth 2023-2028 (%)
        • Data Table on China - Year-over-year growth 2023-2028 (%)
      • 10.10 Canada - Market size and forecast 2023-2028
        • Chart on Canada - Market size and forecast 2023-2028 ($ million)
        • Data Table on Canada - Market size and forecast 2023-2028 ($ million)
        • Chart on Canada - Year-over-year growth 2023-2028 (%)
        • Data Table on Canada - Year-over-year growth 2023-2028 (%)
      • 10.11 Japan - Market size and forecast 2023-2028
        • Chart on Japan - Market size and forecast 2023-2028 ($ million)
        • Data Table on Japan - Market size and forecast 2023-2028 ($ million)
        • Chart on Japan - Year-over-year growth 2023-2028 (%)
        • Data Table on Japan - Year-over-year growth 2023-2028 (%)
      • 10.12 India - Market size and forecast 2023-2028
        • Chart on India - Market size and forecast 2023-2028 ($ million)
        • Data Table on India - Market size and forecast 2023-2028 ($ million)
        • Chart on India - Year-over-year growth 2023-2028 (%)
        • Data Table on India - Year-over-year growth 2023-2028 (%)
      • 10.13 Germany - Market size and forecast 2023-2028
        • Chart on Germany - Market size and forecast 2023-2028 ($ million)
        • Data Table on Germany - Market size and forecast 2023-2028 ($ million)
        • Chart on Germany - Year-over-year growth 2023-2028 (%)
        • Data Table on Germany - Year-over-year growth 2023-2028 (%)
      • 10.14 South Korea - Market size and forecast 2023-2028
        • Chart on South Korea - Market size and forecast 2023-2028 ($ million)
        • Data Table on South Korea - Market size and forecast 2023-2028 ($ million)
        • Chart on South Korea - Year-over-year growth 2023-2028 (%)
        • Data Table on South Korea - Year-over-year growth 2023-2028 (%)
      • 10.15 UK - Market size and forecast 2023-2028
        • Chart on UK - Market size and forecast 2023-2028 ($ million)
        • Data Table on UK - Market size and forecast 2023-2028 ($ million)
        • Chart on UK - Year-over-year growth 2023-2028 (%)
        • Data Table on UK - Year-over-year growth 2023-2028 (%)
      • 10.16 France - Market size and forecast 2023-2028
        • Chart on France - Market size and forecast 2023-2028 ($ million)
        • Data Table on France - Market size and forecast 2023-2028 ($ million)
        • Chart on France - Year-over-year growth 2023-2028 (%)
        • Data Table on France - Year-over-year growth 2023-2028 (%)
      • 10.17 Italy - Market size and forecast 2023-2028
        • Chart on Italy - Market size and forecast 2023-2028 ($ million)
        • Data Table on Italy - Market size and forecast 2023-2028 ($ million)
        • Chart on Italy - Year-over-year growth 2023-2028 (%)
        • Data Table on Italy - Year-over-year growth 2023-2028 (%)
      • 10.18 Market opportunity by geography
        • Market opportunity by geography ($ million)
        • Data Tables on Market opportunity by geography ($ million)

      11 Drivers, Challenges, and Opportunity/Restraints

      • 11.1 Market drivers
        • 11.2 Market challenges
          • 11.3 Impact of drivers and challenges
            • Impact of drivers and challenges in 2023 and 2028
          • 11.4 Market opportunities/restraints

            12 Competitive Landscape

            • 12.1 Overview
              • 12.2 Competitive Landscape
                • Overview on criticality of inputs and factors of differentiation
              • 12.3 Landscape disruption
                • Overview on factors of disruption
              • 12.4 Industry risks
                • Impact of key risks on business

              13 Competitive Analysis

              • 13.1 Companies profiled
                • Companies covered
              • 13.2 Company ranking index
                • Company ranking index
              • 13.3 Market positioning of companies
                • Matrix on companies position and classification
              • 13.4 Aqua Expeditions
                • Aqua Expeditions - Overview
                • Aqua Expeditions - Product / Service
                • Aqua Expeditions - Key offerings
                • SWOT
              • 13.5 Archello BV
                • Archello BV - Overview
                • Archello BV - Product / Service
                • Archello BV - Key offerings
                • SWOT
              • 13.6 River Kwai Jungle Rafts
                • River Kwai Jungle Rafts - Overview
                • River Kwai Jungle Rafts - Product / Service
                • River Kwai Jungle Rafts - Key offerings
                • SWOT
              • 13.7 SAS CITY FLOATING AUSTERLITZ
                • SAS CITY FLOATING AUSTERLITZ - Overview
                • SAS CITY FLOATING AUSTERLITZ - Product / Service
                • SAS CITY FLOATING AUSTERLITZ - Key offerings
                • SWOT
              • 13.8 Secret Retreats
                • Secret Retreats - Overview
                • Secret Retreats - Product / Service
                • Secret Retreats - Key offerings
                • SWOT
              • 13.9 Sunborn London
                • Sunborn London - Overview
                • Sunborn London - Product / Service
                • Sunborn London - Key offerings
                • SWOT
              • 13.10 The Manta Resort
                • The Manta Resort - Overview
                • The Manta Resort - Product / Service
                • The Manta Resort - Key offerings
                • SWOT
              • 13.11 The Zambezi Queen Collection
                • The Zambezi Queen Collection - Overview
                • The Zambezi Queen Collection - Product / Service
                • The Zambezi Queen Collection - Key offerings
                • SWOT
              • 13.12 Unique and Unusual Hotels
                • Unique and Unusual Hotels - Overview
                • Unique and Unusual Hotels - Product / Service
                • Unique and Unusual Hotels - Key offerings
                • SWOT

              14 Appendix

              • 14.1 Scope of the report
                • 14.2 Inclusions and exclusions checklist
                  • Inclusions checklist
                  • Exclusions checklist
                • 14.3 Currency conversion rates for US$
                  • Currency conversion rates for US$
                • 14.4 Research methodology
                  • Research methodology
                • 14.5 Data procurement
                  • Information sources
                • 14.6 Data validation
                  • Data validation
                • 14.7 Validation techniques employed for market sizing
                  • Validation techniques employed for market sizing
                • 14.8 Data synthesis
                  • Data synthesis
                • 14.9 360 degree market analysis
                  • 360 degree market analysis
                • 14.10 List of abbreviations
                  • List of abbreviations

                Research Methodology

                Technavio presents a detailed picture of the market by way of study, synthesis, and summation of data from multiple sources. The analysts have presented the various facets of the market with a particular focus on identifying the key industry influencers. The data thus presented is comprehensive, reliable, and the result of extensive research, both primary and secondary.

                INFORMATION SOURCES

                Primary sources

                • Manufacturers and suppliers
                • Channel partners
                • Industry experts
                • Strategic decision makers

                Secondary sources

                • Industry journals and periodicals
                • Government data
                • Financial reports of key industry players
                • Historical data
                • Press releases

                DATA ANALYSIS

                Data Synthesis

                • Collation of data
                • Estimation of key figures
                • Analysis of derived insights

                Data Validation

                • Triangulation with data models
                • Reference against proprietary databases
                • Corroboration with industry experts

                REPORT WRITING

                Qualitative

                • Market drivers
                • Market challenges
                • Market trends
                • Five forces analysis

                Quantitative

                • Market size and forecast
                • Market segmentation
                • Geographical insights
                • Competitive landscape

                Interested in this report?

                Get your sample now to see our research methodology and insights!

                Download Now

                Frequently Asked Questions

                Floating Hotels market growth will increase by $ 1758.4 mn during 2024-2028.

                The Floating Hotels market is expected to grow at a CAGR of 6.7% during 2024-2028.

                Floating Hotels market is segmented by Price Range( Premium, Super premium, Regular)

                Alila Hotels and Resorts, Aqua Expeditions, Archello BV, COMO Hotels and Resorts, Conrad Maldives Rangali Island, Four Seasons Hotels Ltd., MEYER Floating Solutions Ltd., Poovar Island Resort, River Kwai Jungle Rafts, Salt and Sill, SAS CITY FLOATING AUSTERLITZ, Secret Retreats, Solent Forts, Sunborn London, The Manta Resort, The Zambezi Queen Collection, Unique and Unusual Hotels, Village Flottant de Pressac Etang du Ponteil are a few of the key vendors in the Floating Hotels market.

                APAC will register the highest growth rate of 39% among the other regions. Therefore, the Floating Hotels market in APAC is expected to garner significant business opportunities for the vendors during the forecast period.

                US, China, Canada, Japan, India, Germany, South Korea, UK, France, Italy

                • Growing disposable income among travelersThe millennial population in these countries is steadily growing is the driving factor this market.
                • along with their travel preferences is the driving factor this market.
                • seeking budget-friendly travel options and often aiming to travel a couple of times a year. Such factors are expected to drive the growth of the global floating hotels market in 2023. The rise in consumer disposable income in North America in recent years has also boosted spending on travel activities is the driving factor this market.
                • increasing the usage of floating hotels. For instance is the driving factor this market.
                • from 2000 to 2022 is the driving factor this market.
                • the disposable per capita income in Canada increased by around 60%. In Canada is the driving factor this market.
                • on average is the driving factor this market.
                • households spent 2.09% of their gross-adjusted disposable income on leisure activities. Therefore is the driving factor this market.
                • the rising disposable income leads to an increase in the purchasing power of travelers is the driving factor this market.
                • which is anticipated to drive the growth of the global floating hotels market in 2024. The hospitality and tourism industry in developed economies such as Canada is the driving factor this market.
                • Mexico is the driving factor this market.
                • and the US has gained significant momentum. This industry plays a pivotal role in bolstering these countries' economies. Factors such as the rising middle-class population and the increasing disposable income of travelers in these nations have fueled spending on exploratory travel activities. These travelers are increasingly in the purchasing power of travelers is the driving factor this market.
                • which will drive the growth of the global floating hotels market during the forecast period. is the driving factor this market.

                The Floating Hotels market vendors should focus on grabbing business opportunities from the Premium segment as it accounted for the largest market share in the base year.