Floriculture Market Analysis APAC, Europe, North America, South America, Middle East and Africa - US, China, UK, Germany, Japan - Size and Forecast 2024-2028

Floriculture Market Analysis APAC, Europe, North America, South America, Middle East and Africa - US, China, UK, Germany, Japan - Size and Forecast 2024-2028

Published: Aug 2024 168 Pages SKU: IRTNTR44575

Market Overview at a Glance

$61.1 B
Market Opportunity
10.43%
CAGR
8.62
YoY growth 2023-2024(%)

Floriculture Market Size 2024-2028

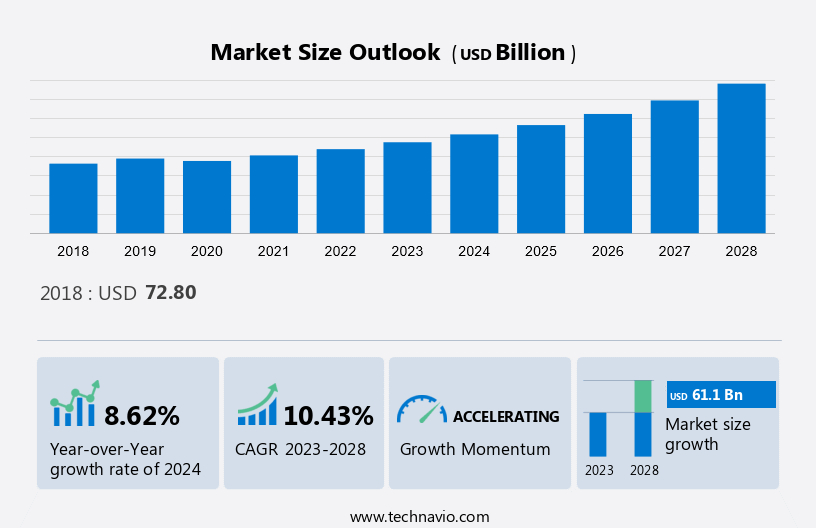
The Global Floriculture Market size is forecast to increase by USD 61.1 billion at a CAGR of 10.43% between 2023 and 2028. The market experiences robust growth driven by factors such as the lucrative profits linked with cultivating ornamental plants and the widespread utilization of flowers and plants for aesthetic enhancement. Additionally, the market benefits from the increasing popularity of online shopping platforms, which offer convenient access to a wide variety of floral products and accessories. This convergence of profitability, aesthetic demand, and e-commerce convenience contributes to the flourishing dynamics of the global floriculture industry. This market analysis and report also includes an in-depth analysis of drivers, trends, and challenges. Furthermore, the report includes historic market data from 2018 to 2022.

What will be the size of the Floriculture Market During the Forecast Period?

Floriculture Market Size

To learn more about this report, Request Free Sample

The market thrives on the cultivation and trade of a diverse array of floral crops, including cut flowers, potted plants, and bedding plants, among others. Horticulture practices are employed for the cultivation of these plants, which are cherished for their aesthetic appeal and commercial value. With a focus on personalization and customization, floriculture caters to various consumer preferences and demands, offering an extensive range of ornamental foliage and floral products worldwide. Greenhouses play a pivotal role in ensuring year-round production and availability of flowers, contributing to the vibrant dynamics of the global floriculture industry.

Market Segmentation

Direct-to-consumer sales models have emerged as a prominent avenue, leveraging technology to streamline transactions and reach a wider audience. Additionally, institutions and events segments, including hotels, resorts, and spas, contribute significantly to the demand for floral arrangements. Various types of flora, such as chestnut, plum, maple, and willow shoots, cater to diverse needs, including basket weaving and ornamental purposes. Moreover, the inclusion of lavender and other woody ornamentals underscores the market's versatility and appeal across different consumer preferences and industries.
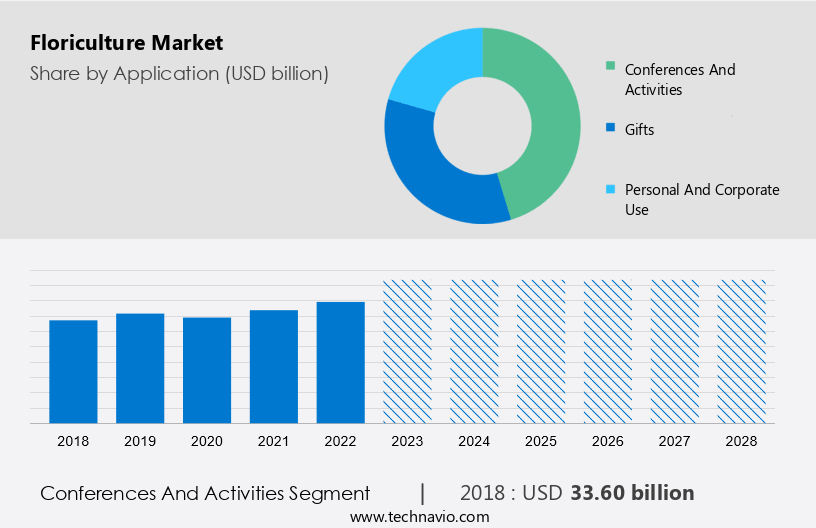
By Application

The market share growth by the conferences and activities segment will be significant during the forecast period. These include one-time or recurring purchases in a corporate environment, such as conferences and workshops, and ceremonies, such as weddings and funerals.

Floriculture Market Size

Get a glance at the market contribution of various segments Request a PDF Sample

The conferences and activities segment was valued at USD 33.6 billion in 2018. The ceremonial usage of flowers is regarded as important in various Asian countries. For example, a variety of flowers, such as carnations are commonly used at funerals. Hence, with the increased use of flowers in conferences and other events, the market is expected to grow.  Moreover, the segment is also drastically driven by wedding activities across the world, as people use many types of flowers for wedding arrangements and decorations. There are many wedding organizers who undertake contracts to make arrangements for all the different marriage-related ceremonies or functions. Such wedding organizers have direct contact with flower suppliers who provide them with a consistent supply of flowers. Such event organizers are primary consumers of flowers throughout the year as they take contracts for several events and functions that are held during the whole year. Therefore, such factors are expected to drive the growth of the market during the forecast period.

Key Regions

Floriculture Market Share by Geography

For more insights on the market share of various regions Request PDF Sample now!

Europe is estimated to contribute 31% to the growth of the global market during the forecast period. Another region offering significant growth opportunities to companies is APAC. Technavio’s analysts have elaborately explained the regional trends and drivers that shape the market during the forecast period.

In APAC, flowers are used for traditional and cultural purposes. Rapid industrialization has resulted in an increase in the number of companies in the region. This, in turn, increased the use of flowers as part of corporate events, regular floral installations across corporate offices, and recreational activities. China, Japan, and India are the major leading producers and contributors to the growth of the market in the region. 

In China, prominent provinces that import flowers include Beijing, Shanghai, Guangdong, Zhejiang, and Yunnan. The different types of flowering plants imported into these provinces include potted plants, fresh-cut flowers, seedlings, cut leaves and branches, and flower bulbs. These flowering plants are imported from countries such as Japan, Chile, Vietnam, and New Zealand, among others. These factors indicate that the demand for potted flowering plants is on the rise in China. Furthermore, in India, flowers are used in multiple festivals, especially religious festivals and special occasions, such as Diwali, weddings, and others. However, most of the demand for flowers is fulfilled by local markets that sell fresh flowers directly to customers. Therefore, such factors will boost regional growth during the forecast period, including in the Vietnam floriculture market

Market Dynamics and Customer Landscape

The market is flourishing with the cultivation of various plants and flowers, catering to both aesthetic and commercial purposes. With a focus on horticulture and floriculture, this industry nurtures a wide array of floral crops, including cut flowers, potted plants, and ornamental foliage, delighting consumers worldwide. From personalization to customization, the market offers diverse options, supported by direct-to-consumer sales models and technological advancements. Institutions and events, including hotels, resorts, and spas, contribute significantly to the market's growth, along with greenhouses fostering year-round production. With an emphasis on beautification and commercial exchange, floriculture embraces a broad spectrum of species, from chestnut and plum to lavender and woody ornamentals, enticing consumers and basket weavers alike. Our researchers analyzed the data with 2023 as the base year, along with the key drivers, trends, and challenges. A holistic analysis of drivers will help companies refine their marketing strategies to gain a competitive advantage.

Key Market Driver

The growing prominence of online shopping is notably driving the market growth. The online distribution channel, also known as e-commerce, has been significantly fueling the growth of the global market over the last decade. The significant increase in the number of e-commerce companies across the world is fueled by the increased global penetration of smartphones. Brand-owned online formats and pure-play e-retailers are among the various types of e-commerce portals that offer personalized gifts. 

Furthermore, e-commerce platforms offer personalized shopping assistance along with suggestions on different types of flowers and floral gifts to customers based on aspects such as the type and color of the flowers desired and the type of gifts. companies not only allow customers to compare and collect information about similar types of floral gifts from various florists but also offer them a platform to provide valuable feedback on such purchases through reviews and ratings. The online distribution channel also allows companies to offer considerable discounts on personalized floral gifts directly to customers, as it eliminates the costs associated with the operation of physical stores and the physical merchandising of these perishables. Therefore, these factors will drive the market growth during the forecast period.

Significant Market Trends

The increasing use of biotechnology in floriculture is an emerging trend in the market. In floriculture, biotechnology is being used to change the color of flowers from their naturally occurring colors. This can increase the demand for uniquely colored flowers, such as blue roses. Furthermore, it can also help flowers to survive in extreme climatic conditions, thus reducing the risks for growers. 

For instance, Monsanto is working on anti-aging technology for flowers. This technology can help prevent flowers from wilting and can help them to last longer. Thus, the use of biotechnology to prevent flowers from wilting can reduce the dependence of exporters on air freight, which is expensive, and instead allow flowers to be transported using a cheaper mode of transport like seaways. Such factors are expected to fuel the growth of the market during the market forecast period.

Major Market Challenge

The over-dependence on climatic conditions is a major challenge impeding the market growth. This industry is highly dependent on the prevailing climatic conditions. Shorter and wetter days and the lack of sunlight can interfere with the healthy growth of certain kinds of ornamental plants. Many nurseries and growers need to use artificial illumination and temperature controls to provide plants the optimum growth conditions. In addition to this, very low temperatures and the accumulation of ice on the leaves of flowering plants can also cause damage to them.

The adverse impact of global climate change can be seen in leading flower-producing countries, such as Kenya, which accounts for around 40% of cut flower imports into the EU. The country has been affected by below-average rainfall over the past several years. In addition to this, the limited supply of freshwater and drought-like conditions further threaten flower production in the country and, thereby, the supply chain in the industry. Such factors are expected to hamper the growth of the market during the market research and growth period.

Customer Landscape

The report includes the adoption lifecycle of the market, covering from the innovator’s stage to the laggard’s stage. It focuses on adoption rates in different regions based on penetration. Furthermore, the report also includes key purchase criteria and drivers of price sensitivity to help companies evaluate and develop their growth strategies.

Floriculture Market Share by Geography

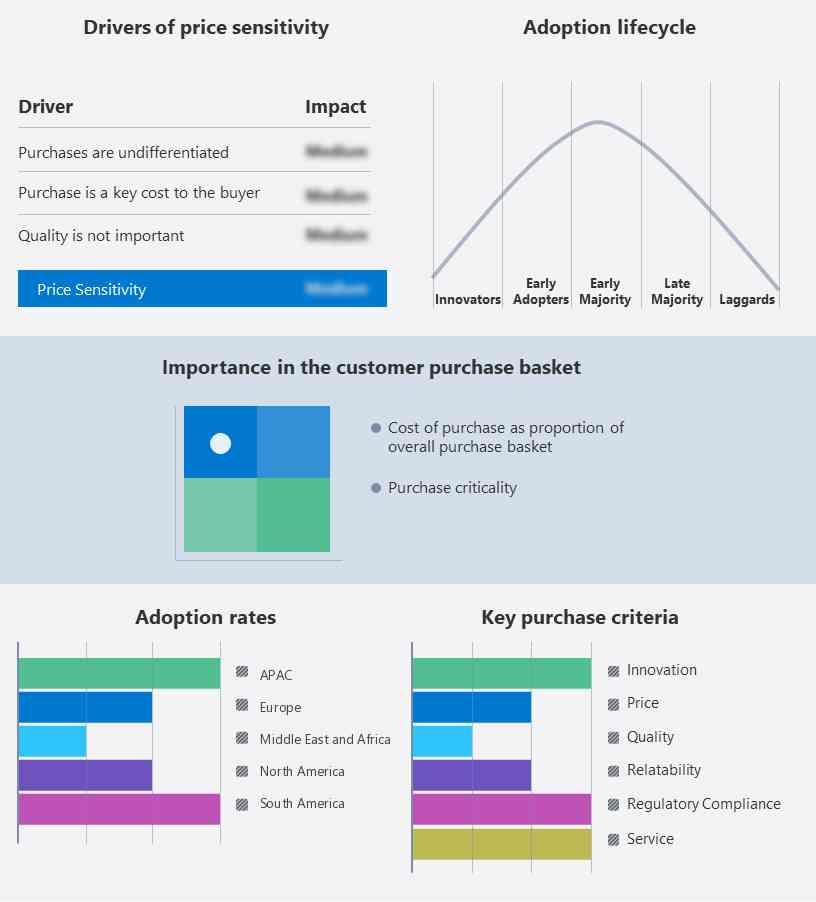
Global Floriculture Market Customer Landscape

Who are the Major Market Companies?

Companies are implementing various strategies, such as strategic alliances, partnerships, mergers and acquisitions, geographical expansion, and product/service launches, to enhance their presence in the market.

Arcangeli Giovanni e Figlio SAS - The company focuses on producing plants, trees, shrubs, and flowers. The key offerings of the company include solutions for floriculture. 

The report also includes detailed analyses of the competitive landscape of the market and information about 15 market companies, including:

  • Afriflora
  • Ball Horticultural Co.
  • Beekenkamp Verpakkingen B.V
  • Coletta and Tyson Ltd.
  • Danziger Group
  • Dummen Orange
  • Farplants Sales Ltd.
  • Flamingo Horticulture Investments
  • Florensis Flower Seeds UK Ltd.
  • Karen Roses
  • Kurt Weiss Greenhouses Inc.
  • Marginpar BV
  •  NurseryLive
  • Rift Valley Roses
  • Selecta Klemm GmbH and Co. KG

Qualitative and quantitative analysis of companies has been conducted to help clients understand the wider business environment as well as the strengths and weaknesses of key market players. Data is qualitatively analyzed to categorize companies as pure play, category-focused, industry-focused, and diversified; it is quantitatively analyzed to categorize companies as dominant, leading, strong, tentative, and weak.

Segment Overview

The market report provides comprehensive data (region wise segment analysis), with forecasts and estimates in "USD Billion" for the period 2024 to 2028, as well as historical data from 2018 to 2022 for the following segments

  • Product Outlook 
    • Cut flowers
    • Bedding plants
    • Potted plants
    • Others
  • Application Outlook
    • Conferences and activities
    • Gifts
    • Personal and corporate use
  • Region Outlook 
    • North America
      • The U.S.
      • Canada
    • Europe
      • The U.K.
      • Germany
      • France
      • Rest of Europe
    • APAC
      • China
      • India
    • Middle East & Africa
      • Saudi Arabia
      • South Africa
      • Rest of the Middle East & Africa
    • South America
      • Chile
      • Brazil
      • Argentina

You may also be interested in:

Market Analyst Overview

The market encompasses a wide array of activities related to the cultivation and trade of flowers and ornamental plants. From floral crops to woody ornamentals, these products offer an aesthetic delight and are widely sought after for both personal and commercial purposes. Through direct-to-consumer sales models, consumers can now access a diverse range of flowers, allowing for greater personalization in floral arrangements. Additionally, the institutions/events segment, including hotels, resorts, and spas, relies on floriculture for enhancing ambiance and customer experience. Traditional favorites like chestnut, plum, and maple are complemented by newer trends like lavender and willow shoots, catering to diverse consumer preferences and the needs of basket weavers worldwide.

The market thrives on commercial exchange of ornamental products cultivated in both open fields and modern greenhouse automation facilities. Technological advancements have revolutionized the industry, enabling practices such as genetically engineered flowers to meet consumer demands. Efficient supply chain logistics and the rise of online flower sales platforms further streamline distribution channels. Flowers play a pivotal role in various celebrations, but challenges like environmental factors and pest and disease management persist.

Mitigating production costs and transportation costs while prioritizing sustainability and eco-friendly practices remain key objectives for stakeholders committed to the longevity and viability of the floriculture sector. In the realm of horticulture, the allure of ornamental foliage extends to unique specimens like bonsai plants and versatile bamboo varieties. This market isn't limited to large-scale producers; it also empowers tiny and marginal farmers to contribute. However, effective distribution requires meticulous logistics coordination and access to information availability regarding consumer preferences. To preserve freshness, adherence to cold chain protocols throughout transportation is paramount. 

Industry  Scope

Report Coverage

Details

Page number

168

Base year

2023

Historic period

2018 - 2022

Forecast period

2024-2028

Growth momentum & CAGR

Accelerate at a CAGR of 10.43%

Market growth 2024-2028

USD 61.1 billion

Market structure

Fragmented

YoY growth 2023-2024(%)

8.62

Regional analysis

APAC, Europe, North America, South America, and Middle East and Africa

Performing market contribution

North America at 31%

Key countries

US, China, UK, Germany, and Japan

Competitive landscape

Leading Companies, Market Positioning of Companies, Competitive Strategies, and Industry Risks

Key companies profiled

Afriflora, Arcangeli Giovanni e Figlio SAS, Ball Horticultural Co., Beekenkamp Verpakkingen B.V, Coletta and Tyson Ltd., Danziger Group, Dummen Orange, Farplants Sales Ltd., Flamingo Horticulture investments, Florensis Flower Seeds UK Ltd., Karen Roses, Kurt Weiss Greenhouses Inc., Marginpar BV,  NurseryLive, Rift Valley Roses, Selecta Klemm GmbH and Co. KG, Syngenta Crop Protection AG, Timaflor B.V., Verbeek and Bol, and Verbeek Export BV

Market dynamics

Parent market analysis, Market growth inducers and obstacles, Fast-growing and slow-growing segment analysis, Market growth and Forecasting, COVID 19 impact and recovery analysis and future consumer dynamics, Market condition analysis for forecast period

Customization purview

If our report has not included the data that you are looking for, you can reach out to our analysts and get segments customized.

Request PDF sample

What are the Key Data Covered in this Market Research Report?

  • CAGR of the market during the forecast period
  • Detailed information on factors that will drive the market growth and forecasting between 2024 and 2028
  • Precise estimation of the market size and its contribution to the parent market
  • Accurate predictions about upcoming trends and changes in consumer behavior
  • Market growth analysis across APAC, Europe, North America, South America, and Middle East and Africa
  • A thorough analysis of the market’s competitive landscape and detailed information about companies
  • Market forecasting of factors that will challenge the growth of the key market companies

We can help! Our analysts can customize this report to meet your requirements. Get in touch

1 Executive Summary

  • 1.1 Market overview
    • Executive Summary - Chart on Market Overview
    • Executive Summary - Data Table on Market Overview
    • Executive Summary - Chart on Global Market Characteristics
    • Executive Summary - Chart on Market by Geography
    • Executive Summary - Chart on Market Segmentation by Application
    • Executive Summary - Chart on Market Segmentation by Product
    • Executive Summary - Chart on Incremental Growth
    • Executive Summary - Data Table on Incremental Growth
    • Executive Summary - Chart on Company Market Positioning

2 Market Landscape

  • 2.1 Market ecosystem
    • Parent Market
    • Data Table on - Parent Market
  • 2.2 Market characteristics
    • Market characteristics analysis
  • 2.3 Value chain analysis
    • Value Chain Analysis

3 Market Sizing

  • 3.1 Market definition
    • Offerings of companies included in the market definition
  • 3.2 Market segment analysis
    • Market segments
  • 3.3 Market size 2023
    • 3.4 Market outlook: Forecast for 2023-2028
      • Chart on Global - Market size and forecast 2023-2028 ($ billion)
      • Data Table on Global - Market size and forecast 2023-2028 ($ billion)
      • Chart on Global Market: Year-over-year growth 2023-2028 (%)
      • Data Table on Global Market: Year-over-year growth 2023-2028 (%)

    4 Historic Market Size

    • 4.1 Global Floriculture Market 2018 - 2022
      • Historic Market Size - Data Table on Global Floriculture Market 2018 - 2022 ($ billion)
    • 4.2 Application segment analysis 2018 - 2022
      • Historic Market Size - Application Segment 2018 - 2022 ($ billion)
    • 4.3 Product segment analysis 2018 - 2022
      • Historic Market Size - Product Segment 2018 - 2022 ($ billion)
    • 4.4 Geography segment analysis 2018 - 2022
      • Historic Market Size - Geography Segment 2018 - 2022 ($ billion)
    • 4.5 Country segment analysis 2018 - 2022
      • Historic Market Size - Country Segment 2018 - 2022 ($ billion)

    5 Five Forces Analysis

    • 5.1 Five forces summary
      • Five forces analysis - Comparison between 2023 and 2028
    • 5.2 Bargaining power of buyers
      • Bargaining power of buyers - Impact of key factors 2023 and 2028
    • 5.3 Bargaining power of suppliers
      • Bargaining power of suppliers - Impact of key factors in 2023 and 2028
    • 5.4 Threat of new entrants
      • Threat of new entrants - Impact of key factors in 2023 and 2028
    • 5.5 Threat of substitutes
      • Threat of substitutes - Impact of key factors in 2023 and 2028
    • 5.6 Threat of rivalry
      • Threat of rivalry - Impact of key factors in 2023 and 2028
    • 5.7 Market condition
      • Chart on Market condition - Five forces 2023 and 2028

    6 Market Segmentation by Application

    • 6.1 Market segments
      • Chart on Application - Market share 2023-2028 (%)
      • Data Table on Application - Market share 2023-2028 (%)
    • 6.2 Comparison by Application
      • Chart on Comparison by Application
      • Data Table on Comparison by Application
    • 6.3 Conferences and activities - Market size and forecast 2023-2028
      • Chart on Conferences and activities - Market size and forecast 2023-2028 ($ billion)
      • Data Table on Conferences and activities - Market size and forecast 2023-2028 ($ billion)
      • Chart on Conferences and activities - Year-over-year growth 2023-2028 (%)
      • Data Table on Conferences and activities - Year-over-year growth 2023-2028 (%)
    • 6.4 Gifts - Market size and forecast 2023-2028
      • Chart on Gifts - Market size and forecast 2023-2028 ($ billion)
      • Data Table on Gifts - Market size and forecast 2023-2028 ($ billion)
      • Chart on Gifts - Year-over-year growth 2023-2028 (%)
      • Data Table on Gifts - Year-over-year growth 2023-2028 (%)
    • 6.5 Personal and corporate use - Market size and forecast 2023-2028
      • Chart on Personal and corporate use - Market size and forecast 2023-2028 ($ billion)
      • Data Table on Personal and corporate use - Market size and forecast 2023-2028 ($ billion)
      • Chart on Personal and corporate use - Year-over-year growth 2023-2028 (%)
      • Data Table on Personal and corporate use - Year-over-year growth 2023-2028 (%)
    • 6.6 Market opportunity by Application
      • Market opportunity by Application ($ billion)
      • Data Table on Market opportunity by Application ($ billion)

    7 Market Segmentation by Product

    • 7.1 Market segments
      • Chart on Product - Market share 2023-2028 (%)
      • Data Table on Product - Market share 2023-2028 (%)
    • 7.2 Comparison by Product
      • Chart on Comparison by Product
      • Data Table on Comparison by Product
    • 7.3 Cut flowers - Market size and forecast 2023-2028
      • Chart on Cut flowers - Market size and forecast 2023-2028 ($ billion)
      • Data Table on Cut flowers - Market size and forecast 2023-2028 ($ billion)
      • Chart on Cut flowers - Year-over-year growth 2023-2028 (%)
      • Data Table on Cut flowers - Year-over-year growth 2023-2028 (%)
    • 7.4 Bedding plants - Market size and forecast 2023-2028
      • Chart on Bedding plants - Market size and forecast 2023-2028 ($ billion)
      • Data Table on Bedding plants - Market size and forecast 2023-2028 ($ billion)
      • Chart on Bedding plants - Year-over-year growth 2023-2028 (%)
      • Data Table on Bedding plants - Year-over-year growth 2023-2028 (%)
    • 7.5 Potted plants - Market size and forecast 2023-2028
      • Chart on Potted plants - Market size and forecast 2023-2028 ($ billion)
      • Data Table on Potted plants - Market size and forecast 2023-2028 ($ billion)
      • Chart on Potted plants - Year-over-year growth 2023-2028 (%)
      • Data Table on Potted plants - Year-over-year growth 2023-2028 (%)
    • 7.6 Others - Market size and forecast 2023-2028
      • Chart on Others - Market size and forecast 2023-2028 ($ billion)
      • Data Table on Others - Market size and forecast 2023-2028 ($ billion)
      • Chart on Others - Year-over-year growth 2023-2028 (%)
      • Data Table on Others - Year-over-year growth 2023-2028 (%)
    • 7.7 Market opportunity by Product
      • Market opportunity by Product ($ billion)
      • Data Table on Market opportunity by Product ($ billion)

    8 Customer Landscape

    • 8.1 Customer landscape overview
      • Analysis of price sensitivity, lifecycle, customer purchase basket, adoption rates, and purchase criteria

    9 Geographic Landscape

    • 9.1 Geographic segmentation
      • Chart on Market share by geography 2023-2028 (%)
      • Data Table on Market share by geography 2023-2028 (%)
    • 9.2 Geographic comparison
      • Chart on Geographic comparison
      • Data Table on Geographic comparison
    • 9.3 APAC - Market size and forecast 2023-2028
      • Chart on APAC - Market size and forecast 2023-2028 ($ billion)
      • Data Table on APAC - Market size and forecast 2023-2028 ($ billion)
      • Chart on APAC - Year-over-year growth 2023-2028 (%)
      • Data Table on APAC - Year-over-year growth 2023-2028 (%)
    • 9.4 Europe - Market size and forecast 2023-2028
      • Chart on Europe - Market size and forecast 2023-2028 ($ billion)
      • Data Table on Europe - Market size and forecast 2023-2028 ($ billion)
      • Chart on Europe - Year-over-year growth 2023-2028 (%)
      • Data Table on Europe - Year-over-year growth 2023-2028 (%)
    • 9.5 North America - Market size and forecast 2023-2028
      • Chart on North America - Market size and forecast 2023-2028 ($ billion)
      • Data Table on North America - Market size and forecast 2023-2028 ($ billion)
      • Chart on North America - Year-over-year growth 2023-2028 (%)
      • Data Table on North America - Year-over-year growth 2023-2028 (%)
    • 9.6 South America - Market size and forecast 2023-2028
      • Chart on South America - Market size and forecast 2023-2028 ($ billion)
      • Data Table on South America - Market size and forecast 2023-2028 ($ billion)
      • Chart on South America - Year-over-year growth 2023-2028 (%)
      • Data Table on South America - Year-over-year growth 2023-2028 (%)
    • 9.7 Middle East and Africa - Market size and forecast 2023-2028
      • Chart on Middle East and Africa - Market size and forecast 2023-2028 ($ billion)
      • Data Table on Middle East and Africa - Market size and forecast 2023-2028 ($ billion)
      • Chart on Middle East and Africa - Year-over-year growth 2023-2028 (%)
      • Data Table on Middle East and Africa - Year-over-year growth 2023-2028 (%)
    • 9.8 US - Market size and forecast 2023-2028
      • Chart on US - Market size and forecast 2023-2028 ($ billion)
      • Data Table on US - Market size and forecast 2023-2028 ($ billion)
      • Chart on US - Year-over-year growth 2023-2028 (%)
      • Data Table on US - Year-over-year growth 2023-2028 (%)
    • 9.9 China - Market size and forecast 2023-2028
      • Chart on China - Market size and forecast 2023-2028 ($ billion)
      • Data Table on China - Market size and forecast 2023-2028 ($ billion)
      • Chart on China - Year-over-year growth 2023-2028 (%)
      • Data Table on China - Year-over-year growth 2023-2028 (%)
    • 9.10 UK - Market size and forecast 2023-2028
      • Chart on UK - Market size and forecast 2023-2028 ($ billion)
      • Data Table on UK - Market size and forecast 2023-2028 ($ billion)
      • Chart on UK - Year-over-year growth 2023-2028 (%)
      • Data Table on UK - Year-over-year growth 2023-2028 (%)
    • 9.11 Germany - Market size and forecast 2023-2028
      • Chart on Germany - Market size and forecast 2023-2028 ($ billion)
      • Data Table on Germany - Market size and forecast 2023-2028 ($ billion)
      • Chart on Germany - Year-over-year growth 2023-2028 (%)
      • Data Table on Germany - Year-over-year growth 2023-2028 (%)
    • 9.12 Japan - Market size and forecast 2023-2028
      • Chart on Japan - Market size and forecast 2023-2028 ($ billion)
      • Data Table on Japan - Market size and forecast 2023-2028 ($ billion)
      • Chart on Japan - Year-over-year growth 2023-2028 (%)
      • Data Table on Japan - Year-over-year growth 2023-2028 (%)
    • 9.13 Market opportunity by geography
      • Market opportunity by geography ($ billion)
      • Data Tables on Market opportunity by geography ($ billion)

    10 Drivers, Challenges, and Opportunity/Restraints

    • 10.1 Market drivers
      • 10.2 Market challenges
        • 10.3 Impact of drivers and challenges
          • Impact of drivers and challenges in 2023 and 2028
        • 10.4 Market opportunities/restraints

          11 Competitive Landscape

          • 11.1 Overview
            • 11.2 Competitive Landscape
              • Overview on criticality of inputs and factors of differentiation
            • 11.3 Landscape disruption
              • Overview on factors of disruption
            • 11.4 Industry risks
              • Impact of key risks on business

            12 Competitive Analysis

            • 12.1 Companies profiled
              • Companies covered
            • 12.2 Market positioning of companies
              • Matrix on companies position and classification
            • 12.3 Arcangeli Giovanni e Figlio SAS
              • Arcangeli Giovanni e Figlio SAS - Overview
              • Arcangeli Giovanni e Figlio SAS - Product / Service
              • Arcangeli Giovanni e Figlio SAS - Key offerings
            • 12.4 Ball Horticultural Co.
              • Ball Horticultural Co. - Overview
              • Ball Horticultural Co. - Product / Service
              • Ball Horticultural Co. - Key offerings
            • 12.5 Beekenkamp Verpakkingen B.V
              • Beekenkamp Verpakkingen B.V - Overview
              • Beekenkamp Verpakkingen B.V - Product / Service
              • Beekenkamp Verpakkingen B.V - Key offerings
            • 12.6 Danziger Group
              • Danziger Group - Overview
              • Danziger Group - Product / Service
              • Danziger Group - Key offerings
            • 12.7 Dummen Orange
              • Dummen Orange - Overview
              • Dummen Orange - Product / Service
              • Dummen Orange - Key offerings
            • 12.8 Flamingo Horticulture investments
              • Flamingo Horticulture investments - Overview
              • Flamingo Horticulture investments - Product / Service
              • Flamingo Horticulture investments - Key offerings
            • 12.9 Florensis Flower Seeds UK Ltd.
              • Florensis Flower Seeds UK Ltd. - Overview
              • Florensis Flower Seeds UK Ltd. - Product / Service
              • Florensis Flower Seeds UK Ltd. - Key offerings
            • 12.10 Karen Roses
              • Karen Roses - Overview
              • Karen Roses - Product / Service
              • Karen Roses - Key offerings
            • 12.11 Kurt Weiss Greenhouses Inc.
              • Kurt Weiss Greenhouses Inc. - Overview
              • Kurt Weiss Greenhouses Inc. - Product / Service
              • Kurt Weiss Greenhouses Inc. - Key offerings
            • 12.12 Marginpar BV
              • Marginpar BV - Overview
              • Marginpar BV - Product / Service
              • Marginpar BV - Key offerings
            • 12.13 NurseryLive
              • NurseryLive - Overview
              • NurseryLive - Product / Service
              • NurseryLive - Key offerings
            • 12.14 Rift Valley Roses
              • Rift Valley Roses - Overview
              • Rift Valley Roses - Product / Service
              • Rift Valley Roses - Key offerings
            • 12.15 Selecta Klemm GmbH and Co. KG
              • Selecta Klemm GmbH and Co. KG - Overview
              • Selecta Klemm GmbH and Co. KG - Product / Service
              • Selecta Klemm GmbH and Co. KG - Key offerings
            • 12.16 Syngenta Crop Protection AG
              • Syngenta Crop Protection AG - Overview
              • Syngenta Crop Protection AG - Product / Service
              • Syngenta Crop Protection AG - Key news
              • Syngenta Crop Protection AG - Key offerings
            • 12.17 Timaflor B.V.
              • Timaflor B.V. - Overview
              • Timaflor B.V. - Product / Service
              • Timaflor B.V. - Key offerings

            13 Appendix

            • 13.1 Scope of the report
              • 13.2 Inclusions and exclusions checklist
                • Inclusions checklist
                • Exclusions checklist
              • 13.3 Currency conversion rates for US$
                • Currency conversion rates for US$
              • 13.4 Research methodology
                • Research methodology
              • 13.5 Data procurement
                • Information sources
              • 13.6 Data validation
                • Data validation
              • 13.7 Validation techniques employed for market sizing
                • Validation techniques employed for market sizing
              • 13.8 Data synthesis
                • Data synthesis
              • 13.9 360 degree market analysis
                • 360 degree market analysis
              • 13.10 List of abbreviations
                • List of abbreviations

              Research Methodology

              Technavio presents a detailed picture of the market by way of study, synthesis, and summation of data from multiple sources. The analysts have presented the various facets of the market with a particular focus on identifying the key industry influencers. The data thus presented is comprehensive, reliable, and the result of extensive research, both primary and secondary.

              INFORMATION SOURCES

              Primary sources

              • Manufacturers and suppliers
              • Channel partners
              • Industry experts
              • Strategic decision makers

              Secondary sources

              • Industry journals and periodicals
              • Government data
              • Financial reports of key industry players
              • Historical data
              • Press releases

              DATA ANALYSIS

              Data Synthesis

              • Collation of data
              • Estimation of key figures
              • Analysis of derived insights

              Data Validation

              • Triangulation with data models
              • Reference against proprietary databases
              • Corroboration with industry experts

              REPORT WRITING

              Qualitative

              • Market drivers
              • Market challenges
              • Market trends
              • Five forces analysis

              Quantitative

              • Market size and forecast
              • Market segmentation
              • Geographical insights
              • Competitive landscape

              Interested in this report?

              Get your sample now to see our research methodology and insights!

              Download Now

              Frequently Asked Questions

              Floriculture market growth will increase by $ 61.1 bn during 2024-2028.

              The Floriculture market is expected to grow at a CAGR of 10.43% during 2024-2028.

              Floriculture market is segmented by Application( Conferences and activities, Gifts, Personal and corporate use, Others) Product( Cut flowers, Bedding plants, Potted plants, Others, MEA)

              Afriflora, Arcangeli Giovanni e Figlio SAS, Ball Horticultural Co., Beekenkamp Verpakkingen B.V, Coletta and Tyson Ltd., Danziger Group, Dummen Orange, Farplants Sales Ltd., Flamingo Horticulture investments, Florensis Flower Seeds UK Ltd., Karen Roses, Kurt Weiss Greenhouses Inc., Marginpar BV,  NurseryLive, Rift Valley Roses, Selecta Klemm GmbH and Co. KG, Syngenta Crop Protection AG, Timaflor B.V., Verbeek and Bol, Verbeek Export BV are a few of the key vendors in the Floriculture market.

              North America will register the highest growth rate of 31% among the other regions. Therefore, the Floriculture market in North America is expected to garner significant business opportunities for the vendors during the forecast period.

              US, China, UK, Germany, Japan

              • High profits associated with growing ornamental plantsOne of the major factors driving the ornamental plant market is the increasing cultivation of flowers and plants for sale. This is attributed to the high-profit margins associated with the sale of outdoor ornamental plants and flowers. According to several research studies conducted in the Konya province in Turkey is the driving factor this market.
              • the annual average gross profits for coniferous outdoor ornamental plants were $530 for pine is the driving factor this market.
              • $730 for cedar is the driving factor this market.
              • and $920 for blue spruce. The gross profit margins for these plants are around 55% is the driving factor this market.
              • 65% is the driving factor this market.
              • and 72% is the driving factor this market.
              • respectively. Similarly is the driving factor this market.
              • other ornamental plants also had substantial gross margins - chestnut with 78% is the driving factor this market.
              • plum with 84% is the driving factor this market.
              • and maple with 65%. These high margins have allowed many players to increase their offerings in this space. Growers are able to harvest 4-5 tons of willow shoots per acre is the driving factor this market.
              • which earns $56 is the driving factor this market.
              • 000 per acre at $7 an lb. from basket weavers. In addition to this is the driving factor this market.
              • plants such as lavender is the driving factor this market.
              • woody ornamentals is the driving factor this market.
              • bonsai plants is the driving factor this market.
              • and bamboo have been highly profitable for growers. Bamboo is the driving factor this market.
              • one of the most widely used plants for landscaping is the driving factor this market.
              • which ranges from Dwarf Sasa bamboo to giant timber bamboo is the driving factor this market.
              • has also been found to be very profitable. For instance is the driving factor this market.
              • over 600 bamboo plants can be grown in five-gallon pots in a 30 x 40-inch space. A container of landscaping bamboo fetches an average price of around $45. Such factors are expected to propel the growth of the market during the forecast period. is the driving factor this market.

              The Floriculture market vendors should focus on grabbing business opportunities from the Conferences and activities segment as it accounted for the largest market share in the base year.