
Flower And Ornamental Plants Market Analysis, Size, and Forecast 2026-2030: APAC (China, Japan, and India), Europe (Germany, UK, and France), North America (US, Canada, and Mexico), South America (Brazil, Argentina, and Chile), Middle East and Africa (Saudi Arabia, UAE, and South Africa), and Rest of World (ROW)

Flower And Ornamental Plants Market Analysis, Size, and Forecast 2026-2030:
APAC (China, Japan, and India), Europe (Germany, UK, and France), North America (US, Canada, and Mexico), South America (Brazil, Argentina, and Chile), Middle East and Africa (Saudi Arabia, UAE, and South Africa), and Rest of World (ROW)

Published: Oct 2026 286 Pages SKU: IRTNTR43042

Market Overview at a Glance

$43.83 B
Market Opportunity
6.9%
CAGR 2025 - 2030
44.9%
APAC Growth
$65.10 B
Cut flowers segment 2024

Flower And Ornamental Plants Market Size 2026-2030

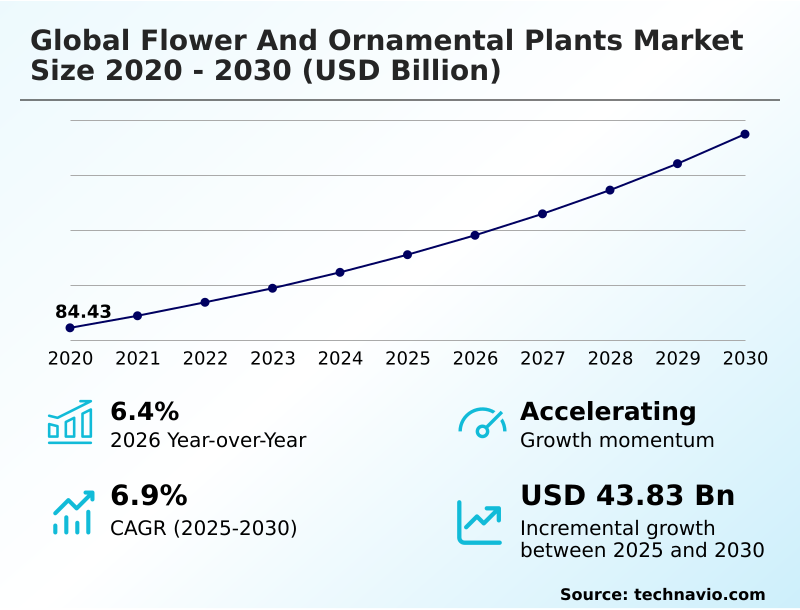
The flower and ornamental plants market size is valued to increase by USD 43.83 billion, at a CAGR of 6.9% from 2025 to 2030. Proliferation of urban greenery and biophilic interior design will drive the flower and ornamental plants market.

Major Market Trends & Insights

  • APAC dominated the market and accounted for a 44.9% growth during the forecast period.
  • By Product - Cut flowers segment was valued at USD 65.10 billion in 2024
  • By End-user - Commercial segment accounted for the largest market revenue share in 2024

Market Size & Forecast

  • Market Opportunities: USD 70.43 billion
  • Market Future Opportunities: USD 43.83 billion
  • CAGR from 2025 to 2030 : 6.9%

Market Summary

  • The Flower And Ornamental Plants ecosystem is undergoing a structural evolution driven by a global shift toward nature-centric living and sustainable interior architecture. Cultivators are actively transitioning from traditional open-field farming to precision-controlled indoor environments to meet continuous year-round demand.
  • Commercial nurseries implementing smart irrigation and automated climate tracking have achieved a 20% reduction in water consumption while simultaneously improving crop yield consistency. The proliferation of urban greenery and biophilic interior design acts as a massive demand catalyst, embedding living plants into standard corporate infrastructure and residential wellness programs.
  • Conversely, the fragility of international cold chain logistics represents a severe operational bottleneck, where transit delays frequently result in devastating inventory spoilage. To adapt, stakeholders are decentralizing distribution networks and adopting eco-friendly packaging materials.
  • This strategic realignment ensures that producers can mitigate climatic risks, adhere to stringent environmental regulations, and deliver premium botanical products to an increasingly discerning global consumer base.

What will be the Size of the Flower And Ornamental Plants Market during the forecast period?
Get Key Insights on Market Forecast (PDF) Get Free Sample

How is the Flower And Ornamental Plants Market Segmented?

The flower and ornamental plants industry research report provides comprehensive data (region-wise segment analysis), with forecasts and estimates in "USD million" for the period 2026-2030, as well as historical data from 2020-2024 for the following segments.

  • Product
    • Cut flowers
    • Potted plants
  • End-user
    • Commercial
    • Residential
  • Distribution channel
    • Offline
    • Online
  • Geography
    • APAC
      • China
      • Japan
      • India
      • Australia
      • South Korea
      • Indonesia
    • Europe
      • Germany
      • UK
      • France
      • The Netherlands
      • Italy
      • Spain
    • North America
      • US
      • Canada
      • Mexico
    • South America
      • Brazil
      • Argentina
      • Chile
    • Middle East and Africa
      • Saudi Arabia
      • UAE
      • South Africa
      • Turkey
      • Israel

By Product Insights

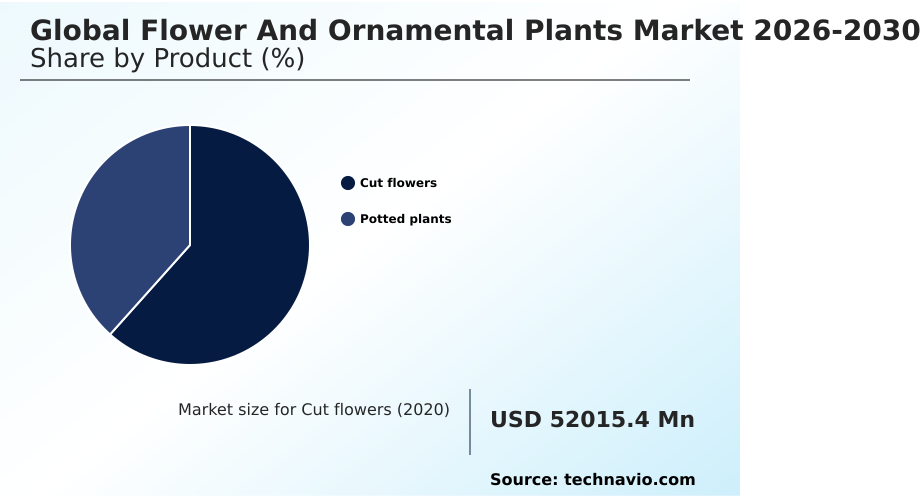
The cut flowers segment is estimated to witness significant growth during the forecast period.

The Cut flowers segment undergoes continuous transformation driven by advancements in hydroponic cultivation systems and precision floriculture techniques. Commercial growers optimize stem quality by deploying biological crop protection, ensuring blooms meet rigorous international standards.

Efficient supply chains rely heavily on robust cold chain infrastructure and temperature controlled transit to minimize perishable losses during global distribution. By utilizing automated sorting machinery, facilities have increased grading efficiency by 22%, significantly accelerating processing timelines.

Operations focus heavily on seasonal yield optimization to align harvest peaks with holiday demand spikes while simultaneously addressing end-user preferences for indoor air filtration aesthetics.

These structural upgrades enable producers to navigate shifting logistical constraints while maintaining maximum freshness from the initial harvest to final retail delivery.
Get Free Sample

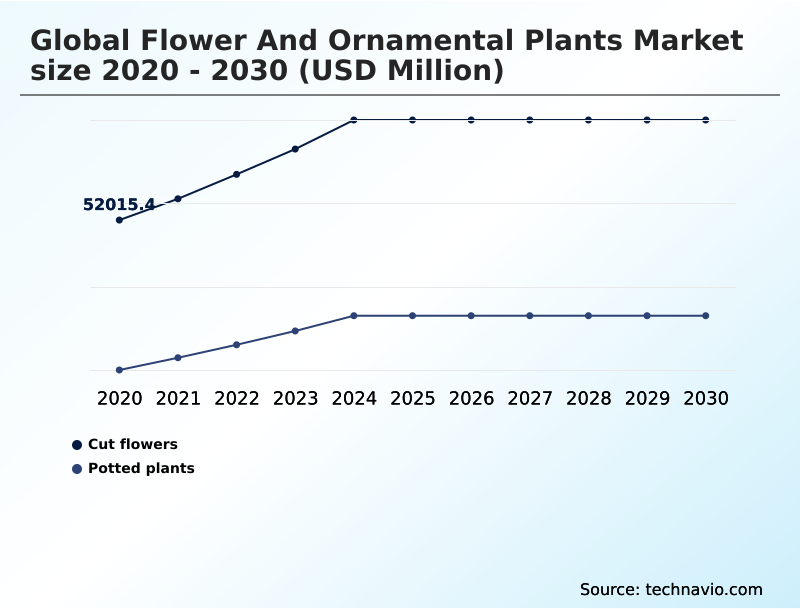
The Cut flowers segment was valued at USD 65.10 billion in 2024 and showed a gradual increase during the forecast period.
Get Free Sample

Regional Analysis

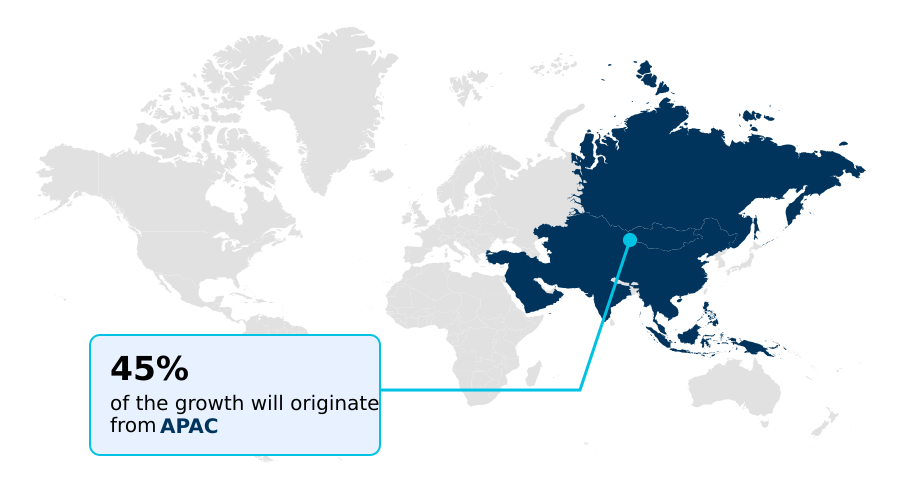
APAC is estimated to contribute 44.9% to the growth of the global market during the forecast period.Technavio’s analysts have elaborately explained the regional trends and drivers that shape the market during the forecast period.
See How Flower And Ornamental Plants Market Demand is Rising in APAC Get Free Sample

The Flower And Ornamental Plants distribution exhibits stark geographical variances, with APAC currently outpacing Europe due to rapid urbanization and large-scale public greening initiatives.

While Europe focuses heavily on strict environmental compliance through organic biostimulants integration and biodegradable packaging solutions, APAC cultivators aggressively scale operations to meet high-volume domestic demand.

European nurseries implementing mycelium nursery containers have lowered their plastic disposal costs by 28%, showcasing a direct operational efficiency gain. Conversely, regions prone to extreme weather prioritize rigorous water conservation protocols and greenhouse energy efficiency to stabilize year-round output.

The broader adoption of biophilic wellness integration in North American commercial real estate drives distinct preferences for durable indoor species over traditional blooms.

Meanwhile, cross-border trade hinges on extending floral shelf life and supporting pollinator friendly vegetation to align with global biodiversity standards.

Market Dynamics

Our researchers analyzed the data with 2025 as the base year, along with the key drivers, trends, and challenges. A holistic analysis of drivers will help companies refine their marketing strategies to gain a competitive advantage.

  • The continuous evolution of the Flower And Ornamental Plants sector is heavily influenced by the escalating demand for sustainable indoor greenery integration across both residential and corporate environments. As urban density increases, architects and facility managers are prioritizing commercial biophilic interior plantscaping to enhance occupant well-being and meet modern environmental building certifications.
  • This structural shift requires commercial growers to produce highly resilient, low-maintenance flora at scale. To achieve this, the industry is rapidly transitioning toward automated climate controlled floriculture systems, which optimize light and nutrient delivery while reducing manual labor dependencies. Facilities utilizing these advanced frameworks have reported a 25% improvement in overall yield consistency compared to traditional open-air operations.
  • Furthermore, the mandatory shift toward ecological compliance is accelerating the peat free growing media transition, compelling nurseries to adopt coconut coir and composted agricultural waste to lower their carbon footprint. Delivering these premium biological assets safely across international borders remains complex, prompting heavy investments in cold chain floral transit optimization.
  • By upgrading last-mile delivery vehicles and enhancing terminal storage capabilities, distributors successfully minimize thermal shock and subsequent inventory spoilage. These integrated operational strategies ensure that producers can navigate stringent regulatory landscapes while seamlessly supplying high-quality botanical products to an expanding, eco-conscious global consumer base.
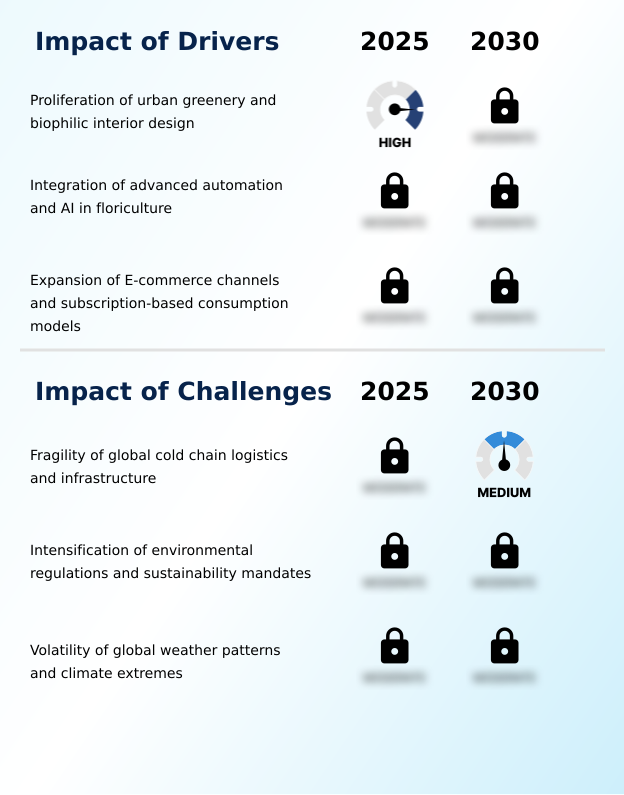
What are the key market drivers leading to the rise in the adoption of Flower And Ornamental Plants Industry?

  • The proliferation of urban greenery and biophilic interior design acts as a primary driver for the market.

  • Rapid expansion of urban greening infrastructure acts as a primary catalyst for the continuous expansion of the Flower And Ornamental Plants sector. Developers prioritize living aesthetics, driving commercial nurseries to scale up production using advanced climate controlled greenhouses.
  • By shifting to sustainable peatland agriculture and integrating precise plant hormone modulation, cultivators enhance root development while complying with stringent environmental mandates. This operational pivot has improved overall crop yield reliability by 18% in high-density production zones.
  • To counter regional climate volatility, producers rapidly adopt tissue culture technology and drought tolerant genetics, creating robust varieties suited for modern indoor environments.
  • Additionally, supply chain decentralization coupled with automated inventory tracking empowers growers to efficiently bypass traditional bottlenecks, ensuring rapid delivery and steady revenue realization across specialized retail networks.

What are the market trends shaping the Flower And Ornamental Plants Industry?

  • The integration of advanced AI for hyper-personalized plant care and curation is an upcoming market trend.

  • The Flower And Ornamental Plants landscape is rapidly evolving through the adoption of advanced generative diagnostic models that offer hyper-personalized botanical care. Facilities are integrating hydroponic moisture sensors to continuously monitor plant health, leading to a 30% reduction in cultivation waste across major commercial nurseries. This digital transition leverages predictive bloom analytics to synchronize supply with exact consumer demand windows.
  • Furthermore, urban developments heavily incorporate biophilic architectural design and therapeutic horticultural spaces, shifting greenery from a luxury to an essential wellness asset. Growers utilizing botanical structural hybridization alongside intelligent botanical identification algorithms ensure higher plant resilience in confined indoor environments. By implementing automated harvesting protocols, the industry effectively neutralizes labor shortages while maintaining stringent quality control across large-scale commercial operations.

What challenges does the Flower And Ornamental Plants Industry face during its growth?

  • The fragility of global cold chain logistics and infrastructure represents a key challenge affecting industry growth.

  • The intricate dependency on seamless global logistics presents profound operational hurdles for the Flower And Ornamental Plants supply chain. Strict cross-border environmental regulations now mandate rigorous carbon traceability metrics and intense phytosanitary compliance monitoring, directly elevating administrative overhead for exporters. Facilities attempting to implement circular cultivation methods face high initial transition costs while redesigning traditional soil nutrient cycling protocols.
  • This regulatory friction often delays customs clearance, increasing the risk of inventory spoilage by up to 15% without robust real time transit tracking. To mitigate biological threats, producers heavily rely on genetic disease resilience and continuous pest infestation prediction, though these require substantial capital investments.
  • Furthermore, the mandatory phase-out of conventional packaging forces a rapid, costly transition toward eco friendly floral foams, straining operational margins for mid-sized cultivators.

Exclusive Technavio Analysis on Customer Landscape

The flower and ornamental plants market forecasting report includes the adoption lifecycle of the market, covering from the innovator’s stage to the laggard’s stage. It focuses on adoption rates in different regions based on penetration. Furthermore, the flower and ornamental plants market report also includes key purchase criteria and drivers of price sensitivity to help companies evaluate and develop their market growth analysis strategies.
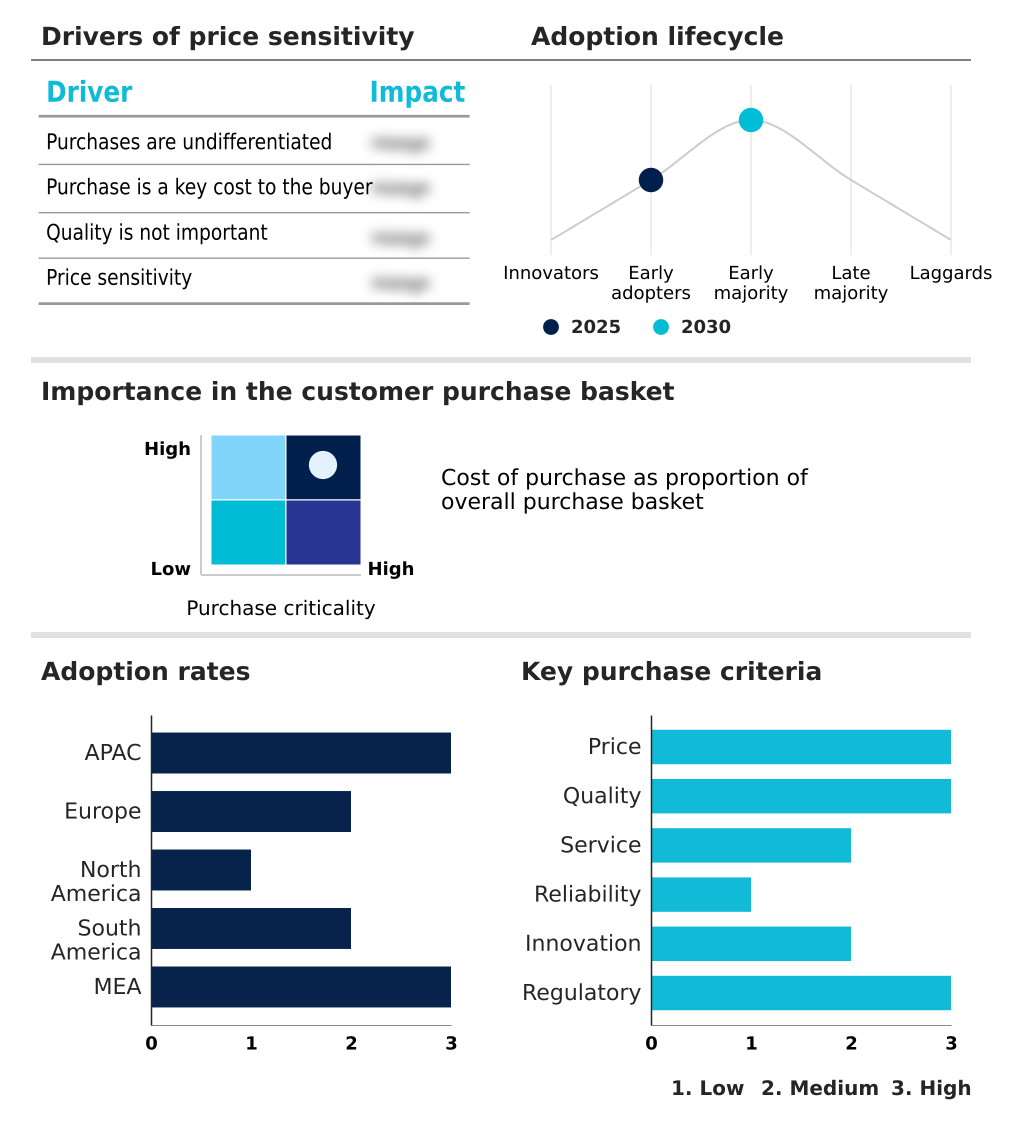
Customer Landscape of Flower And Ornamental Plants Industry

Competitive Landscape

Companies are implementing various strategies, such as strategic alliances, flower and ornamental plants market forecast, partnerships, mergers and acquisitions, geographical expansion, and product/service launches, to enhance their presence in the industry.

Anthura B.V. - Offers premium floral varieties and advanced ornamental genetics optimized for commercial greenhouses and retail distribution.

The industry research and growth report includes detailed analyses of the competitive landscape of the market and information about key companies, including:

  • Anthura B.V.
  • Ball Horticultural Co.
  • Beekenkamp Verpakkingen B.V
  • Danziger Group
  • De Ruiter Seeds
  • Dummen Orange
  • Ernst Benary Samenzucht GmbH
  • Floritec GmbH
  • HilverdaFlorist
  • KP Holland
  • Marginpar BV
  • Oserian Development Co. Ltd.
  • Rosaprima Group
  • Royal Van Zanten
  • Sakata Seed Corp.
  • Schoneveld Breeding
  • Schreurs Holland B.V.
  • Selecta Klemm GmbH and Co. KG
  • Suntory Flowers Ltd
  • Syngenta Flowers

Qualitative and quantitative analysis of companies has been conducted to help clients understand the wider business environment as well as the strengths and weaknesses of key industry players. Data is qualitatively analyzed to categorize companies as pure play, category-focused, industry-focused, and diversified; it is quantitatively analyzed to categorize companies as dominant, leading, strong, tentative, and weak.

Recent Development and News in Flower and ornamental plants market

  • In the Agricultural Products and Services industry, the transition toward smart greenhouse automation has optimized climate controls, directly impacting Flower And Ornamental Plants demand by reducing crop loss by 15%.
  • Strict international phytosanitary trade mandates for agricultural exports have forced nurseries to adopt blockchain-based traceability, ensuring compliance for cross-border Flower And Ornamental Plants shipments.
  • Advancements in agricultural biotechnology and tissue culture propagation have accelerated the development of disease-resistant cultivars, enhancing the supply consistency of exotic Flower And Ornamental Plants.
  • The broader agricultural shift toward sustainable peat-free growing media has altered soil management practices, forcing commercial Flower And Ornamental Plants producers to redesign their root nutrient delivery systems.

Dive into Technavio’s robust research methodology, blending expert interviews, extensive data synthesis, and validated models for unparalleled Flower And Ornamental Plants Market insights. See full methodology.

Market Scope
Page number 286
Base year 2025
Historic period 2020-2024
Forecast period 2026-2030
Growth momentum & CAGR Accelerate at a CAGR of 6.9%
Market growth 2026-2030 USD 43832.6 million
Market structure Fragmented
YoY growth 2025-2026(%) 6.4%
Key countries China, Japan, India, Australia, South Korea, Indonesia, Germany, UK, France, The Netherlands, Italy, Spain, US, Canada, Mexico, Brazil, Argentina, Chile, Saudi Arabia, UAE, South Africa, Turkey and Israel
Competitive landscape Leading Companies, Market Positioning of Companies, Competitive Strategies, and Industry Risks

Request Free Sample

Research Analyst Overview

  • The Flower And Ornamental Plants ecosystem demonstrates robust resilience as operators continuously pivot toward technological automation and sustainable production methodologies. Strategic realignments are evident as major commercial growers integrate predictive artificial intelligence and robotic sorting infrastructure to combat persistent labor shortages and optimize post-harvest grading.
  • This digital transformation directly addresses the escalating complexities of international distribution, allowing facilities to achieve a 30% reduction in processing time and significantly decrease product spoilage rates. Concurrently, the industry is navigating strict environmental mandates by overhauling legacy operational practices.
  • Cultivators are actively eliminating single-use plastics and adopting closed-loop irrigation frameworks, tying the trend of sustainable horticulture directly to boardroom-level compliance and long-term budgetary planning. The strategic shift toward eco-certified botanical varieties not only mitigates regulatory risks but also justifies premium retail pricing structures.
  • As consumer behavior increasingly favors holistic wellness and biophilic design, suppliers prioritizing supply chain transparency and advanced climate-resilient genetics are securing dominant positions within this highly competitive and rapidly evolving biological market.

What are the Key Data Covered in this Flower And Ornamental Plants Market Research and Growth Report?

  • What is the expected growth of the Flower And Ornamental Plants Market between 2026 and 2030?

    • USD 43.83 billion, at a CAGR of 6.9%

  • What segmentation does the market report cover?

    • The report is segmented by Product (Cut flowers, and Potted plants), End-user (Commercial, and Residential), Distribution Channel (Offline, and Online) and Geography (APAC, Europe, North America, South America, Middle East and Africa)

  • Which regions are analyzed in the report?

    • APAC, Europe, North America, South America and Middle East and Africa

  • What are the key growth drivers and market challenges?

    • Proliferation of urban greenery and biophilic interior design, Fragility of global cold chain logistics and infrastructure

  • Who are the major players in the Flower And Ornamental Plants Market?

    • Anthura B.V., Ball Horticultural Co., Beekenkamp Verpakkingen B.V, Danziger Group, De Ruiter Seeds, Dummen Orange, Ernst Benary Samenzucht GmbH, Floritec GmbH, HilverdaFlorist, KP Holland, Marginpar BV, Oserian Development Co. Ltd., Rosaprima Group, Royal Van Zanten, Sakata Seed Corp., Schoneveld Breeding, Schreurs Holland B.V., Selecta Klemm GmbH and Co. KG, Suntory Flowers Ltd and Syngenta Flowers

Market Research Insights

  • The Flower And Ornamental Plants sector is rapidly integrating digital technologies and sustainable practices to reshape traditional horticultural supply chains. Commercial producers are heavily investing in greenhouse energy efficiency to offset rising utility overheads, simultaneously deploying predictive bloom analytics to synchronize harvests with consumer demand.
  • This technological integration has optimized resource utilization, enabling facilities to achieve a 15% reduction in overall operating costs. Furthermore, the rising consumer prioritization of indoor air filtration is shifting retail portfolios toward resilient foliage varieties. To protect these perishable assets during global distribution, logistics providers are upgrading temperature controlled transit networks.
  • Concurrently, the implementation of circular cultivation methods ensures strict compliance with emerging environmental mandates, securing long-term operational viability across major international markets.

We can help! Our analysts can customize this flower and ornamental plants market research report to meet your requirements.

Get in touch

1. Executive Summary

1.1 Market overview

Executive Summary - Chart on Market Overview
Executive Summary - Data Table on Market Overview
Executive Summary - Chart on Global Market Characteristics
Executive Summary - Chart on Market by Geography
Executive Summary - Chart on Market Segmentation by Product
Executive Summary - Chart on Market Segmentation by End-user
Executive Summary - Chart on Market Segmentation by Distribution Channel
Executive Summary - Chart on Incremental Growth
Executive Summary - Data Table on Incremental Growth
Executive Summary - Chart on Company Market Positioning

2. Technavio Analysis

2.1 Analysis of price sensitivity, lifecycle, customer purchase basket, adoption rates, and purchase criteria

2.2 Criticality of inputs and Factors of differentiation

Chart on Overview on criticality of inputs and factors of differentiation

2.3 Factors of disruption

Chart on Overview on factors of disruption

2.4 Impact of drivers and challenges

Chart on Impact of drivers and challenges in 2025 and 2030

3. Market Landscape

3.1 Market ecosystem

Chart on Parent Market
Data Table on - Parent Market

3.2 Market characteristics

Chart on Market characteristics analysis

3.3 Value chain analysis

Chart on Value chain analysis

4. Market Sizing

4.1 Market definition

Data Table on Offerings of companies included in the market definition

4.2 Market segment analysis

Market segments

4.3 Market size 2025

4.4 Market outlook: Forecast for 2025-2030

Chart on Global - Market size and forecast 2025-2030 ($ million)
Data Table on Global - Market size and forecast 2025-2030 ($ million)
Chart on Global Market: Year-over-year growth 2025-2030 (%)
Data Table on Global Market: Year-over-year growth 2025-2030 (%)

5. Historic Market Size

5.1 Global Flower And Ornamental Plants Market 2020 - 2024

Historic Market Size - Data Table on Global Flower And Ornamental Plants Market 2020 - 2024 ($ million)

5.2 Product segment analysis 2020 - 2024

Historic Market Size - Product Segment 2020 - 2024 ($ million)

5.3 End-user segment analysis 2020 - 2024

Historic Market Size - End-user Segment 2020 - 2024 ($ million)

5.4 Distribution Channel segment analysis 2020 - 2024

Historic Market Size - Distribution Channel Segment 2020 - 2024 ($ million)

5.5 Geography segment analysis 2020 - 2024

Historic Market Size - Geography Segment 2020 - 2024 ($ million)

5.6 Country segment analysis 2020 - 2024

Historic Market Size - Country Segment 2020 - 2024 ($ million)

6. Qualitative Analysis

6.1 Impact of AI on Global Flower and Ornamental Plants Market

6.2 Impact of geopolitical conflicts on Global Flower and Ornamental Plants Market

7. Five Forces Analysis

7.1 Five forces summary

Five forces analysis - Comparison between 2025 and 2030

7.2 Bargaining power of buyers

Bargaining power of buyers - Impact of key factors 2025 and 2030

7.3 Bargaining power of suppliers

Bargaining power of suppliers - Impact of key factors in 2025 and 2030

7.4 Threat of new entrants

Threat of new entrants - Impact of key factors in 2025 and 2030

7.5 Threat of substitutes

Threat of substitutes - Impact of key factors in 2025 and 2030

7.6 Threat of rivalry

Threat of rivalry - Impact of key factors in 2025 and 2030

7.7 Market condition

Chart on Market condition - Five forces 2025 and 2030

8. Market Segmentation by Product

8.1 Market segments

Chart on Product - Market share 2025-2030 (%)
Data Table on Product - Market share 2025-2030 (%)

8.2 Comparison by Product

Chart on Comparison by Product
Data Table on Comparison by Product

8.3 Cut flowers - Market size and forecast 2025-2030

Chart on Cut flowers - Market size and forecast 2025-2030 ($ million)
Data Table on Cut flowers - Market size and forecast 2025-2030 ($ million)
Chart on Cut flowers - Year-over-year growth 2025-2030 (%)
Data Table on Cut flowers - Year-over-year growth 2025-2030 (%)

8.4 Potted plants - Market size and forecast 2025-2030

Chart on Potted plants - Market size and forecast 2025-2030 ($ million)
Data Table on Potted plants - Market size and forecast 2025-2030 ($ million)
Chart on Potted plants - Year-over-year growth 2025-2030 (%)
Data Table on Potted plants - Year-over-year growth 2025-2030 (%)

8.5 Market opportunity by Product

Market opportunity by Product ($ million)
Data Table on Market opportunity by Product ($ million)

9. Market Segmentation by End-user

9.1 Market segments

Chart on End-user - Market share 2025-2030 (%)
Data Table on End-user - Market share 2025-2030 (%)

9.2 Comparison by End-user

Chart on Comparison by End-user
Data Table on Comparison by End-user

9.3 Commercial - Market size and forecast 2025-2030

Chart on Commercial - Market size and forecast 2025-2030 ($ million)
Data Table on Commercial - Market size and forecast 2025-2030 ($ million)
Chart on Commercial - Year-over-year growth 2025-2030 (%)
Data Table on Commercial - Year-over-year growth 2025-2030 (%)

9.4 Residential - Market size and forecast 2025-2030

Chart on Residential - Market size and forecast 2025-2030 ($ million)
Data Table on Residential - Market size and forecast 2025-2030 ($ million)
Chart on Residential - Year-over-year growth 2025-2030 (%)
Data Table on Residential - Year-over-year growth 2025-2030 (%)

9.5 Market opportunity by End-user

Market opportunity by End-user ($ million)
Data Table on Market opportunity by End-user ($ million)

10. Market Segmentation by Distribution Channel

10.1 Market segments

Chart on Distribution Channel - Market share 2025-2030 (%)
Data Table on Distribution Channel - Market share 2025-2030 (%)

10.2 Comparison by Distribution Channel

Chart on Comparison by Distribution Channel
Data Table on Comparison by Distribution Channel

10.3 Offline - Market size and forecast 2025-2030

Chart on Offline - Market size and forecast 2025-2030 ($ million)
Data Table on Offline - Market size and forecast 2025-2030 ($ million)
Chart on Offline - Year-over-year growth 2025-2030 (%)
Data Table on Offline - Year-over-year growth 2025-2030 (%)

10.4 Online - Market size and forecast 2025-2030

Chart on Online - Market size and forecast 2025-2030 ($ million)
Data Table on Online - Market size and forecast 2025-2030 ($ million)
Chart on Online - Year-over-year growth 2025-2030 (%)
Data Table on Online - Year-over-year growth 2025-2030 (%)

10.5 Market opportunity by Distribution Channel

Market opportunity by Distribution Channel ($ million)
Data Table on Market opportunity by Distribution Channel ($ million)

11. Customer Landscape

11.1 Customer landscape overview

Analysis of price sensitivity, lifecycle, customer purchase basket, adoption rates, and purchase criteria

12. Geographic Landscape

12.1 Geographic segmentation

Chart on Market share by geography 2025-2030 (%)
Data Table on Market share by geography 2025-2030 (%)

12.2 Geographic comparison

Chart on Geographic comparison
Data Table on Geographic comparison

12.3 APAC - Market size and forecast 2025-2030

Chart on APAC - Market size and forecast 2025-2030 ($ million)
Data Table on APAC - Market size and forecast 2025-2030 ($ million)
Chart on APAC - Year-over-year growth 2025-2030 (%)
Data Table on APAC - Year-over-year growth 2025-2030 (%)
Chart on Regional Comparison - APAC
Data Table on Regional Comparison - APAC

12.3.1 China - Market size and forecast 2025-2030

Chart on China - Market size and forecast 2025-2030 ($ million)
Data Table on China - Market size and forecast 2025-2030 ($ million)
Chart on China - Year-over-year growth 2025-2030 (%)
Data Table on China - Year-over-year growth 2025-2030 (%)

12.3.2 Japan - Market size and forecast 2025-2030

Chart on Japan - Market size and forecast 2025-2030 ($ million)
Data Table on Japan - Market size and forecast 2025-2030 ($ million)
Chart on Japan - Year-over-year growth 2025-2030 (%)
Data Table on Japan - Year-over-year growth 2025-2030 (%)

12.3.3 India - Market size and forecast 2025-2030

Chart on India - Market size and forecast 2025-2030 ($ million)
Data Table on India - Market size and forecast 2025-2030 ($ million)
Chart on India - Year-over-year growth 2025-2030 (%)
Data Table on India - Year-over-year growth 2025-2030 (%)

12.3.4 Australia - Market size and forecast 2025-2030

Chart on Australia - Market size and forecast 2025-2030 ($ million)
Data Table on Australia - Market size and forecast 2025-2030 ($ million)
Chart on Australia - Year-over-year growth 2025-2030 (%)
Data Table on Australia - Year-over-year growth 2025-2030 (%)

12.3.5 South Korea - Market size and forecast 2025-2030

Chart on South Korea - Market size and forecast 2025-2030 ($ million)
Data Table on South Korea - Market size and forecast 2025-2030 ($ million)
Chart on South Korea - Year-over-year growth 2025-2030 (%)
Data Table on South Korea - Year-over-year growth 2025-2030 (%)

12.3.6 Indonesia - Market size and forecast 2025-2030

Chart on Indonesia - Market size and forecast 2025-2030 ($ million)
Data Table on Indonesia - Market size and forecast 2025-2030 ($ million)
Chart on Indonesia - Year-over-year growth 2025-2030 (%)
Data Table on Indonesia - Year-over-year growth 2025-2030 (%)

12.4 Europe - Market size and forecast 2025-2030

Chart on Europe - Market size and forecast 2025-2030 ($ million)
Data Table on Europe - Market size and forecast 2025-2030 ($ million)
Chart on Europe - Year-over-year growth 2025-2030 (%)
Data Table on Europe - Year-over-year growth 2025-2030 (%)
Chart on Regional Comparison - Europe
Data Table on Regional Comparison - Europe

12.4.1 Germany - Market size and forecast 2025-2030

Chart on Germany - Market size and forecast 2025-2030 ($ million)
Data Table on Germany - Market size and forecast 2025-2030 ($ million)
Chart on Germany - Year-over-year growth 2025-2030 (%)
Data Table on Germany - Year-over-year growth 2025-2030 (%)

12.4.2 UK - Market size and forecast 2025-2030

Chart on UK - Market size and forecast 2025-2030 ($ million)
Data Table on UK - Market size and forecast 2025-2030 ($ million)
Chart on UK - Year-over-year growth 2025-2030 (%)
Data Table on UK - Year-over-year growth 2025-2030 (%)

12.4.3 France - Market size and forecast 2025-2030

Chart on France - Market size and forecast 2025-2030 ($ million)
Data Table on France - Market size and forecast 2025-2030 ($ million)
Chart on France - Year-over-year growth 2025-2030 (%)
Data Table on France - Year-over-year growth 2025-2030 (%)

12.4.4 The Netherlands - Market size and forecast 2025-2030

Chart on The Netherlands - Market size and forecast 2025-2030 ($ million)
Data Table on The Netherlands - Market size and forecast 2025-2030 ($ million)
Chart on The Netherlands - Year-over-year growth 2025-2030 (%)
Data Table on The Netherlands - Year-over-year growth 2025-2030 (%)

12.4.5 Italy - Market size and forecast 2025-2030

Chart on Italy - Market size and forecast 2025-2030 ($ million)
Data Table on Italy - Market size and forecast 2025-2030 ($ million)
Chart on Italy - Year-over-year growth 2025-2030 (%)
Data Table on Italy - Year-over-year growth 2025-2030 (%)

12.4.6 Spain - Market size and forecast 2025-2030

Chart on Spain - Market size and forecast 2025-2030 ($ million)
Data Table on Spain - Market size and forecast 2025-2030 ($ million)
Chart on Spain - Year-over-year growth 2025-2030 (%)
Data Table on Spain - Year-over-year growth 2025-2030 (%)

12.5 North America - Market size and forecast 2025-2030

Chart on North America - Market size and forecast 2025-2030 ($ million)
Data Table on North America - Market size and forecast 2025-2030 ($ million)
Chart on North America - Year-over-year growth 2025-2030 (%)
Data Table on North America - Year-over-year growth 2025-2030 (%)
Chart on Regional Comparison - North America
Data Table on Regional Comparison - North America

12.5.1 US - Market size and forecast 2025-2030

Chart on US - Market size and forecast 2025-2030 ($ million)
Data Table on US - Market size and forecast 2025-2030 ($ million)
Chart on US - Year-over-year growth 2025-2030 (%)
Data Table on US - Year-over-year growth 2025-2030 (%)

12.5.2 Canada - Market size and forecast 2025-2030

Chart on Canada - Market size and forecast 2025-2030 ($ million)
Data Table on Canada - Market size and forecast 2025-2030 ($ million)
Chart on Canada - Year-over-year growth 2025-2030 (%)
Data Table on Canada - Year-over-year growth 2025-2030 (%)

12.5.3 Mexico - Market size and forecast 2025-2030

Chart on Mexico - Market size and forecast 2025-2030 ($ million)
Data Table on Mexico - Market size and forecast 2025-2030 ($ million)
Chart on Mexico - Year-over-year growth 2025-2030 (%)
Data Table on Mexico - Year-over-year growth 2025-2030 (%)

12.6 South America - Market size and forecast 2025-2030

Chart on South America - Market size and forecast 2025-2030 ($ million)
Data Table on South America - Market size and forecast 2025-2030 ($ million)
Chart on South America - Year-over-year growth 2025-2030 (%)
Data Table on South America - Year-over-year growth 2025-2030 (%)
Chart on Regional Comparison - South America
Data Table on Regional Comparison - South America

12.6.1 Brazil - Market size and forecast 2025-2030

Chart on Brazil - Market size and forecast 2025-2030 ($ million)
Data Table on Brazil - Market size and forecast 2025-2030 ($ million)
Chart on Brazil - Year-over-year growth 2025-2030 (%)
Data Table on Brazil - Year-over-year growth 2025-2030 (%)

12.6.2 Argentina - Market size and forecast 2025-2030

Chart on Argentina - Market size and forecast 2025-2030 ($ million)
Data Table on Argentina - Market size and forecast 2025-2030 ($ million)
Chart on Argentina - Year-over-year growth 2025-2030 (%)
Data Table on Argentina - Year-over-year growth 2025-2030 (%)

12.6.3 Chile - Market size and forecast 2025-2030

Chart on Chile - Market size and forecast 2025-2030 ($ million)
Data Table on Chile - Market size and forecast 2025-2030 ($ million)
Chart on Chile - Year-over-year growth 2025-2030 (%)
Data Table on Chile - Year-over-year growth 2025-2030 (%)

12.7 Middle East and Africa - Market size and forecast 2025-2030

Chart on Middle East and Africa - Market size and forecast 2025-2030 ($ million)
Data Table on Middle East and Africa - Market size and forecast 2025-2030 ($ million)
Chart on Middle East and Africa - Year-over-year growth 2025-2030 (%)
Data Table on Middle East and Africa - Year-over-year growth 2025-2030 (%)
Chart on Regional Comparison - Middle East and Africa
Data Table on Regional Comparison - Middle East and Africa

12.7.1 Saudi Arabia - Market size and forecast 2025-2030

Chart on Saudi Arabia - Market size and forecast 2025-2030 ($ million)
Data Table on Saudi Arabia - Market size and forecast 2025-2030 ($ million)
Chart on Saudi Arabia - Year-over-year growth 2025-2030 (%)
Data Table on Saudi Arabia - Year-over-year growth 2025-2030 (%)

12.7.2 UAE - Market size and forecast 2025-2030

Chart on UAE - Market size and forecast 2025-2030 ($ million)
Data Table on UAE - Market size and forecast 2025-2030 ($ million)
Chart on UAE - Year-over-year growth 2025-2030 (%)
Data Table on UAE - Year-over-year growth 2025-2030 (%)

12.7.3 South Africa - Market size and forecast 2025-2030

Chart on South Africa - Market size and forecast 2025-2030 ($ million)
Data Table on South Africa - Market size and forecast 2025-2030 ($ million)
Chart on South Africa - Year-over-year growth 2025-2030 (%)
Data Table on South Africa - Year-over-year growth 2025-2030 (%)

12.7.4 Turkey - Market size and forecast 2025-2030

Chart on Turkey - Market size and forecast 2025-2030 ($ million)
Data Table on Turkey - Market size and forecast 2025-2030 ($ million)
Chart on Turkey - Year-over-year growth 2025-2030 (%)
Data Table on Turkey - Year-over-year growth 2025-2030 (%)

12.7.5 Israel - Market size and forecast 2025-2030

Chart on Israel - Market size and forecast 2025-2030 ($ million)
Data Table on Israel - Market size and forecast 2025-2030 ($ million)
Chart on Israel - Year-over-year growth 2025-2030 (%)
Data Table on Israel - Year-over-year growth 2025-2030 (%)

12.8 Market opportunity by geography

Market opportunity by geography ($ million)
Data Tables on Market opportunity by geography ($ million)

13. Drivers, Challenges, and Opportunity

13.1 Market drivers

Proliferation of urban greenery and biophilic interior design
Integration of advanced automation and AI in floriculture
Expansion of E-commerce channels and subscription-based consumption models

13.2 Market challenges

Fragility of global cold chain logistics and infrastructure
Intensification of environmental regulations and sustainability mandates
Volatility of global weather patterns and climate extremes

13.3 Impact of drivers and challenges

Impact of drivers and challenges in 2025 and 2030

13.4 Market opportunities

Integration of advanced AI for hyper-personalized plant care and curation
Adoption of circular economy principles and sustainable packaging solutions
Heightened focus on biophilic wellness and therapeutic horticultural spaces

14. Competitive Landscape

14.1 Overview

14.2

Overview on criticality of inputs and factors of differentiation

14.3 Landscape disruption

Overview on factors of disruption

14.4 Industry risks

Impact of key risks on business

15. Competitive Analysis

15.1 Companies profiled

Companies covered

15.2 Company ranking index

15.3 Market positioning of companies

Matrix on companies position and classification

15.4 Anthura B.V.

Anthura B.V. - Overview
Anthura B.V. - Product / Service
Anthura B.V. - Key offerings
SWOT

15.5 Ball Horticultural Co.

Ball Horticultural Co. - Overview
Ball Horticultural Co. - Product / Service
Ball Horticultural Co. - Key offerings
SWOT

15.6 Beekenkamp Verpakkingen B.V

Beekenkamp Verpakkingen B.V - Overview
Beekenkamp Verpakkingen B.V - Product / Service
Beekenkamp Verpakkingen B.V - Key offerings
SWOT

15.7 Danziger Group

Danziger Group - Overview
Danziger Group - Product / Service
Danziger Group - Key offerings
SWOT

15.8 De Ruiter Seeds

De Ruiter Seeds - Overview
De Ruiter Seeds - Product / Service
De Ruiter Seeds - Key offerings
SWOT

15.9 Dummen Orange

Dummen Orange - Overview
Dummen Orange - Product / Service
Dummen Orange - Key offerings
SWOT

15.10 Ernst Benary Samenzucht GmbH

Ernst Benary Samenzucht GmbH - Overview
Ernst Benary Samenzucht GmbH - Product / Service
Ernst Benary Samenzucht GmbH - Key offerings
SWOT

15.11 Floritec GmbH

Floritec GmbH - Overview
Floritec GmbH - Product / Service
Floritec GmbH - Key offerings
SWOT

15.12 HilverdaFlorist

HilverdaFlorist - Overview
HilverdaFlorist - Product / Service
HilverdaFlorist - Key offerings
SWOT

15.13 KP Holland

KP Holland - Overview
KP Holland - Product / Service
KP Holland - Key offerings
SWOT

15.14 Marginpar BV

Marginpar BV - Overview
Marginpar BV - Product / Service
Marginpar BV - Key offerings
SWOT

15.15 Oserian Development Co. Ltd.

Oserian Development Co. Ltd. - Overview
Oserian Development Co. Ltd. - Product / Service
Oserian Development Co. Ltd. - Key offerings
SWOT

15.16 Rosaprima Group

Rosaprima Group - Overview
Rosaprima Group - Product / Service
Rosaprima Group - Key offerings
SWOT

15.17 Royal Van Zanten

Royal Van Zanten - Overview
Royal Van Zanten - Product / Service
Royal Van Zanten - Key offerings
SWOT

15.18 Sakata Seed Corp.

Sakata Seed Corp. - Overview
Sakata Seed Corp. - Business segments
Sakata Seed Corp. - Key offerings
Sakata Seed Corp. - Segment focus
SWOT

16. Appendix

16.1 Scope of the report

Market definition
Objectives
Notes and caveats

16.2 Inclusions and exclusions checklist

Inclusions checklist
Exclusions checklist

16.3 Currency conversion rates for US$

16.4 Research methodology

16.5 Data procurement

Information sources

16.6 Data validation

16.7 Validation techniques employed for market sizing

16.8 Data synthesis

16.9 360 degree market analysis

16.10 List of abbreviations

Research Methodology

Technavio presents a detailed picture of the market by way of study, synthesis, and summation of data from multiple sources. The analysts have presented the various facets of the market with a particular focus on identifying the key industry influencers. The data thus presented is comprehensive, reliable, and the result of extensive research, both primary and secondary.

INFORMATION SOURCES

Primary sources

  • Manufacturers and suppliers
  • Channel partners
  • Industry experts
  • Strategic decision makers

Secondary sources

  • Industry journals and periodicals
  • Government data
  • Financial reports of key industry players
  • Historical data
  • Press releases

DATA ANALYSIS

Data Synthesis

  • Collation of data
  • Estimation of key figures
  • Analysis of derived insights

Data Validation

  • Triangulation with data models
  • Reference against proprietary databases
  • Corroboration with industry experts

REPORT WRITING

Qualitative

  • Market drivers
  • Market challenges
  • Market trends
  • Five forces analysis

Quantitative

  • Market size and forecast
  • Market segmentation
  • Geographical insights
  • Competitive landscape

Interested in this report?

Get your sample now to see our research methodology and insights!

Download Now

Frequently Asked Questions

Flower And Ornamental Plants market growth will increase by USD 43832.6 million during 2026-2030.

The Flower And Ornamental Plants market is expected to grow at a CAGR of 6.9% during 2026-2030.

Flower And Ornamental Plants market is segmented by Product (Cut flowers, Potted plants) End-user (Commercial, Residential) Distribution channel (Offline, Online)

Anthura B.V., Ball Horticultural Co., Beekenkamp Verpakkingen B.V, Danziger Group, De Ruiter Seeds, Dummen Orange, Ernst Benary Samenzucht GmbH, Floritec GmbH, HilverdaFlorist, KP Holland, Marginpar BV, Oserian Development Co. Ltd., Rosaprima Group, Royal Van Zanten, Sakata Seed Corp., Schoneveld Breeding, Schreurs Holland B.V., Selecta Klemm GmbH and Co. KG, Suntory Flowers Ltd, Syngenta Flowers are a few of the key vendors in the Flower And Ornamental Plants market.

APAC will register the highest growth rate of 44.9% among the other regions. Therefore, the Flower And Ornamental Plants market in APAC is expected to garner significant business opportunities for the vendors during the forecast period.

China, Japan, India, Australia, South Korea, Indonesia, Germany, UK, France, The Netherlands, Italy, Spain, US, Canada, Mexico, Brazil, Argentina, Chile, Saudi Arabia, UAE, South Africa, Turkey, Israel

  • Proliferation of urban greenery and biophilic interior design is the driving factor this market.

The Flower And Ornamental Plants market vendors should focus on grabbing business opportunities from the Product segment as it accounted for the largest market share in the base year.
RIA - Research AI Assistant
Ask RIA
